| Issue |
A&A
Volume 656, December 2021
|
|
|---|---|---|
| Article Number | A82 | |
| Number of page(s) | 11 | |
| Section | Atomic, molecular, and nuclear data | |
| DOI | https://doi.org/10.1051/0004-6361/202141529 | |
| Published online | 06 December 2021 | |
Isotope effect on the sublimation curves and binding energies of 12CO and 13CO interstellar ice analogues
1
Appalachian State University, Department of Physics & Astronomy,
231 Garwood Hall, 525 Rivers Street,
Boone,
NC
28608-2106, USA
2
Jet Propulsion Laboratory, California Institute of Technology,
4800 Oak Grove Drive,
Pasadena,
CA
91109, USA
e-mail: murthy.gudipati@jpl.nasa.gov
3
North Carolina Museum of Natural Sciences,
121 West Jones Street, 3802B,
Raleigh,
NC
27603, USA
4
University of North Carolina at Chapel Hill, Department of Physics & Astronomy,
120 East Cameron Avenue, Phillips Hall CB3255,
Chapel Hill,
NC
27599, USA
Received:
11
June
2021
Accepted:
6
September
2021
Aims. Understanding the desorption properties and sublimation temperatures of CO is key toward constraining the astrophysical regimes within which CO exists in the gas and ice phases. Previous experimental studies using temperature programmed desorption (TPD) determined the binding energies of 12CO and 13CO without the precision that is necessary to determine the effect of isotopes on these properties, which is required when analyzing astronomical data of CO isotopologues. The purpose of this work is to precisely determine the binding energies of 12CO and 13CO.
Methods. We conducted experiments using temperature interval desorption (TID), which ensures that thermal equilibrium is reached at each temperature, as well as TPD experiments on interstellar analogues of 12CO and 13CO ices.
Results. Sublimation curves show a small but distinct separation between 12CO and 13CO ices. We found that complete sublimation of pure 12CO occurs at 28.9 ± 0.2 K and pure 13CO at 29.0 ± 0.2 K. A systematic difference of 0.1 K was found for 13CO ice compared to 12CO ice under similar desorption conditions, implying that the binding energy in the ice phase for 13CO ice is higher than that of 12CO. Our experimentally derived binding energies were determined through TID to be (12CO–12CO)Eb = (833 ± 5 K) and (13CO–13CO)Eb = (848 ± 6 K). Our results quantitatively show that 13CO is more tightly bound than 12CO in the ice phase, which could have a significant effect on CO isotopic enrichment in astrophysical settings.
Key words: molecular processes / solid state: volatile / molecular data / methods: laboratory: solid state / protoplanetary disks / circumstellar matter
© ESO 2021
1 Introduction
Carbon monoxide (CO) is the second-most abundant molecule after molecular hydrogen (H2) in the ice and gas phases of molecular clouds and protoplanetary systems, comprising a large percentage of the carbon (~30%) and oxygen (~10%) within star-forming regions (Dickman 1978). Understanding the evolution of carbon in forming stellar systems is key toward unlocking the early steps in protoplanetary, prebiotic, and solar nebular chemistry. The abundance and accessibility of CO using ground-based telescopes make it an important observational tracer of carbon-containing ice and gas within molecular clouds and protostellar environments. The mantles containing icy dust grains in protoplanetary disks have a similar composition to the dense molecular clouds from which they originated (Thi et al. 2002; Pontoppidan et al. 2003), emphasizing the relevance of accurate CO sublimation experiments to a wide range of interstellar environments. Further, understanding the desorption properties of CO in these regions is key toward constraining the conditions of astrophysical regimes in which CO exists in the ice phase. Quantification of and investigation into the desorption processes of molecules from experiments involving interstellar ice analogues have been reported in the literature in order to better understand the overall chemical nature of the interstellar medium (ISM) and young stellar systems (Sandford & Allamandola 1993; Fraser et al. 2001; Collings et al. 2004, 2003a,b; Öberg et al. 2005; Acharyya et al. 2007; Muñoz Caro et al. 2010; Luna et al. 2018).
The binding energy (Eb) of a molecular solid is defined as the energy required for the molecules to undergo a phase transition from ice to gas, and the desorption rate at any given temperature is manifested in the Eb of that ice. The effect of isotopic substitution on the binding energies and sublimation properties is known for H2O/H O/D2O ices (Smith et al. 2003), where the heavier isotopologue sublimes more slowly than the lighter isotopologue, indicating that Eb increases with increasing mass of the isotopologue. This effect of isotopic substitution on the sublimation properties of the ice could be attributed to the differences in zero-point energies as well as the equilibrium van der Waals distances between molecules in the ice crystal lattice. Should such an isotopic effect also be occurring in CO ice, its implications for interpreting isotopic ratios in the gas and ice phase need to take their binding energies into account.
The wide range in published Eb values for CO can be partially attributed to the difficulty in accurately determining the frequency (pre-exponential) factor (ν°) independently of Eb. Existing values of ν° reported in the literature were determined through a variety of methods. In Acharyya et al. (2007), ν° was estimated from physical properties of CO using an approximation of the harmonic oscillator for a solid, while Collings et al. (2003a) obtained ν° by constraining models to match experimental data, and Muñoz Caro et al. (2010) used two exponential terms to account for the desorption of CO induced by H2 and adjusted ν° to fit the experimental data. The study reported in Luna et al. (2018) focused on the direct determination of ν°. Due to the interdependence of ν° and Eb, it is important to constrain one of these parameters in order to accurately determine the other parameter. For this reason, these previous studies could not determine possible isotopic effects on CO ice sublimation. Because Eb is a more physically interpretable quantity, constraining ν° would provide experimental isotopic data that could be directly compared to astronomical observations.
Previous experiments on 12C16O and 13C16O (heretofore, 12CO and 13CO) ices utilized constant heating of the ice samples through the method of temperature programmed desorption (TPD) (Öberg et al. 2005; Acharyya et al. 2007; Muñoz Caro et al. 2010; Luna et al. 2018; Collings et al. 2003a; Bisschop et al. 2006). However, from these studies it is not possible to determine if there is a quantifiable isotopic effect due to Eb differences because either the errors are not reported or they are larger than the differences in the Eb values. Experiments on the desorption of ices at a given temperature near the sublimation point through a method we term “temperature interval desorption” (TID) have been reported (Sandford & Allamandola 1993; Luna et al. 2018). In these studies, ice samples were incrementally, rather than continuously, heated, contrary to what was done in TPD experiments.
We have undertaken a systematic experimental study with the strategy of utilizing both desorption methods – TPD and TID – to constrain ν° and accurately determine the Eb values and their associated errors.
2 Methods
Experiments to calculate precise sublimation temperatures and Eb values of 12CO and 13CO were performed in the Ice Spectroscopy Lab at the Jet Propulsion Laboratory in Pasadena, California, USA. The experimental setup (termed the “Himalaya”) consisted of an ultra-high vacuum cryogenic system capable of simulating near-astrophysical temperatures (10–35 K) and pressures (10−7–10−9 mbar). The cryochamber and instrumentation of the Himalaya are shown in the top-down schematic in Fig. 1. To achieve an ultra-high vacuum, an Agilent Turbo-V 301 Navigator turbomolecular pump was directly connected to the cryochamber through a 6-inch CF (ConFlat flange) gate valve. Under these conditions, CO is pumped at a rate of 250 L s−1. An Agilent IDP-15 dry-scroll roughing pump was used to establish a baseline vacuum (10−3 mbar) and support the turbopump. Cooling of the system was provided by a Sumitomo RDK-415D28 closed-cycle helium cryostat, mounted vertically at the top of the cryochamber. Ice samples were grown on a sapphire window that was seated in an oxygen-free copper window holder that was attached to the end of the cold head by 0.25-inch-diameter screws. Indium gaskets were used to ensure a thermally conductive seal at all of the junctions between the window, window holder, and cold head. The temperature of the window was monitored and controlled by a Lakeshore DT-670-SD silicon diode that was factory-mounted immediately above the window holder at the tip of the cryostat and a 100-watt heating element attached at the end of the cryohead and connected to a Lake Shore 330 auto-tuning temperature controller capable of precisely controlling temperature within 0.1 K. The composition and abundance of ice-phase samples were monitored with absorption spectroscopy derived from single-beam transmission spectra using a Nicolet 6700 Fourier Transform Infrared Spectrometer (FTIR) equipped with a LN2 -cooled MCT/B (Hg-Cd-Te) detector. A Stanford Research Systems (SRS) RGA-300 quadrupole mass spectrometer (QMS) equipped with a high-sensitivity (≥10−12 mbar) electron multiplier was used to quantify the partial pressures of molecules in the gas phase.
In order to prepare pure ice samples, ultra-high purity 12CO and 13CO gases were subjected to a two-step contamination removal process to freeze out remaining impurities, most commonly the volatiles CO2 and CO3. This purification technique utilized a cold finger submerged in LN2 for one hourto freeze out contaminant molecules with sublimation temperatures greater than 77 K under vacuum. Contaminants were frozen out into a separate cold finger as the gas bulb was filled in an external gas handling system. During ice deposition, any remaining residual contaminant molecules were trapped by cooling the cold finger inbuilt in the gas bulb with liquid nitrogen. Pure 12CO and 13CO ices were grown by directing the purified CO gas through a 0.25-inch OD (outer diameter) (0.125-inch ID (inner diameter)) stainless-steel tube and depositing it on the sapphire window at 20 K, where the end of the tube was oriented at the normal of the window from a distance of ≃1.5 inch (Fig. 1). The deposition process lasted for 30 min, with the flow of CO increasing the total system pressure to ~ 5 × 10⁻⁹ mbar from a background pressure of ~ 1.5 × 10⁻¹⁰ mbar. The primary residual gas in the chamber was H2 with a partial pressure of ~1.3 × 10⁻¹⁰ mbar as measured by the QMS with an electron multiplier that has partial pressure sensitivity up to ~ 10−12 mbar. Using this procedure, we obtained an absorbance of ~0.4 for the CO stretching band (2139 cm−1 for 12CO and 2092 cm−1 for 13CO), corresponding to ~ 200 monolayers of CO ice, where a monolayer is approximately 1015 molecules cm−2. Before each ice deposition, QMS spectra were collected to determine the composition of the background rest gases in the chamber (Fig. 2A).
The primary constituent of the background gases was H2, which does not deposit on the window at 20 K and therefore has no effect on the purity of the ice samples. After H2, water was the next most abundant contaminant, at a partial pressure of ~ 3.2 × 10⁻¹¹ mbar, which is more than two orders of magnitude lower than the partial pressure of CO (Fig. 2B). Thus, we are confident that water did not interfere with the properties of CO ice. During the entire deposition period, the QMS was used to also monitor the partial pressures of CO and of major atmospheric contaminants in the chamber, in particular N (14 m/z), O (16 m/z), OH (17 m/z), H2O (18 m/z), O2 (32 m/z), and CO2 (44 m/z). During deposition we see only the fragments of CO, which are C, m/z = 12; and O, m/z = 16 (Fig. 2B). The absence of a peak at N, m/z = 14 demonstrates that, during deposition, N2 contamination is insignificant. In order to ensure that there was no contamination, such as H2O, affecting our experiments, we followed the evolution of the IR spectra in the 3 μm water absorption region alongside the depletion of CO for both TID and TPD experiments. These data, provided in the appendix (Fig. A.1), show no observable accretion of H2O throughout the duration of the experiments, providing evidence that the CO desorption was not significantly affected by contamination. We were thus able to establish that there were no leaks in the vacuum system during deposition that could adversely affect the CO ice purity. After the completion of deposition, the FTIR was used to determine the purity and initial concentration of the CO ice. For each isotopologue, experiments were conducted twice using the TPD method (Sect. 2.1) and thrice using the TID method (Sect. 2.2), and all results were used to derive ν° and Eb values (Sect. 2.3).
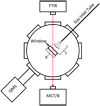 |
Fig. 1 Schematic of the Himalaya, showing a top-down view of the cryochamber and the relative orientation of the QMS, FTIR, MCT/B, and the gas inlet tube (r ≃ 1.5 inch) with respect to the sapphire window (diameter, d = 1.0 inch) at the center of the cryochamber. |
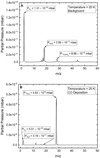 |
Fig. 2 QMS spectra collected at 20 K showing (A) the composition of the background rest gases and (B) the composition of the gases in the chamber while depositing CO gas onto the window. As shown in (A), the primary background gases prior to deposition are H2 (2 m/z), H2O (18 m/z), and a combination of 12CO and N2 (28 m/z). During deposition (B), the partial pressure of H2O is more than two orders of magnitude lower than CO, indicating that water would not have any effect on CO ice properties. |
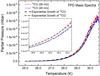 |
Fig. 3 Comparison of 12CO and 13CO TPD curves,showing that 13CO desorption islower than 12CO at any given temperature, in agreement with the TID experiments (Fig. 4). The TPD curves of both isotopologues were fitted with a single exponential growth function (R2 > 0.997) to quantify the zero-order reaction behavior. Beyond 30 K, the partial pressure of CO deviates significantly from the exponential fit because at 30 K all the CO is sublimed into the gas phase and removal of gas-phase CO using conventional turbomolecular pumps is a slow process. The inset shows a zoomed-in view of the portion between 28.5 and 29.5 K. |
2.1 Temperature programmed desorption (TPD)
We conducted TPD experiments as described in Collings et al. (2003a), Öberg et al. (2005), Bisschop et al. (2006), Acharyya et al. (2007), and Muñoz Caro et al. (2010) for the purpose of comparing Eb to previously reported values, as well as to derive ν° (Sect. 2.3). After the deposition of CO ice films, the system was left to equilibrate for one hour at the deposition temperature of 20.0 K while pre-TPD measurements were taken with the QMS and FTIR. During TPD, samples were heated from 20.0 to 50.0 K. The heating rate was 0.1 K min−1, the lowest possible temperature increment for the Lakeshore 330 temperature controller. This heating rate was also used by Öberg et al. (2005) and Acharyya et al. (2007) for 12CO, and Bisschop et al. (2006) and Acharyya et al. (2007) for 13CO, thus enabling relevant comparisons with our work. During TPD, the outgassed molecules were constantly monitored by the QMS pressure versus time (Pvt) scan and subsequently converted to pressure versus temperature (PvT) curves (Fig. 3). The remaining ice concentration was monitored by collecting FTIR spectra every minute, providing one spectrum per 0.1 K increment. Spectra for each of the one-minute intervals were obtained by averaging 52 individual scans at an instrumental resolution of 1 cm−1.
We used a standard exponential growth function to fit the TPD curves obtained from Pvt data and show that CO desorption is a zero-order process (Fig. 3).
2.2 Temperature interval desorption (TID)
In order to precisely determine the sublimation temperatures of 12CO and 13CO, we allowed the ice films to thermally equilibrate at a given temperature using TID methods similar to those described by Sandford & Allamandola (1993) and Luna et al. (2018). In contrast to the constant rate of heating used in the TPD method, TID utilizes incremental changes in temperature and ensures thermal equilibration of the ice films at each temperature. Allowing the samples to reach thermal equilibrium reduces the influence of the temperature gradient between theheating element and the ice film. Following the deposition of CO ice films, initial QMS and FTIR spectra were collected. For TID experiments, FTIR spectra were collected by averaging 200 individual scans at 1 cm−1 resolution to achieve a high signal-to-noise ratio and allow for the precise determination of the ice abundance. The temperature of the sample was increased at a rate of 0.5 K min−1 from 20.0 K(the deposition temperature) to 25.0 K, the temperature at which there was no measurable CO sublimation. The ice was kept at 25 K for 15 min to achieve thermal equilibration. Both FTIR and QMS spectra were collected at the end of the equilibration period. The rate of heating was decreased to 0.1 K min−1 for the remainder of the experiment. Ice samples were then thermally equilibrated for 60 min at 27.0 K and 28.0 K to determine the onset of quantifiable desorption, and QMS and FTIR spectra were collected after the 60-minute equilibration period at both temperatures. Initial results revealed that the onset of detectable desorption occurred at 28.0 K for 12CO and 13CO during the 60-minute equilibration (Fig. 4). For this reason, spectra beyond 28.0 K were taken at 0.1 K intervals after 30-minute equilibration at each temperature interval until the CO ice samples had completely desorbed (12CO, 28.9 K; 13CO, 29.0 K), as shown in Fig. 4.
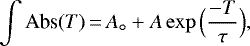
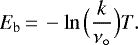
We used an exponential decay function,
 (1)
(1)
to fit the integrated IR absorbance of CO at each equilibrated temperature from our three repeated TID experiments (Fig. 4). In Eq. (1), A° is the initial absorbance of the ice, A is the amplitude of the exponential, and τ is the time constant governing the rate of decay.
The temperatures at which complete sublimation occurred for 12CO and 13CO were derived by setting ∫ Abs(T) = 0 in Eq. (1) for each isotopologue.
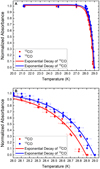 |
Fig. 4 Normalized ice absorbance at each equilibrated temperature for 12CO ice (red squares) and 13CO ice (blue circles) obtained from each of the three TID experiments per isotopologue, showing (A) the entire TID temperature range and (B) the range of temperatures with measurable desorption. Exponential decay fits from Eq. (1) are shown as solid lines. Fit parameters are: A° = 1.01 ± 0.2, A = (−1.0 ± 4.0) × 10−33, and τ = − 0.38 ± 0.04 K for 12CO; and A° = 1.02 ± 0.02, A = (−0.6 ± 2.0) × 10−34, and τ = −0.37 ± 0.02 K for 13CO. Both curves have an associated R2 > 0.97. |
2.3 Binding energy calculations
We used theArrhenius equation,
![\begin{equation*}k\,{=}\,\nu_{i}[N_{\textrm{s}}(X)]^{i}\exp\Big(\frac{-E_{\textrm{b}}}{T}\Big),\end{equation*}](/articles/aa/full_html/2021/12/aa41529-21/aa41529-21-eq3.png) (2)
(2)
to quantify the relationship between desorption rate and temperature. Here, k is the desorption rate in molecules per second, νi is the pre-exponential factor for a reaction of order i, Ns is the column density of particles on the surface of the ice belonging to species X for a reaction of order i, Eb (K) is the binding energy of a molecule belonging to species X, and T is the reaction temperature in K. For a desorption process, we assumed a zero-order (i = 0) reaction since the thickness of our ice in all experiments was a few hundred monolayers. Thus, the desorption rate is independent of the CO concentration in the ice phase, and the pre-exponential factor is expressed as νi = ν°. While the Polanyi-Wigner equation is used to derive the Eb in experiments with thin ice samples of a few monolayers (e.g., He et al. 2016), for our experiments we used the Arrhenius equation, which is appropriate for thick ice samples where a reaction order of i = 0 can be assumed.
To determine Eb from the TID experimental data at different temperatures, Eq. (2) can be rearranged to yield the binding energy for a given temperature, desorption rate, and ν°:
 (3)
(3)
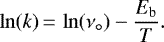
For TPD experiments, Eb and ν° were simultaneously determined using the following form of the Arrhenius equation:
 (4)
(4)
The QMS experimental data (Fig. 3) were used to calculate the number of CO molecules, which in turn was used to calculate k at each temperature (T), as described in Sect. 2.4. The slope of the linearregression yields the binding energy, and the natural logarithm of the pre-exponential factor (ln(ν°)) is the y intercept (Fig. 5).
The Eb values were calculated in two ways in order to understand their dependence on ν°. First, the Eb was calculated using the intercept (ln(ν°)) as a fixed parameter with values from Collings et al. (2003a), Bisschop et al. (2006), Acharyya et al. (2007), and Muñoz Caro et al. (2010). Subsequently, we calculated Eb with ν° as a free parameter. The final values of Eb and ν° from TPD experiments were calculated as the weighted mean of values determined from each of the two experiments per isotopologue.
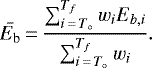
For TID experiments, the final Eb values were derivedby averaging the individual Eb values obtained from the three experiments per isotopologue from a range of temperatures (28.2–28.6 K for 12CO; and 28.3–28.7 K for 13CO) at which desorption was significant but not complete:
 (5)
(5)
The binding energies (Eb,i) at each index temperature (i, in the range from T° to Tf) are weighted according to the inverse square of their uncertainty (wi):
 (6)
(6)
We calculated the uncertainty (standard error of the weighted mean) in  and ν° using
 (7)
(7)
We treated each TID data point in an experiment as an independent measurement since each datum was collected at a different temperatureand initial ice abundance.
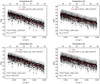 |
Fig. 5 Arrhenius plots produced from TPD experiments on both 12CO (left column) and 13CO (right column). The intercept was fixed to ln(ν°) from Muñoz Caro et al. (2010) (top left) and Acharyya et al. (2007) (top right) or taken as a free parameter (bottom row) to determine Eb from the slope. |
2.4 Quantifying the desorption rate
2.4.1 TID experiments
The temperature of the ice was incremented in steps of 0.1 K and at a rate of 0.1 K min−1 and then equilibrated at a given temperature for 30 min. The FTIR absorbance data were used to calculate the average desorption rate over the equilibration period.
Integrated absorbances of 12CO (2139 cm−1) and 13CO (2092 cm−1) were converted to optical depths ( ) through the scaling factor of 2.303 from the logarithmic base change between optical depth and absorbance as described in Hudgins et al. (1993). The column densities (Nice) of the ice were then calculated from the optical depth and band strength (Ai) of CO (1.1 × 10⁻¹⁷ cm molecule−1 for 12CO; Jiang et al. 1975; and 1.3 × 10⁻¹⁷ cm molecule−1 for 13CO; Gerakines et al. 1995) using:
 (8)
(8)
The change in the column density of CO ice over a given period of time yields the rate of desorption (k), which is used in Eq. (3) to derive the Eb at each temperature.
2.4.2 TPD experiments

the experimentally observed Pvt data from the QMS measurements were converted to the number of desorbed CO molecules in the gas phase (Ngas) at each time interval. Here, P is the partial pressure of CO, T is the temperature of the desorbing CO molecules, kB is the Boltzmann constant, and V is the total effective volume of the gas that is removed from the chamber between measurements. Because the QMS is calibrated by the vendor with N2 at room temperature (SRS Operating Manual and Programming Reference: Models RGA100, RGA 200, RGA 300 Residual Gas Analyzer, 1st edn. 2009), and because the ionization cross sections of N2 and CO at 70 eV used for QMS measurements are almost identical, we did not make any further corrections for the ionization efficiency of CO. We calculated the number of gas-phase CO molecules assuming that the desorbed molecules have the same temperatureas the ice.
The number of CO molecules in the ice phase (Nice, derived from TID experiments) and the number of CO molecules in the gas phase (Ngas, derived from TPD experiments) were used to determine the average desorption rate (k) between twotemperature intervals. This was achieved by using the differential equation for the reaction rate of a zero-order process:
 (10)
(10)
Nl and Nh are the number of molecules at the beginning (Nl, N at the lower temperature) and end (Nh, N at the higher temperature) of a given temperature interval.
2.5 Experimental uncertainties
2.5.1 TID experiments
The uncertainties in the sublimation temperatures and Eb values were calculated by propagating the following sources of uncertainties: the background noise from the FTIR absorption spectra (δ ∫ Abs = ±0.02 cm−1), the fluctuations in the temperature controller (δT = ±0.05 K), and the uncertainties in experimentally derived values of ν° (for 12CO, δν° = ±4.2 × 1025 s−1; for 13CO, δν° = ±6.4 × 1025 s−1; Table 2). The uncertainties in the sublimation temperatures (± 0.2 K) were obtained from the least-squares analysis of the sublimation curves (Fig. 4), accounting for the measurement uncertainties in both the FTIR integrated absorbance and the temperature. The uncertainties in T, ν°, and k were propagated through the Arrhenius equation to derive the uncertainties for the individual Eb values from the TID experiments:
 (12)
(12)
2.5.2 TPD experiments
The uncertainties in Eb and ν° calculated from TPD data were obtained from the least-squares regression analysis of the Arrhenius plot data, accounting for the measurement uncertainties associated with the fluctuations in the Pvt signal.
We determined the weighted mean ( ; Eq. (5)), where the uncertainties were taken as the weights (wi; Eq. (6)). Equation (7) was used to derive the standard error of the weighted mean (
 ).
).
An example of error estimation is as follows: for a 12CO TID experiment at 28.5 ± 0.05 K, the Eb and its associated uncertainty were determined using Eqs. (3) and (12) to be Eb = 834 ± 20 K. The  (Eq. (5)) and
  (Eq. (7)) of 12CO were derived from Eb values calculated at different temperatures and from duplicate experiments to be 833 ± 5 K.
CO ice is unique among major interstellar molecules in that its sublimation occurs within 1 K, requiring rigorous experimental data to determine the binding energies of 12CO and 13CO. We therefore carried out both TPD and TID experiments under the same experimental conditions, repeated them several times, and found small but systematic differences in the sublimation kinetics of 12CO and 13CO in every experiment without exception. As a result, we derive the binding energies and the associated error bars with high confidence.
3 Results
Data from the normalized IR absorbance values at each temperature from the three TID experiments for each isotopologue are plotted in Fig. 4 and fitted with an exponential decay function (R2 > 0.97). Fourier-transform IR spectra (Fig. 6) from a TID experiment on 12CO (Fig. 6A) and 13CO (Fig. 6B) show the degree of change in ice abundance between experimental temperatures. The first observable depletion of CO was noticed at 28.0 K. Fifty-percent depletion of the ice occurred at 28.6 K for 12CO and at 28.7 K for 13CO. As shown in Figs. 4 and 6, complete desorption of the ice occurred at 28.9 ± 0.2 K for 12CO and at 29.0 ± 0.2 K for 13CO. While this 0.1 K difference in sublimation temperature is within the 0.2 K error derived from the fits (Fig. 4), it is systematically found among the six experiments. Further, we observed the same behavior during the four TPD experiments, where at any given temperature the desorption rate of 12CO was slightly higher than that of 13CO (Fig. 3). Based on these independent experimental results, we are confident that the observed differences in the desorption temperatures of 12CO and 13CO are real.
The TPD curves of the 12CO and 13CO partial pressures measured by the QMS were fitted with a single exponential growth function (R2 > 0.997) to show the zero-order reaction behavior (Fig. 3). The corresponding IR spectra of the CO ice at different temperatures are shown in Fig. 7. We systematically observed 13CO ice desorption to be lower than for 12CO at any giventemperature, possibly due to differences in their binding energies. The exponential curves were only fitted up to 30 K because beyond this temperature the partial pressure of CO significantly deviates from the exponential fit (Fig. 3). This deviation is due to all of the CO ice subliming into the gas phase by 31.8 K, as observed in the IR spectra (Fig. 7), making physical interpretation of QMS data beyond 30 K nontrivial.
The Eb values for 12CO and 13CO were determined from the TPD experiments using Eq. (4). As detailed in Sects. 2.3 and 2.4, CO desorption during TPD was monitored through the QMS. The number of molecules desorbed (N) was computed from the QMS data and used to calculate the rate of desorption (k) at each temperature(T). Plotting ln(k) versus  yields Eb from the slope and ln (ν°) from the y intercept (Fig. 5). The Eb values were calculated from each TPD experiment using fixed values of ν° from the literature (Fig. 5, top row) and by taking ν° as a free parameter (Fig. 5, bottom row; Table 1). The final values of Eb and ν° are weighted means from the two TPD experiments (Table 2). Using ν° values from Luna et al. (2018), Muñoz Caro et al. (2010), Acharyya et al. (2007), Bisschop et al. (2006), and Collings et al. (2003a) gave systematically higher Eb values than when ν° values were derived as a free parameter from our experiments, with our results for ν° being approximately a factor of ten lower than the literature values (Table 2).
Our final Eb values (833 ± 5 K for 12CO and 848 ± 6 K for 13CO) derived using our ν° and our TID data are shown in Table 2.
4 Discussion
Results from our desorption experiments using the TID method (Fig. 4) show a 0.1 K difference between the sublimation temperatures of 12CO (28.9 ± 0.2 K) and 13CO (29.0 ± 0.2 K) ices. This difference is within the calculated error (±0.2 K) but was found across all six experiments (three each for 12CO and 13CO) and therefore is systematic, indicating that (13CO–13CO)Eb is greater than (12CO–12CO)Eb. Thus, we attribute the difference in sublimation curves of 12CO and 13CO ices shown in Fig. 4B as being due to the difference in mass of the two isotopologues. A similar isotopic effect has been observed in H2O/H O/D2O ice (Smith et al. 2003), thus providing a basis for a generalized hypothesis that isotopic substitution governs ice sublimation properties of molecules in astrophysical ices.
While the Eb values derived using our data and ν0 as a free parameter ((12CO–12CO)Eb = 833 ± 5 K; 13CO–13CO)Eb = 848 ± 6 K) are in general agreement with the values reported by Muñoz Caro et al. (2010), Acharyya et al. (2007), Bisschop et al. (2006), Öberg et al. (2005), and Collings et al. (2003a), there are subtle yet important differences. Based on three independent experiments containing five independent data points each for both 12CO and 13CO, the final Eb values (the weighted mean of 15 data points) are 833 ± 5 K for 12CO and 848 ± 6 K for 13CO. The associated standard deviations (SD) of our 15 Eb values are SD = 12 K for 12CO and SD = 10 K for 13CO, while the propagated standard errors are  5 K for 12CO and
  6 K for 13CO. Our combined TPD and TID experiments provide, for the first time, a clear difference in Eb values, with (12CO–12CO)Eb being 15 ± 11 K lower than (13CO–13CO)Eb. Further, for a given pre-exponential factor, we see significant differences in the Eb values derived from our experiments as compared to findings reported the literature (Table 2). Due to the tight correlation between ν° and Eb (Eq. (4)), it is critical to use a ν° derived under experimental conditions similar to those used when deriving Eb.
Further, we find that TID-derived Eb values are systematically lower than those derived from TPD. This could be explained by the narrow desorption temperature range of CO ice (28–29 K) enabling a more accurate constraint of desorption rate, using TID as opposed to TPD. The constant heating rate of 0.1 K min−1 used in our TPD experiments is fast when compared to the ~1 K sublimation temperature range of CO and does not provide sufficient time for the ice to equilibrate at each temperature. On the other hand, the TID method ensures thermal equilibration of the ice film, thus providing a more accurate determination of the desorption rate and, therefore, binding energies. Other astrophysically relevant ices have much broader sublimation temperature ranges; for example, CO2 (~ 85–92 K; Luna et al. 2018)and H2O (~ 135–165 K; Fraser et al. 2001) can decrease the effect of the delay in thermal equilibration on the apparent desorption rate. Because of the narrow sublimation temperature range for CO ice (Fig. 4), we find that a heating of rate of 0.1 K min−1 is insufficient for thermal equilibration, resulting in higher estimates of Eb values from TPD. This behavior is also revealed from the IR spectra that were obtained during the TPD experiments (Fig. 7). In contrast to IR spectra from TID experiments, where significant sublimation of CO is clearly seen at 28.6 K (Fig. 6A for 12CO ice), during TPD experiments significant depletion of 12CO ice is seen only at 31.5 K (Fig. 7A). This difference in sublimation temperature demonstrates that the heating rate of 0.1 K min−1 in the TPDexperiments is too fast for the ice to reach thermal equilibrium. As a result, the Eb values derived using the TPD method will be consistently overestimated (Table 2). However, gas-phase QMS measurements during constant heating in the TPD experiments provide a good estimate of ν°, which is independent of temperature in this narrow temperature range (Eq. (4)).
Under our experimental conditions, the lowest possible heating rate is 0.1 K min−1, which is similar to the rate used by Acharyya et al. (2007) and Bisschop et al. (2006). However, despite the similar heating rate, their ν° values differ from ours (Table 2). Our Eb value from TID for 12CO (833 ± 5 K) agrees closely with the value of 834 K obtained from the Muñoz Caro et al. (2010) TPD study, where the ice was heated at 1.0 K min−1. In addition, our Eb values come within 1σ of those in Acharyya et al. (2007) and Bisschop et al. (2006). We note that because of the highly correlated nature of Eb and ν°, it is possible to get similar Eb values by using different values for ν°, even with different heating rates. However, slower heating rates will lead to better thermal equilibration of the ice, which in turn leads to more accurate measurements of the desorption rate.
The comparison above demonstrates that in order to obtain the most accurate Eb values, it is necessary to have data from both TPD (for ν°) and TID (for thermally equilibrated desorption rates, k) experiments obtained under similar experimental conditions.
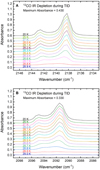 |
Fig. 6 FTIR absorption spectra collected during TID experiments on 12CO (A) and 13CO (B). The spectra shown are vertically shifted in increments of 0.050 absorbance units (from the highest to the lowest temperature) to show the evolution of the IR absorbance during TID experiments. For example, in (A), at 20 K, the peak absorbance is shown to be 1.030, but, accounting for the 0.600 absorbance unit shift, the peak absorbance is 0.430. |
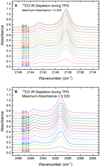 |
Fig. 7 FTIR absorption spectra collected during TPD experiments on 12CO (A) and 13CO (B). The spectra shown are vertically shifted in increments of 0.050 absorbance units (from the highest temperature to the lowest temperature) to show the evolution of the IR signal throughout TPD experiments. For example, in (A), at 20 K, the peak absorbance is shown to be 1.099, but, accounting for the 0.750 absorbance unit shift, the peak absorbance is 0.349. |
Weighted means of TPD- and TID-derived (12CO–12CO)Eb and (13CO–13CO)Eb compared with literature values.
5 Astrophysical implications
Our findings of slightly higher sublimation temperature and Eb for 13CO suggest that pure 13CO ice is more strongly bound than 12CO ice in astrophysical settings. Further, we infer that the interaction potential between 13CO–13CO is stronger than for 12CO–12CO, and, based on the van der Waals pair-potentials approximation, the (12CO–13CO)Eb would be 840 ± 4 K, the average of (12CO–12CO)Eb = 833 ± 5 K and (13CO–13CO)Eb = 848 ± 6 K. These results suggest that more 13CO should be inthe ice versus gas phase during the early onset of thermal desorption. In the absence of other fractionation mechanisms, under thermal equilibrium conditions between CO ice and gas phases, we expect the gas-phase [12CO]/[13CO] ratio to increase as the local temperature approaches 28 K.
Our results have further implications for the protoplanetary environments of solar-type stars. High-resolution spectroscopic observations of CO toward several young stellar objects (YSOs) at a Galactocentric radius of ~ 8 kpc – our local solar neighborhood – show heterogeneity in the gas-phase [12CO]/[13CO] ratio, ~ 85–165 (Smith et al. 2015), compared to the local ISM, ~68 (Milam et al. 2005). The results of Smith et al. (2015) suggest that additional fractionation processes may be influencing the gas-phase carbon reservoirs. Our experimental detection of a 0.1 K difference in the sublimation temperatures between 12CO and 13CO, reflecting the consistently lower Eb of 12CO ice, could be a molecular explanation for the isotopic fractionation between CO ice and gas in YSOs suggested in Smith et al. (2015). While precise models are needed to quantitatively evaluate the impact of binding energy differences on fractionation from ice to gas phases, we conclude that differences in sublimation temperatures and Eb could play akey role in carbon chemistry in protoplanetary environments. Taken with the observed effects in H2O/H O/D2O ice (Smith et al. 2003), we propose that isotopic effects could have a more extensive influence on the sublimation of astrophysical ices.
6 Conclusions
Using the TID method, we find a systematic 0.1 K difference in the sublimation curves between 12CO and 13CO, suggesting that 13CO is more strongly bound in the ice phase.
Using complementary TPD and TID experiments under the same conditions, we have been able to derive Eb values of 12CO (833 ± 5 K) and 13CO (848 ± 6 K) ices with significantly smaller error bars than previously reported. The (12CO–12CO)Eb derived from our TID data is 15 ± 11 K lower than the (13CO–13CO)Eb. Such a difference has not been previously reported, possibly due to the high error margins in earlier studies.
Based on our results, we conclude that 13CO is more strongly bound than 12CO in the ice phase. In astrophysical environments with low temperatures near the sublimation point of CO (e.g., around 28.0 K), we expect that CO ice will be enriched with 13CO. This enrichment, resulting from the differences in binding energies of CO isotopologues manifested in their sublimation temperatures, could have a significant effect on the evolution of the carbon reservoirs in protoplanetary systems.
Acknowledgements
We gratefully acknowledge support of this project through NASA Emerging Worlds program (Grant NNX17AE34G). The majority of this work has been carried out at the Jet Propulsion Laboratory, California Institute of Technology, under a contract with the National Aeronautics and Space Administration. We acknowledge Elisabeth Panto for her participation in the initial experiments.
Appendix A Supplemental figures
Figure A.1 shows the evolution of the IR spectrum in the 3μm water absorption region, alongside the depletion of CO for both the TID and TPD experiments. These data show no observable accretion of H2O throughout the duration of the experiments, providing evidence that the CO desorption was not significantly affected by contamination.
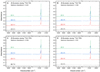 |
Fig. A.1 IR spectra of 12CO and 13CO ices in the absorption regions of CO and H2O, showing that our TPD and TID experiments were not influenced by accumulation of water ice, which has an absorption feature from 3400 cm−1 to 3100 cm−1. Spectra for 12CO and 13CO are shown for TID (A and B, respectively) and TPD (C and D, respectively) experiments. TID spectra were vertically shifted in increments of 0.150 absorbance units (from highest temperature to lowest temperature), and for TPD by 0.200 absorbance units, in order to enable similar comparisons between spectra. For example, in (A), at 20 K, the peak absorbance is shown to be 0.871, but, accounting for the 0.450 absorbance unit shift, the peak absorbance is 0.421. |
References
- Acharyya, K., Fuchs, G. W., Fraser, H. J., van Dishoeck, E. F., & Linnartz, H. 2007, A&A, 466, 1005 [NASA ADS] [CrossRef] [EDP Sciences] [Google Scholar]
- Bisschop, S. E., Fraser, H. J., Öberg, K. I., van Dishoeck, E. F., & Schlemmer, S. 2006, A&A, 449, 1297 [NASA ADS] [CrossRef] [EDP Sciences] [Google Scholar]
- Collings, M. P., Dever, J. W., Fraser, H. J., & McCoustra, M. R. S. 2003a, Ap&SS, 285, 633 [Google Scholar]
- Collings, M. P., Dever, J. W., Fraser, H. J., McCoustra, M. R. S., & Williams, D. A. 2003b, ApJ, 583, 1058 [NASA ADS] [CrossRef] [Google Scholar]
- Collings, M. P., Anderson, M. A., Chen, R., et al. 2004, MNRAS, 354, 1133 [NASA ADS] [CrossRef] [Google Scholar]
- Dickman, R. L. 1978, ApJS, 37, 407 [CrossRef] [Google Scholar]
- Fraser, H. J., Collings, M. P., McCoustra, M. R. S., & WIlliams, D. A. 2001, MNRAS, 327, 1165 [NASA ADS] [CrossRef] [Google Scholar]
- Gerakines, P. A., Schutte, W. A., Greenberg, J. M., & van Dishoeck, E. F. 1995, A&A, 296, 810 [NASA ADS] [Google Scholar]
- He, J., Acharyya, K., & Vidali, G. 2016, ApJ, 825, 89 [Google Scholar]
- Hudgins, D. M., Sandford, S. A., Allamandola, L. J., & Tielens, A. G. G. M. 1993, ApJS, 86, 713 [NASA ADS] [CrossRef] [Google Scholar]
- Jiang, G. J., Person, W. B., & Brown, K. G. 1975, J. Chem. Phys., 64, 1201 [NASA ADS] [CrossRef] [Google Scholar]
- Luna, R., Domingo, M., Millán, C., Santonja, C., & Satorre, M. A. 2018, Vacuum, 152, 278 [NASA ADS] [CrossRef] [Google Scholar]
- Milam, S. N., Savage, C., Brewster, M. A., Ziurys, L. M., & Wyckoff, S. 2005, ApJ, 634, 1126 [Google Scholar]
- Muñoz Caro, G. M., Jiménez-Escobar, A., Martín-Gago, J. A., et al. 2010, A&A, 522, A108 [NASA ADS] [CrossRef] [EDP Sciences] [Google Scholar]
- Öberg, K. I., van Broekhuizen, F., Fraser, H. J., et al. 2005, ApJ, 621, L33 [Google Scholar]
- Pontoppidan, K. M., Fraser, H. J., Dartois, E., et al. 2003, A&A, 408, 981 [NASA ADS] [CrossRef] [EDP Sciences] [Google Scholar]
- Sandford, S. A., & Allamandola, L. J. 1993, ApJ, 417, 815 [CrossRef] [Google Scholar]
- Smith, J. A., Livingston, F. E., & George, S. M. 2003, J. Phys. Chem. B, 107, 3871 [Google Scholar]
- Smith, R. L., Pontoppidan, K. M., Young, E. D., & Morris, M. R. 2015, ApJ, 813, 120 [NASA ADS] [CrossRef] [Google Scholar]
- Thi, W. F., Pontoppidan, K. M., van Dishoeck, E. F., Dartois, E., & d’Hendecourt, L. 2002, A&A, 394, L27 [NASA ADS] [CrossRef] [EDP Sciences] [Google Scholar]
All Tables
Weighted means of TPD- and TID-derived (12CO–12CO)Eb and (13CO–13CO)Eb compared with literature values.
All Figures
|
Fig. 1 Schematic of the Himalaya, showing a top-down view of the cryochamber and the relative orientation of the QMS, FTIR, MCT/B, and the gas inlet tube (r ≃ 1.5 inch) with respect to the sapphire window (diameter, d = 1.0 inch) at the center of the cryochamber. |
| In the text | |
|
Fig. 2 QMS spectra collected at 20 K showing (A) the composition of the background rest gases and (B) the composition of the gases in the chamber while depositing CO gas onto the window. As shown in (A), the primary background gases prior to deposition are H2 (2 m/z), H2O (18 m/z), and a combination of 12CO and N2 (28 m/z). During deposition (B), the partial pressure of H2O is more than two orders of magnitude lower than CO, indicating that water would not have any effect on CO ice properties. |
| In the text | |
|
Fig. 3 Comparison of 12CO and 13CO TPD curves,showing that 13CO desorption islower than 12CO at any given temperature, in agreement with the TID experiments (Fig. 4). The TPD curves of both isotopologues were fitted with a single exponential growth function (R2 > 0.997) to quantify the zero-order reaction behavior. Beyond 30 K, the partial pressure of CO deviates significantly from the exponential fit because at 30 K all the CO is sublimed into the gas phase and removal of gas-phase CO using conventional turbomolecular pumps is a slow process. The inset shows a zoomed-in view of the portion between 28.5 and 29.5 K. |
| In the text | |
|
Fig. 4 Normalized ice absorbance at each equilibrated temperature for 12CO ice (red squares) and 13CO ice (blue circles) obtained from each of the three TID experiments per isotopologue, showing (A) the entire TID temperature range and (B) the range of temperatures with measurable desorption. Exponential decay fits from Eq. (1) are shown as solid lines. Fit parameters are: A° = 1.01 ± 0.2, A = (−1.0 ± 4.0) × 10−33, and τ = − 0.38 ± 0.04 K for 12CO; and A° = 1.02 ± 0.02, A = (−0.6 ± 2.0) × 10−34, and τ = −0.37 ± 0.02 K for 13CO. Both curves have an associated R2 > 0.97. |
| In the text | |
|
Fig. 5 Arrhenius plots produced from TPD experiments on both 12CO (left column) and 13CO (right column). The intercept was fixed to ln(ν°) from Muñoz Caro et al. (2010) (top left) and Acharyya et al. (2007) (top right) or taken as a free parameter (bottom row) to determine Eb from the slope. |
| In the text | |
|
Fig. 6 FTIR absorption spectra collected during TID experiments on 12CO (A) and 13CO (B). The spectra shown are vertically shifted in increments of 0.050 absorbance units (from the highest to the lowest temperature) to show the evolution of the IR absorbance during TID experiments. For example, in (A), at 20 K, the peak absorbance is shown to be 1.030, but, accounting for the 0.600 absorbance unit shift, the peak absorbance is 0.430. |
| In the text | |
|
Fig. 7 FTIR absorption spectra collected during TPD experiments on 12CO (A) and 13CO (B). The spectra shown are vertically shifted in increments of 0.050 absorbance units (from the highest temperature to the lowest temperature) to show the evolution of the IR signal throughout TPD experiments. For example, in (A), at 20 K, the peak absorbance is shown to be 1.099, but, accounting for the 0.750 absorbance unit shift, the peak absorbance is 0.349. |
| In the text | |
|
Fig. A.1 IR spectra of 12CO and 13CO ices in the absorption regions of CO and H2O, showing that our TPD and TID experiments were not influenced by accumulation of water ice, which has an absorption feature from 3400 cm−1 to 3100 cm−1. Spectra for 12CO and 13CO are shown for TID (A and B, respectively) and TPD (C and D, respectively) experiments. TID spectra were vertically shifted in increments of 0.150 absorbance units (from highest temperature to lowest temperature), and for TPD by 0.200 absorbance units, in order to enable similar comparisons between spectra. For example, in (A), at 20 K, the peak absorbance is shown to be 0.871, but, accounting for the 0.450 absorbance unit shift, the peak absorbance is 0.421. |
| In the text | |
Current usage metrics show cumulative count of Article Views (full-text article views including HTML views, PDF and ePub downloads, according to the available data) and Abstracts Views on Vision4Press platform.
Data correspond to usage on the plateform after 2015. The current usage metrics is available 48-96 hours after online publication and is updated daily on week days.
Initial download of the metrics may take a while.