Fig. 7
Download original image
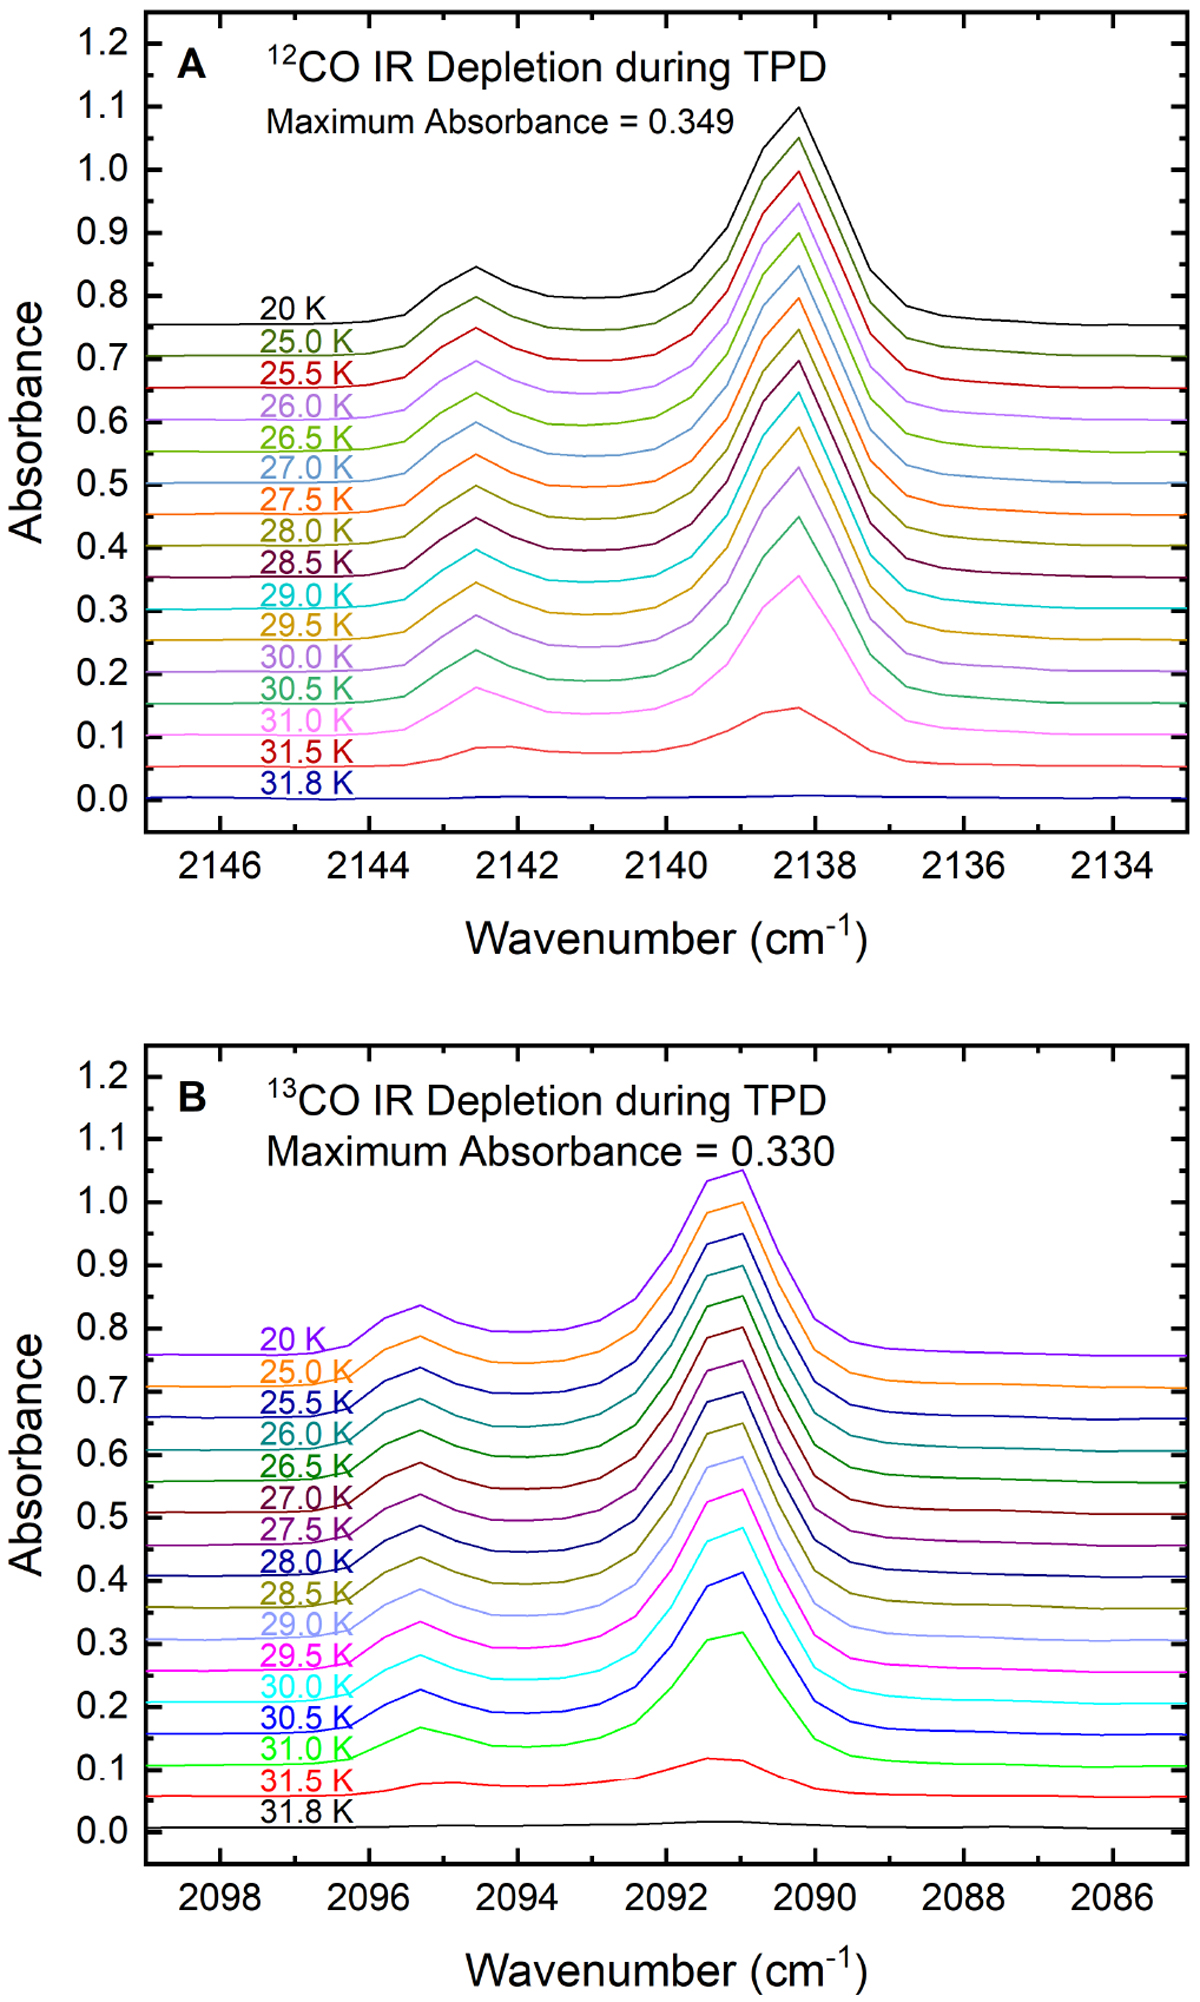
FTIR absorption spectra collected during TPD experiments on 12CO (A) and 13CO (B). The spectra shown are vertically shifted in increments of 0.050 absorbance units (from the highest temperature to the lowest temperature) to show the evolution of the IR signal throughout TPD experiments. For example, in (A), at 20 K, the peak absorbance is shown to be 1.099, but, accounting for the 0.750 absorbance unit shift, the peak absorbance is 0.349.
Current usage metrics show cumulative count of Article Views (full-text article views including HTML views, PDF and ePub downloads, according to the available data) and Abstracts Views on Vision4Press platform.
Data correspond to usage on the plateform after 2015. The current usage metrics is available 48-96 hours after online publication and is updated daily on week days.
Initial download of the metrics may take a while.