| Issue |
A&A
Volume 619, November 2018
|
|
|---|---|---|
| Article Number | A111 | |
| Number of page(s) | 10 | |
| Section | Astrophysical processes | |
| DOI | https://doi.org/10.1051/0004-6361/201832774 | |
| Published online | 14 November 2018 | |
Segregation effect and N2 binding energy reduction in CO-N2 systems adsorbed on water ice substrates
1
Université de Cergy-Pontoise, Sorbonne Université, Observatoire de Paris, PSL University, CNRS, LERMA, 95000 Cergy-Pontoise, France
2
Observatoire de Paris, Sorbonne Université, PSL University, CNRS, LERMA, 75014 Paris, France
Received:
5
February
2018
Accepted:
29
July
2018
Abstract
Context. CO and N2 are two abundant species in molecular clouds. CO molecules are heavily depleted from the gas phase towards the centre of pre-stellar cores, whereas N2 maintains a high gas phase abundance. For example, in the molecular cloud L183, CO is depleted by a factor of ≈400 in its centre with respect to the outer regions of the cloud, whereas N2 is only depleted by a factor of ≈20. The reason for this difference is not yet clear, since CO and N2 have identical masses, similar sticking properties, and a relatively close energy of adsorption.
Aims. We present a study of the CO-N2 system in sub-monolayer regimes, with the aim to measure, analyse and elucidate how the adsorption energy of the two species varies with coverage, with much attention to the case where CO is more abundant than N2.
Methods. Experiments were carried out using the ultra-high vacuum (UHV) set-up called VENUS. Sub-monolayers of either pure 13CO or pure 15N2 and 13CO:15N2 mixtures were deposited on compact amorphous solid water ice, and crystalline water ice. Temperature-programmed desorption experiments, monitored by mass spectrometry, are used to analyse the distributions of binding energies of 13CO and 15N2 when adsorbed together in different proportions.
Results. The distribution of binding energies of pure species varies from 990 K to 1630 K for 13CO, and from 890 K to 1430 K for 15N2. When a CO:N2 mixture is deposited, the 15N2 binding energy distribution is strongly affected by the presence of 13CO, whereas the adsorption energy of CO is unaltered.
Conclusions. Whatever types of water ice substrate we used, the N2 effective binding energy was significantly lowered by the presence of CO molecules. We discuss the possible impact of this finding in the context of pre-stellar cores.
Key words: astrochemistry / methods: laboratory: molecular / ISM: molecules
e-mail This email address is being protected from spambots. You need JavaScript enabled to view it. ; This email address is being protected from spambots. You need JavaScript enabled to view it.
© ESO 2018
 Open Access article, published by EDP Sciences, under the terms of the Creative Commons Attribution License (http://creativecommons.org/licenses/by/4.0), which permits unrestricted use, distribution, and reproduction in any medium, provided the original work is properly cited.
1. Introduction
CO and N2 are two of the most abundant species in molecular clouds and they affect the abundances of many other molecules. CO is the second most abundant molecule after H2 in the gas phase and is highly abundant in the solid phase. CO ice absorption features are seen superposed on the spectra of background sources or embedded protostars (e.g. Chiar et al. 1995; Pontoppidan et al. 2003). The solid CO abundance varies strongly from source to source, but can be as high as 10−4 with respect to H2 in the coldest cores (Pontoppidan et al. 2005).
The amount of N2 in the gas and in the solid state is uncertain, since N2 cannot be detected directly as it lacks a permanent dipole moment. The abundance of gas phase N2 is usually inferred from the presence of its daughter species N2H+ mainly formed via the reaction  . Similarly, HCO+ is formed from CO following a similar reaction scheme
  . But CO is also one of the main destroyers of N2H+ in the gas phase via the reaction CO + N2H+ → N2 + HCO+. When CO freezes out on to dust grains, N2H+ abundance is enhanced, as confirmed by the anti-correlation of the abundances of N2H+ with CO and HCO+ in the pre- and proto-stellar regions (Bergin et al. 2001; Tafalla et al. 2002; Di Francesco et al. 2004; Pagani et al. 2005; Jorgensen 2004). This anti-correlation was sometimes quantitatively explained by assuming that a ratio of 0.65 exists between the binding energies of N2 and CO, allowing N2 to stay in the gas phase while CO can freeze out on to H2O-covered grains (Bergin & Langer 1997). However, for pure species in thin layers or mixed species thick layers, such a high difference in binding energy between N2 and CO has never been reported (Öberg et al. 2005; Bisschop et al. 2006; Fayolle et al. 2016).
Freeze-outs of CO and N2 are difficult to quantify in dark clouds. N2 is not directly detectable as explained above, and emission of the depleted CO in the central parts of the clouds is so weak that it is completely masked by the strong, unattenuated emission of the envelope. Since  reacts with both species, the products of the reactions (DCO+, N2H+, and N2D+) can be used to trace their abundance as shown in Pagani et al. (2012). By using this method, Pagani et al. (2012) reported a steeper depletion profile of CO with respect to N2 towards the centre of the L183 pre-stellar core. The origin of this selective depletion remains unknown.
There are many possible explanations, although none of them is fully convincing. It can be due to the imperfection of the gas phase chemical network, which was recently improved (Le Gal et al. 2014). If the microphysics at the surface of grains plays a role, we can basically think of two possibilities. The first possible explanation is of chemical origin, namely can be a differentiation in the chemical properties once CO and N2 are both present on the surface of grains. It is known that CO can be hydrogenated into methanol (Hiraoka et al. 1994; Watanabe & Kouchi 2002; Minissale et al. 2016), whereas N2 does not react with H atoms (Ioppolo et al. 2015; Fedoseev et al. 2015). Moreover, N-atom diffusion is faster than that of O atoms (Minissale et al. 2015), and N2 is also very stable when compared to O2 or CO. However, there are not quantitative studies about the {N+H} or {N2+H} reactive networks to be able to make a clear prediction about the impact of the surface chemistry. The second possible explanation is of physical origin, since there exist reasons to think that some physical processes can play an important role, and especially a surface segregation effect of certain species. Previously, we found that H2 isotopologues as well as molecular hydrogen of different spin states desorb at different temperatures (Dulieu et al. 2005; Amiaud et al. 2008, 2015), which can lead to appreciable changes in the abundance of H2 isotopologues adsorbed on dust grains (Kristensen et al. 2011). Later, we have demonstrated that this segregation mechanism can also apply to molecules whose binding energy distributions are close, like O2 and CO (Noble et al. 2015). We have shown that a small average difference of 85 K between the centres of two binding energy distributions can fully explain the observed kick–out mechanism of O2 by CO during the desorption phase. We used the Fermi-Dirac statistics in order to calculate the adsorption site population distribution, and we managed to reproduce all the features of the CO and O2 desorption traces.
In the present article, we propose a study of the desorption of N2 and CO mixtures from different water ice substrates in the sub-monolayer regime. As for multi-layer regimes see Bisschop et al. (2006). Since the desorption mechanism takes place in the very outer layer, our study focuses on thin layers to mimic the action of the underlying icy template as in Fayolle et al. (2016). Here, we study CO:N2 mixtures relevant to polar ices (water-dominated) covering dust grains, with CO being always the most abundant species (Taquet et al. 2012; Pagani et al. 2012). We use 13CO molecules and 15N2 molecules in order to be able to distinguish the two species by mass spectrometry. The water ice substrates used in this study are compact and porous amorphous solid water, and poly-crystalline water ice. Experimental studies have shown that interstellar porous ice analogues can be compacted quite efficiently by UV irradiation, cosmic ion bombardment, and H-atom recombination at their surface (Palumbo et al. 2010; Palumbo 2006; Raut et al. 2008; Accolla et al. 2011), which suggests that water ice in space is almost certainly amorphous and non-porous (compact). We have however carried out a series of experiments also on poly-crystalline ice as it provides a more ordered surface, and because studying water ice templates other than a compact amorphous substrate alone can be of interest for specific interstellar environments where ices may have undergone energetic processing, for example protostellar objects (Dartois et al. 2002).
This paper is organized as follows: Sect. 2 focuses on the experimental methods. In Sect. 3 we present the experimental results. In Sect. 4 we will derive the desorption energy distributions and apply a model that is able to reproduce the desorption behaviour of CO-N2 mixtures using a simple Fermi-Dirac statistical approach. Finally, we will address the astrophysical implications of these findings.
2. Experimental protocol
All experiments were performed using the UHV set-up named VENUS (VErs de NoUvelles Synthèses) based in the LERMA laboratory at the University of Cergy Pontoise. VENUS is a new apparatus that will be described in detail in a forthcoming paper so the set-up and the experimental techniques are only summarized here. The experiments take place under ultrahigh vacuum (UHV) conditions (base pressure 8 × 10⁻¹¹ mbar) in a stainless steel chamber. The sample holder is made of a circular copper mirror coated with gold, and mounted onto the cold head of a closed-cycle He cryostat. The sample temperature can be controlled in the 7–350 K range by using a regulated resistive heater clamped on the back of the sample holder.
The first step of each experimental run is the deposition of a water ice layer. To grow the water ice substrate we use the so-called background deposition as follows: water vapour is injected into the main chamber until a pressure of 1.2 × 10⁻⁸ mbar is reached, and is kept constant during the deposition process until the desired ice thickness is attained. The purity of the water vapour, meaning the absence of air contamination or H2 release from the walls of the chamber, is monitored via a quadrupole mass spectrometer (QMS). The water ice thickness deposited on the gold surface is monitored via a Fourier Transform InfraRed Spectrometer (FTIRS), used in a grazing-angle reflection absorption configuration. The calibration of the water ice thickness via FTIR and QMS was carried out in a separate set of experiments when the amount of water ice deposited was measured as a function of time using the H2O partial pressure in the chamber, since a given pressure corresponds to – within the accuracy of the pressure gauge – a precise flux of molecules impinging on the walls of the chamber. Subsequently, the comparison between the number of deposited water layers and the infrared/mass spectra allows definition of the one-monolayer standard expressed in IR-band area units or TPD peak area units, with an accuracy of ±0.2 monolayers. Typically, a substrate of 15 layers of compact amorphous solid water ice (c-ASW) is grown by keeping the surface temperature at 110 K during water deposition. Once the deposition phase is finished, we wait until the partial pressure of water vapour in the main chamber has reached its pre-dosing value (<10−10 mbar), and only then the sample temperature is cooled further or increased. To obtain a polycrystalline ice (PCI) substrate, the sample holder is held at 110 K during the deposition, then flash heated to 145 K, and simultaneously the water ice film phase transition, from amorphous to crystalline, is monitored via both QMS and FTIRS. When the phase transition is complete, we cool the surface to 10 K before commencing the experiments. During the crystallisation phase, we estimated a loss of about 3 out of 15 initial layers of water ice, although we determined – by analysis of the desorption profiles of CO and N2 – that the icy substrate remains thick enough that the adsorbed molecules interact with the crystalline template only. Finally, the porous amorphous solid water (p-ASW) ice substrate is formed by growing 5 monolayers of ice at a surface temperature of 40 K on top of the c-ASW substrate, then it is annealed to 55 K to stabilize the film morphology before the subsequent heating-cooling experiments between 10 and 55 K. Although the degree of porosity of the p-ASW substrate is less pronounced than that of an ice film grown at 10 K and not annealed, the p-ASW ice substrate we use maintains the same overall properties as far as the physisorption binding energies are concerned (Fillion et al. 2009).
Once the desired water ice substrate is formed, the surface temperature is cooled to 10 K. CO and N2, isotopically labelled (13CO and 15N2), can be dosed onto the surface via one triple-differentially-pumped molecular beam. The composition of the beam is monitored through a second QMS located in the second stage of the beam-line. The surface is held at 10 K during every CO/N2 deposition. In case of deposition with CO-N2 mixtures, the gas is previously prepared in a dedicated reservoir to be connected to the beam source. The injected flow of gas is set to 0.3 standard cubic centimetre per minute (sccm1), which gives a pressure of around 2 × 10⁻⁴ mbar in the first stage of the beamline. After going through 3 stages of differential pumping and two diaphragms, the molecular beam is well collimated (2-mm diameter) and reaches the main chamber causing here an increase in pressure less than 1 × 10⁻¹¹ mbar.
The temperature-programmed desorption (TPD) technique is a powerful method for determining the binding energies of the molecules adsorbed on surfaces. It consists in increasing the surface temperature linearly with time and simultaneously recording the desorbing molecules using mass spectrometry. VENUS is equipped with a QMS placed 5 mm in front of the sample. The heating ramp is constant, β = 0.2 K s−1, for all experiments, and starts from a temperature of 10 K, which is the CO/N2 deposition temperature. TPD analysis is used to derive multi-layer desorption energies of species deposited as thick films, and it also allows us to derive the distribution of adsorption energies on a given surface in the case of sub-monolayer regimes. The adsorption energy is in fact dependent on the amount of molecules deposited, that is the coverage. Therefore, we have to keep in mind that there are three important experimental parameters to take into account: the type of species, the type of surface, and the coverage (Kimmel et al. 2001; Fillion et al. 2009; Noble et al. 2012).
The coverage is given in monolayer (ML) units, with the typical approximation that 1 ML = 1 × 10¹⁵ molecules cm−2, which corresponds to the number of adsorption sites per cm2 on compact amorphous solid water. It is a unit of surface density: when the coverage equals 1 ML, it means that all the adsorption sites of the ice surface are occupied in the case of a fully wetting molecule, such as CO or N2. Should another molecule come to the surface it will adsorb onto an already adsorbed molecule so as to begin a second-monolayer layer. With respect to first-layer particles, molecules that belong to the second layer exhibit weaker interactions with the substrate, and their desorption properties are, in general, dominated by molecule-molecule interactions. The first-monolayer layer is complete and the surface coverage is equal to 1 ML only for substrates that have a planar geometry, namely c-ASW and PCI substrates. In the case of porous substrates, the number of binding sites per cm2 increases with water ice film thickness. In fact, porous water ice possesses a 3D structure and the number of adsorption sites is proportional to the geometrical area of the porous ice 3D network.
3. Experimental results
3.1. Pure species
Figure 1 shows three typical sets of TPD curves: 15N2 desorbing from c-ASW (top panel), 13CO desorbing from c-ASW (middle panel), and 13CO desorbing from p-ASW (bottom panel). Figure 2 shows TPD spectra of 13CO (top panel) and 15N2 (bottom panel) desorbing from PCI. Each curve corresponds to a given dose, that is the initial coverage at 10 K. For each species deposited on a specific water ice substrate, a family of TPDs exhibits the so-called “filling behaviour”, described by Kimmel et al. (2001). Each type of substrate shows a distribution of adsorption sites with various energy depths, which is why desorption from a full first-monolayer layer occurs over a wide window of temperature, from around 25 K to 55 K. When only a small fraction of a monolayer (e.g. <0.25 ML) is initially present, the desorption only occurs at temperatures in the high end of the TPD peaks, which corresponds to desorption of molecules from sites with the highest binding energies. As the dose is increased, because the best (high-depth) sites are already occupied, molecules are forced to occupy lower energy sites, so desorption occurs earlier and the TPD peak shifts towards lower temperatures. In fact, available sites are progressively filled beginning from high-depth sites towards low-energy ones. The TPD profiles have a leading edge appearing at lower temperature with increasing coverage as is apparent from Figs. 1 and 2, while TPD spectra of a given molecule-substrate system all share a common tail. When the deposited amount reaches 1 ML, a second-monolayer is begun by molecules that form physisorption bounds with molecules of the first-monolayer layer. The presence of molecule-molecule bindings produces a new low-temperature feature (a bump or a real peak) in the TPD profiles corresponding to coverages >1 ML. If the exposure is increased further, the low-temperature peak maximum shifts towards higher temperatures, although the leading edge of all the high-coverage exposures remains unchanged. This is the signature of the second-monolayer or multi-layer desorption, which follows a so-called zeroth order desorption. It should be noted that the multi-layer peaks of N2 and CO, desorbing from c-ASW or PCI, appear for the same dose, which indicates that the number of adsorption sites is the same for the two molecule-substrate systems. On the contrary, the multi-layer peak of CO appears after an exposure of 1.5 ML when the substrate is p-ASW ice, which means that the porous substrate exhibits 1.5 more adsorption sites with respect to c-ASW and PCI, due to its 3D structure.
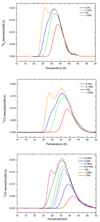 |
Fig. 1. TPD curves of different doses of 15N2 desorbing from c-ASW (top panel), of 13CO from c-ASW (middle panel) and from p-ASW (bottom panel). |
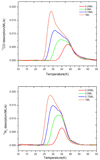 |
Fig. 2. TPD spectra of different doses of 13CO (top panel) and 15N2 (bottom panel) from poly-crystalline water ice (PCI). |
From the analysis of the TPD profiles it is possible to estimate the distribution of binding energies. The desorption rate can be described in terms of an Arrhenius law:
 (1)
(1)
where r is the desorbing flux in ML s−1, Eb is the binding energy in J, A is the pre-exponential factor in s−1, N is the total number of molecules adsorbed on the surface expressed in ML, n is the order of the desorption kinetics, kB = 1.38 × 10⁻²³ J K−1 is the Boltzmann constant, and T is the temperature of the surface in K. The order n corresponds to the number of reactants necessary to activate the desorption. It corresponds to a stoichiometric coefficient in the desorption equation. The zeroth order represents a desorption kinetics that is independent of the amount of available adsorbate. This is the case of thick films consisting of multi-layers, whose number of molecules at their surface remains constant during desorption, as one molecule that comes off the surface is replaced by another one lying just underneath. The first-order desorption corresponds to the desorption of an adsorbate whose coverage is lower or equal to one monolayer, which is the case of the present study. First-order kinetics implies that the desorption rate is proportional to the number of molecules present on the surface, provided that each molecule has no strong interaction with its neighbours, which means that no reaction is at play. Therefore, for CO and N2 physisorbed on water ice we assume that n = 1. The pre-exponential factor can be specifically determined, but it turns out to be coupled with the binding energy Eb. However, for the purposes of this work, and to obtain results that can be easily compared to previous publications, we adopt the generally accepted value A = 1013 s−1, corresponding to the typical vibrational frequency of CO and N2 physisorbed on the surface.
By inverting Eq. (1), the desorption energy Eb can be calculated as a function of coverage N. We use the inverted Polanyi-Wigner equation following Dohnálek et al. (2001), also called the classical inversion method, which is now commonly used in laboratory astrophysics (Noble et al. 2012; Collings et al. 2015; He et al. 2016). The first step consists in calculating the number of molecules that have desorbed at a given temperature T . To perform this step, the TPD spectrum is integrated between T0 (deposition temperature) and T, then divided by the area of the TPD peak  corresponding to 1 ML exposure:
 (2)
(2)
N′(T) is thus the fraction of molecules (expressed in ML units) that has already desorbed at temperature T. The coverage as a function of T can be expressed as the amount of deposited molecules, the initial coverage N0, minus the fraction of molecules desorbed at temperature T:
 (3)
(3)
Knowing N(T), it is now possible to invert Eq. (1):![Mathematical equation: $$ E_\mathrm b=k_\mathrm BT\times\ln{\left[\frac{A\;\mathrm N{(\mathrm T)}}{r{(T)}}\right]}. $$](/articles/aa/full_html/2018/11/aa32774-18/aa32774-18-eq8.gif) (4)
(4)
Eb is the desorption barrier and will be expressed in kelvins (J/kB) henceforth.
Figure 3 shows the distributions of binding energies for 13CO and 15N2 on c-ASW. At zero coverage the binding energy of CO is close to 1600 K and that of N2 is around 1400 K. Each curve corresponds to a given TPD shown in Fig. 1. The longer the curve the greater the deposited dose, until a maximum value reaching 1 ML (monolayer regime). As expected, the binding energy decreases with coverage, and the curves have a typical half bell shape. Just before monolayer completion, the binding energy of CO molecules is around 1000 K, while it is around 900 K for N2. On the other end of the curves (corresponding to zero coverage), the highest values are 1600 K and 1400 K for CO and N2, respectively. Our results are in agreement with all the previous values given in the literature (see Fayolle et al. 2016 and references therein).
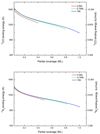 |
Fig. 3. Binding energy of pure 13CO (top) and pure 15N2 (bottom) on compact amorphous solid water ice, as a function of coverage, obtained using the classical inversion method, assuming n = 1 and A = 1013 s−1. |
Figure 4 shows the distributions of binding energies of pure 13CO and pure 15N2 on PCI, while in Fig. 5 we reported the distribution of binding energies of pure 13CO on p-ASW.
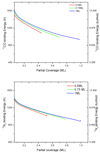 |
Fig. 4. Binding energy of pure13CO (top) and pure 15N2 (bottom) on poly-crystalline water ice, as a function of coverage (n = 1, A = 1013 s−1). |
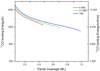 |
Fig. 5. Binding energy of pure 13CO on porous amorphous water ice, as a function of coverage (n = 1, A = 1013 s−1). |
All the binding energy data for pure species are reported in Table 1. The most useful information is the case of 1 ML dose because its two extrema correspond to (i) the bare surface case (highest values of the desorption energy), (ii) the full coverage case (lowest values). We note that the maximum of the binding energy has a slight tendency to increase with the dose, which may indicate that at higher coverages a larger fraction of deepest sites is occupied so the desorption process is slowed down. In fact, the more molecules on the surface, the more molecules are pushed to diffuse and occupy all the available sites. Also, at full coverage on c-ASW ice, the binding energy of the least bound molecules is close to the multi-layer barrier value.
Pure species: energy ranges of CO and N2 binding energy distributions measured as a function of coverage on different water ice substrates.
On the other hand, an exposure of 1 ML on porous ASW ice does not correspond to complete occupation of the available sites, because porous ASW has a larger effective area as we explained above. An exposure of about 1.5 ML is necessary before build-up of the second layer on porous water ice (see Fig. 1, bottom panel). We can also notice that the maximum binding energy found on p-ASW is close to the maximum value obtained for c-ASW (1600 K, corresponding to molecules desorbing up to 55 K). This result seems to be not consistent with experiments carried out using H2 (Fillion et al. 2009), or with the elegant demonstration by Kimmel et al. (2001) who used N2. In fact, TPD tails from p-ASW tend to extend to higher temperatures with respect to more ordered substrates, which indicates the presence of deeper adsorption sites associated to larger topological disorder. In this work this does not seem to be the case. The reason for this is that the deposition temperature of water molecules (40 K) and the subsequent thermal annealing until 55 K smoothen the deepest adsorption sites, located on less stable configurations of water clusters showing a reduced number water molecules coordinations. Moreover, the ice thickness that was used in this study is so low that there cannot be a geometrical pore effect (Dohnálek et al. 2003). Yet, if the two binding energy upper values are similar for p- and c-ASW, the shape and a greater number of binding sites on porous water ice results in a global shift towards the high-energy (-temperature) half of the TPD peak.
3.2. Mixed species
We have performed different TPD experiments of mixed species varying the total doses as well as the relative ratios. Figure 6 shows the change in TPD shape obtained by increasing the CO dose (from 0.45 to 1.27 ML) and keeping relatively constant and small the N2 dose (from 0.065 to 0.11 ML). The gas mixture is prepared in a reservoir before injection into the beam source. We cannot control precisely the partial pressure of each species, which implies that we have fluctuations of the N2 dose. For this reason, we do not have a very good control a priori of the individual amounts deposited, although we can finely control the total deposited amount of the mixed species. Finally, we can precisely measure the mixture composition a posteriori, by integrating the TPD curves. Figure 6 shows that the CO desorption profiles seem to be unaffected by the presence of the other co-adsorbate. The CO TPD set exhibits all the features of the filling behaviour. With the increase in dose, the leading edges are shifted towards low temperatures whereas the tails follow a common path. The multi-layer peak appears when the coverage exceeds one monolayer. On the contrary, the N2 desorption profiles are hugely modified by the presence of CO. In particular, the mean temperature of desorption of N2 decreases with CO coverage. The N2 TPD tails do not overlap and, more importantly, N2 desorption is almost completed within the same temperature range where the leading edge of CO curves develops. This is possibly a sign that N2 tends to desorb before CO if the two species are present on water ice simultaneously.
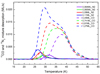 |
Fig. 6. TPD profiles of various mixtures of CO and N2 deposited on poly-crystalline water ice (PCI) substrate. CO and N2 are plotted with dashed and solid lines, respectively. Each colour corresponds to one experiment. CO is always the most abundant species with and its coverage varying between 0.45 ML and 1.2 ML, whereas N2 coverage remains around 0.1 ML. |
For at least three combinations of sub-monolayer coverage and surface, a series of depositions were made, varying the 13CO-15N2 system coverage from 0.5 to 1 ML. The ranges of binding energies found for N2 and CO are presented in Table 2.
CO:N2 mixtures: energy ranges for N2 and CO obtained as a function coverage and [CO]/[N2] ratio on c-ASW and PCI.
4. Analysis and discussion
We have previously shown that mixed species or isotopologues physisorbed in sub-monolayer regimes compete for occupying the adsorption sites. Because each site can harbor only one molecule, the repartition of each species among sites of various depth can be calculated using the Fermi-Dirac statistics (Dulieu et al. 2005; Amiaud et al. 2006, 2015; Kristensen et al. 2011). Here, for both CO and N2, the binding sites are described by a binding energy distribution, approximated as a Gaussian function. We assume that the molecules are spread over the binding sites following the Fermi-Dirac statistical equilibrium. For one species, we have
![Mathematical equation: $$ p{(E,T,\mu)}=g{(E)}\times{\left[1+\exp{(-\frac{E-\mu}{k_\mathrm bT})}\right]}^{-1}, $$](/articles/aa/full_html/2018/11/aa32774-18/aa32774-18-eq9.gif) (5)
(5)
where p(E, T, μ) is the population distribution given in the Fermi-Dirac formalism, the function g(E) represents the number of sites between the binding energy E and E + dE, and μ is the Fermi energy or chemical potential, which in turn is linked to the total number of molecules, N, given by
 (6)
(6)
The rate of desorption, obtained by integrating the desorption probability over the full binding energy distribution and weighted by the probability of occupying the given sites, is
 (7)
(7)
The Fermi-Dirac statistical method describes the distribution of one adsorbate over the binding site distribution for experiments of pure molecules. Nevertheless, it is not hard to implement in the case of a mixtures of species. Eq. (5) can be rewritten for CO, assuming that the number of sites available, g(E), is reduced by the presence of the other adsorbate pN2(E):
 (8)
(8)
There is a similar equation for N2 and there are two relationships required to calculate the two chemical potentials μCO and μN2. The coupled desorption of both adsorbates is calculated for each species, using Eq. (7), at each step of the simulation.
The probability that an adsorption site is vacant decreases with binding energy, namely, the deepest sites are more likely to be populated. Moreover, if two species have different adsorption energies, molecules with higher absorption barriers have a higher probability of occupying a binding site. Taking into account this simple statistics, we have shown that it is fair to assume that there can be binding energy distributions having identical shapes for two (or more) different species, provided that the centres of each energy distribution are spaced by a constant value. Even for molecules such as O2 and CO, which exhibit larger differences of desorption profiles with respect to CO and N2 used in this study, we were able to successfully fit the experimental TPD curves (Noble et al. 2015).
Here we have tested our Fermi-Dirac model for the simpler case of N2 and CO mixtures. It is a simpler case because pure N2 desorption peaks seem to be only slightly shifted towards lower temperatures when compared with pure CO profiles. Figure 3 shows that CO and N2 distributions of binding energies are separated only by a value of ≈200 K, at least for a coverage in the range 0−0.5 ML. In the case of CO and O2 it was not so obvious, because the multi-layer peak of O2 appears at higher temperatures than the multi-layer peak of CO, which indicates that the multi-layer energy of O2 is higher than that of CO. Therefore, the assumptions made above were certainly not warranted for a coverage close to 1 ML. In the present study concerning N2 and CO mixtures deposites on c-ASW and PCI, we can see that the experimental profiles shown in the top panel of Fig. 7 (c-ASW substrate, [CO]/[N2] ratio between 1.9 and 2.3) are well fitted. The CO profiles are well reproduced. Looking at the TPD tails, it should be noted that the difference between simulations and experiments is of the same order of uncertainty that exists from one experimental curve to another, as can be easily seen in Fig. 1. In Fig. 7 (bottom panel), we show the fitted TPD profiles of CO and N2 mixtures from PCI ([CO]/[N2] ratio between 7 and 11.4). The good quality of the fits in Fig. 7 is the verification of our hypothesis that the competition for adsorption sites is the main physical source of the differentiated desorption of CO and N2. Hence, by adding a constant energy shift of 100 K between the energy distributions of CO and N2, it is possible for us to simulate the desorption behaviour of the CO-N2 system in a sub-monolayer regime, independently of their relative abundance and of the type of water ice substrate. As far as N2 traces are concerned, we could have increased the quality of the fit if we had fitted the N2 energy distribution separately, but we believe that it is not necessary. Our main goal is to develop a model based on simple assumptions, that will be easily applicable to grains in astrophysical conditions, where the exact composition of the surfaces is not well known and so neither are the exact binding energy distributions.
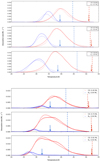 |
Fig. 7. Experimental (dotted) and simulated (solid) desorption traces of CO:N2 mixtures from c-ASW (top panel) and from PCI (bottom panel). Blue and red arrows indicate the position of the highest temperature at which the most tightly bound molecules desorb, calculated from the energy values reported in Table 2. Vertical dashed lines represent the highest temperature desorption in pure ices experiments, calculated from the energy values reported in Table 1. |
From our experiments and analysis, it is evident that the small difference in binding energies of N2 and CO has a dramatic effect on the desorption temperature of N2 whenever the two species are both present on the surface. This is apparent from Fig. 7 by looking at the locations of the arrows and of the vertical dashed lines. The position of the arrows (corresponding to highest temperature desorption in CO:N2 experiments) and the position of the vertical dashed lines (highest temperature desorption in pure ices desorption) were calculated using Eq. (12) of Luna et al. (2017), which allows us to express the high-energy desorption values displayed in Tables 1 and 2 as temperatures in kelvins. It is evident that blue arrows (N2 in CO-N2 system) exhibit a considerable shift towards lower temperatures with respect to the blue dashed lines (pure N2 experiments). Conversely, red arrows (CO in CO-N2 system) show no or very little shift with respect to the pure ice case, which confirms that CO molecules always tend to populate the most energetically favourable adsorption sites in CO:N2-mixture ratios ≥ 2.
The shift in temperature between red arrows and red dashed lines can be used to estimate the errors on each energy value and is around ±30 K in all cases. The Fermi-Dirac analysis of the desorption of mixed species is a powerful tool to simulate TPD spectra, as well as other fine effects measurable in the laboratory, such as the difference in binding energy of the ortho- and parastate of D2 molecules (Amiaud et al. 2008). However, it is not used in astrophysical models because it is highly demanding in terms of computing time. Therefore, it would be good to know if we can describe the competition mechanism between different molecules in a simpler way and, in particular, by adopting the commonly used approach based on the classical Arrhenius-type model.
Figure 8 displays the distribution of binding energies on c-ASW (top panel) and on PCI (bottom panel) obtained from the classical inversion method. On compact amorphous water ice, the case of pure CO (dotted blue curve) and pure N2 (dashed red curve) monolayer exposures are the same as those shown in Fig. 3. We can clearly see that these curves are nearly parallel, except for the very high coverage region (>0.8 ML) where they tend to converge. The other three solid lines presented in Fig. 8 concern a TPD experiment where a 1 ML-dose CO:N2 mixture (0.65 ML of CO + 0.35 ML of N2) was deposited on compact water ice. As expected, the CO trace (solid blue line) is unchanged with respect to the pure case (dashed blue curve), it goes from 0 ML coverage to 0.65 ML (point C, corresponding to the onset of desorption). On the contrary, the N2 binding energy profile (solid red curve) is strongly shifted towards lower energies by about 200 K. Actually, the desorption of the deposited mixture begins with the desorption of N2 (point A), which continues and terminates at point B. Only then, CO desorption starts (point C), and finishes when zero coverage is reached (point D), as expected. The most striking feature of the energy profiles described above is that points B and C have exactly the same value of binding energy (≈1200 K). It is like the desorption process is continuously evolving from point A to point D, except that CO desorption takes over only when there is no more N2 on the surface. To demonstrate this extreme simplification, in Fig. 8 we also plotted the sum of CO and N2 energy traces, considering them as a single desorbing population. The sum of the two is shown in black, and we can see that it is very similar to the energy distribution of the pure CO case. The same competition effect is even more prominent on the PCI substrate, which confirms that CO occupies the highest energy binding sites, pushing N2 to less favourable surface adsorption sites. This case is represented in Fig. 8 (bottom panel), where we show the energy distribution of a CO:N2 = 10:1 mixture (0.91 ML of CO + 0.09 ML of N2). The onset of the desorption corresponds to the desorption of N2 (point A) and the desorption process is complete at point D (end of the desorption of CO), corresponding to zero coverage.
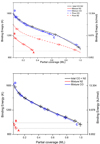 |
Fig. 8. Binding energy distributions of pure CO and N2 (dashed lines) and of a 0.65 ML-CO–0.35 ML-N2 mixture (solid lines) on c-ASW (top panel) and of a 0.91 ML-CO–0.09 ML-N2 mixture on PCI (bottom panel), obtained using the classical inversion method. The black solid line is the sum of CO (solid blue line) and N2 (red solid line) energy distributions calculated during the CO:N2 mixture experiment. |
It should also be noted that when the surface coverage is nearly full and a second layer is beginning to be built, the binding energy distribution of the CO-N2 system tends the N2-multi-layer binding energy, though it never reaches this lower limit value, indicating that the CO-N2 interaction is slightly stronger than the N2-N2 interaction.
From this analysis, a very simple and straightforward conclusion that we can draw is that the effective binding energy of N2, in presence of CO molecules, depends on the total coverage (CO+N2), and not on the partial coverage of N2 alone. On the contrary, the binding energy of CO is due only to the coverage of CO molecules, and is unaffected by the presence of N2.
As opposed to what experiments have shown before (Fuchs et al. 2006; Fayolle et al. 2016), there could actually be a relatively high difference between the effective binding energy of CO and N2 on cold interstellar dust grains. One simple model that could explain this hypothesis is that the effective binding energy of N2 is reduced from 1400 K (pure N2, at very low coverage) to 900 K (CO + N2 mixture, at monolayer coverage almost complete), corresponding to a reduction by a factor of ≈1−900/1400 ⋍ 0.35. This is consistent with the scenario proposed from the analysis of binding energies vs. coverage of Fig. 8. However, this is also a rather simplistic approach, because as the CO:N2 mixture is deposited and the surface gets filled the CO binding energy decreases too.
A more consistent view is to consider that N2 is always desorbing prior to CO whenever N2 and CO are both present on the surface of icy grains. Of course, the two different behaviours will be apparent only if the temperature is high enough that desorption or accretion is under way. Therefore, in the case of very cold dust (Tdust < 13 K), thermal desorption will be too weak and both N2 and CO will keep accreting on dust grains. In pre-stellar cores, the inner part of the cloud meets this condition (Bergin & Tafalla 2007). However, even in these dark and cold media, dust grains can experience temperature fluctuations (e.g. Bron et al. 2014) induced by cosmic rays (or secondary UV photons). This concept has been largely used in models since the work of Hasegawa & Herbst (1993). In fact, Hasegawa & Herbst (1993) consider that the binding energy is a key parameter that determines the abundance of a certain species in the gas phase, via the Arrhenius-like desorption rate. Therefore, if we imagine a distribution of temperature jumps, also in case of small spikes (>35 K), N2 is likely to desorb, but not all CO, as confirmed by our experiments. We can even consider that, as to nano–sized grains, temperature variations can also be induced by release of chemical energy, see for example calculations by Navarro-Ruiz et al. (2014). Nonetheless, the presence of nano– sized grains in pre-stellar core is unlikely because of the coagulation that leads to the coreshine (Pagani et al. 2010), grain sized distribution under coagulation processes (Ormel et al. 2009), and because the observational signature of very small grains at 60 μm (Laureijs et al. 1991; Stepnik et al. 2003) vanishes on the edge of the cloud.
It is also striking to note that the values of desorption energy used in previous models, as in Caselli (2002), are 1210 K and 787 K, for CO and N2 respectively, are quite consistent with the range of energy values that can be extrapolated from the present work. The former energy barrier coincides with CO binding energy on compact water ice at a relatively low coverage of 0.2 ML, or may also coincide with CO binding energy on porous ice at moderate coverage. The N2 energy barrier can be considered a typical value of binding energy of pure molecular nitrogen multilayers.
The complex modelling of pre-stellar cores, that should include dynamics of clouds as well as an accurate rate of accretion on grains and chemical reactions, is beyond the scope of this paper. In fact, none of the pre-stellar core models currently in use apply Fermi-Dirac statistics or a binding site distribution when simulating the solid-gas exchange. Although we cannot determine a single effective value for the binding energy of N2 and CO on grains, we can however provide a distribution of all ranges of binding energy of the CO-N2 systems investigated, that can be used to simulate the surface segregation/competition of the adsorbates in specific, astrophysically relevant situations. The values are reported in Table 2.
Our results imply that CO and N2 mixtures deposited on water-dominated icy mantles present different ranges of thermal desorption temperatures in different interstellar and circumstellar environments. In particular, in pre-stellar cores different CO and N2 binding energies may explain the later freeze-out, or early sublimation, of N2. On the other hand, in circumstellar disks, where radial temperature profiles greatly affect freeze-out of different volatiles, the segregation effect could explain why the observed N2H+ emission is such a robust tracer of the CO condensation front (Qi et al. 2013, 2015).
Previously, we already proposed an analytical expression to fit TPD profiles of pure CO in Noble et al. (2012), and other authors extended this subject to cover different conditions and regimes (He et al. 2016; Collings et al. 2004). The present case, where two species are present on the surface at the same time, makes very difficult to derive the absorption energy as a function of several variables. To know the effective binding energy, as long as both N2 and CO are on the surface, one has to know the relative coverage, which depends on the cloud conditions and history, then has to assume that CO will not desorb and that the lowest energy binding sites are occupied by N2. Assuming that CO and N2 sub-monolayer mixtures are adsorbed on a water ice template, only when N2 is completely gone, CO can start to leave the surface.
5. Conclusions
In this work, we studied sub-monolayer mixtures of N2 and CO deposited on two types of water ice substrates. N2 and CO coadsorbed on an amorphous surface show very different desorption behaviour when mixed than when adsorbed separately. We derived the distribution of binding energies and put in evidence that a segregation mechanism is at play. N2 and CO have close binding energies, with N2 adsorption barrier being slightly lower. If taken as pure species, the shape of their binding energy distribution as a function of coverage is similar. When mixed, CO molecules push-out N2 molecules of the highest energy adsorption sites, thus nitrogen is forced to almost completely leave the surface before CO begins to desorb. We conducted TPD experiments of CO:N2 mixtures from compact amorphous ice and poly-crystalline ice, and obtained similar results in the two cases. Experiments clearly show that the presence of CO reduces the effective binding energy of N2 in CO:N2-mixture ratios of ~2:1 and ~10:1, whereas we determined that the opposite effect does not occur within the same N2:CO-mixture ratios. In dark clouds, or in other environments where CO and N2 can meet on the surface of water-dominated icy mantles, a selective desorption may be the most probable scenario. It is yet to be confirmed that this is one of the main reasons explaining the lower depletion of N2 towards the centre of pre-stellar cores with respect to CO, although it is certainly a possibility that modellers have to take into consideration.
1 sccm = 592 m3 Pa s−1 in SI units.
Acknowledgments
The authors are grateful to the referee for comments and suggestions that greatly improved the manuscript. This work was supported by the Programme National “Physique et Chimie du Milieu Interstellaire” (PCMI) of CNRS/INSU with INC/INP co-funded by CEA and CNES and the DIM ACAV a funding programme of the Region Ile de France. T.N is granted by the LabEx MICHEM.
References
- Accolla, M., Congiu, E., Dulieu, F., et al. 2011, Phys. Chem. Chem. Phys., 13, 8037 [Google Scholar]
- Amiaud, L., Fillion, J., Baouche, S., et al. 2006, J. Chem. Phys., 124, 094702 [NASA ADS] [CrossRef] [Google Scholar]
- Amiaud, L., Momeni, A., Dulieu, F., et al. 2008, Phys. Rev. Lett., 100, 056101 [NASA ADS] [CrossRef] [PubMed] [Google Scholar]
- Amiaud, L., Fillion, J.-H., Dulieu, F., Momeni, A., & Lemaire, J.-L. 2015, Phys. Chem. Chem. Phys., 17, 30148 [NASA ADS] [CrossRef] [Google Scholar]
- Bergin, E. A., & Langer, W. D. 1997, ApJ, 486, 316 [NASA ADS] [CrossRef] [Google Scholar]
- Bergin, E. A., & Tafalla, M. 2007, ARA&A, 45, 339 [NASA ADS] [CrossRef] [Google Scholar]
- Bergin, E. A., Ciardi, D. R., Lada, C. J., Alves, J., & Lada, E. A. 2001, ApJ, 557, 209 [NASA ADS] [CrossRef] [Google Scholar]
- Bisschop, S. E., Fraser, H. J., Öberg, K. I., van Dishoeck, E. F., & Schlemmer, S. 2006, A&A, 449, 1297 [NASA ADS] [CrossRef] [EDP Sciences] [Google Scholar]
- Bron, E., Le Bourlot, J., & Le Petit, F. 2014, A&A, 569, A100 [NASA ADS] [CrossRef] [EDP Sciences] [Google Scholar]
- Caselli, P. 2002, Planet. Space Sci., 50, 1133 [NASA ADS] [CrossRef] [Google Scholar]
- Chiar, J. E., Adamson, A. J., Kerr, T. H., & Whittet, D. C. B. 1995, ApJ, 455, 234 [NASA ADS] [CrossRef] [Google Scholar]
- Collings, M. P., Anderson, M. A., Chen, R., et al. 2004, MNRAS, 354, 1133 [NASA ADS] [CrossRef] [Google Scholar]
- Collings, M. P., Frankland, V. L., Lasne, J., et al. 2015, MNRAS, 449, 1826 [NASA ADS] [CrossRef] [Google Scholar]
- Dartois, E., d’Hendecourt, L., Thi, W., Pontoppidan, K. M., & van Dishoeck, E. F. 2002, A&A, 394, 1057 [NASA ADS] [CrossRef] [EDP Sciences] [Google Scholar]
- Di Francesco, J., André, P., & Myers, P. C. 2004, ApJ, 617, 425 [NASA ADS] [CrossRef] [Google Scholar]
- Dohnálek, Z., Kimmel, G. A., Joyce, S. A., et al. 2001, J. Phys. Chem. B, 105, 3747 [CrossRef] [Google Scholar]
- Dohnálek, Z., Kimmel, G. A., Ayotte, P., Smith, R. S., & Kay, B. D. 2003, J. Chem. Phys., 118, 364 [NASA ADS] [CrossRef] [Google Scholar]
- Dulieu, F., Amiaud, L., Baouche, S., et al. 2005, Chem. Phys. Lett., 404, 187 [NASA ADS] [CrossRef] [Google Scholar]
- Fayolle, E. C., Balfe, J., Loomis, R., et al. 2016, ApJ, 816, L28 [NASA ADS] [CrossRef] [Google Scholar]
- Fedoseev, G., Ioppolo, S., & Linnartz, H. 2015, MNRAS, 446, 449 [NASA ADS] [CrossRef] [Google Scholar]
- Fillion, J.-H., Amiaud, L., Congiu, E., et al. 2009, Phys. Chem. Chem. Phys.: PCCP, 11, 4396 [NASA ADS] [CrossRef] [PubMed] [Google Scholar]
- Fuchs, G. W., Acharyya, K., Bisschop, S. E., et al. 2006, Farad. Discuss., 133, 331 [NASA ADS] [CrossRef] [PubMed] [Google Scholar]
- Hasegawa, T. I., & Herbst, E. 1993, MNRAS, 263, 589 [NASA ADS] [CrossRef] [Google Scholar]
- He, J., Acharyya, K., & Vidali, G. 2016, ApJ, 825, 89 [NASA ADS] [CrossRef] [Google Scholar]
- Hiraoka, K., Ohashi, N., Kihara, Y., et al. 1994, Chem. Phys. Lett., 229, 408 [NASA ADS] [CrossRef] [Google Scholar]
- Ioppolo, S., McGuire, B. A., de Vries, X., et al. 2015, IAU General Assembly, 22, 2257519 [NASA ADS] [Google Scholar]
- Jorgensen, J. K. 2004, A&A, 424, 589 [NASA ADS] [CrossRef] [EDP Sciences] [Google Scholar]
- Kimmel, G. A., Stevenson, K. P., Dohnálek, Z., Smith, R. S., & Kay, B. D. 2001, J. Chem. Phys., 114, 5284 [NASA ADS] [CrossRef] [Google Scholar]
- Kristensen, L. E., Amiaud, L., Fillion, J.-H., Dulieu, F., & Lemaire, J.-L. 2011, A&A, 527, A44 [NASA ADS] [CrossRef] [EDP Sciences] [Google Scholar]
- Laureijs, R. J., Clark, F. O., & Prusti, T. 1991, ApJ, 372, 185 [NASA ADS] [CrossRef] [Google Scholar]
- Le Gal, R., Hily-Blant, P., Faure, A., et al. 2014, A&A, 562, A83 [NASA ADS] [CrossRef] [EDP Sciences] [Google Scholar]
- Luna, R., Luna-Ferrándiz, R., Millán, C., et al. 2017, ApJ, 842, 51 [NASA ADS] [CrossRef] [Google Scholar]
- Minissale, M., Congiu, E., & Dulieu, F. 2015, A&A, 585, A146 [Google Scholar]
- Minissale, M., Moudens, A., Baouche, S., Chaabouni, H., & Dulieu, F. 2016, MNRAS, 458, 2953 [NASA ADS] [CrossRef] [Google Scholar]
- Navarro-Ruiz, J., Sodupe, M., Ugliengo, P., et al. 2014, Phys. Chem. Chem. Phys., 16, 17447 [CrossRef] [Google Scholar]
- Noble, J. A., Theule, P., Mispelaer, F., et al. 2012, A&A, 543, A5 [NASA ADS] [CrossRef] [EDP Sciences] [Google Scholar]
- Noble, J. A., Diana, S., & Dulieu, F. 2015, MNRAS, 454, 2636 [NASA ADS] [CrossRef] [Google Scholar]
- Öberg, K. I., van Broekhuizen, F., Fraser, H. J., et al. 2005, ApJ, 621, L33 [NASA ADS] [CrossRef] [Google Scholar]
- Ormel, C. W., Paszun, D., Dominik, C., & Tielens, A. G. G. M. 2009, A&A, 502, 845 [NASA ADS] [CrossRef] [EDP Sciences] [Google Scholar]
- Pagani, L., Pardo, J.-R., Apponi, A. J., Bacmann, A., & Cabrit, S. 2005, A&A, 429, 181 [NASA ADS] [CrossRef] [EDP Sciences] [Google Scholar]
- Pagani, L., Steinacker, J., Bacmann, A., Stutz, A., & Henning, T. 2010, Science, 329, 1622 [NASA ADS] [CrossRef] [PubMed] [Google Scholar]
- Pagani, L., Bourgoin, A., & Lique, F. 2012, A&A, 548, L4 [CrossRef] [EDP Sciences] [Google Scholar]
- Palumbo, M. E. 2006, A&A, 453, 903 [NASA ADS] [CrossRef] [EDP Sciences] [MathSciNet] [Google Scholar]
- Palumbo, M. E., Baratta, G. A., Leto, G., & Strazzulla, G. 2010, J. Mol. Struct., 972, 64 [NASA ADS] [CrossRef] [Google Scholar]
- Pontoppidan, K. M., Fraser, H. J., Dartois, E., et al. 2003, A&A, 408, 981 [NASA ADS] [CrossRef] [EDP Sciences] [Google Scholar]
- Pontoppidan, K. M., Dullemond, C. P., van Dishoeck, E. F., et al. 2005, ApJ, 622, 463 [NASA ADS] [CrossRef] [Google Scholar]
- Qi, C., Öberg, K. I., & Wilner, D. J. 2013, ApJ, 765, 34 [NASA ADS] [CrossRef] [Google Scholar]
- Qi, C., Öberg, K. I., Andrews, S. M., et al. 2015, ApJ, 813, 128 [NASA ADS] [CrossRef] [Google Scholar]
- Raut, U., Famá, M., Loeffler, M. J., & Baragiola, R. A. 2008, ApJ, 687, 1070 [NASA ADS] [CrossRef] [Google Scholar]
- Stepnik, B., Abergel, A., Bernard, J.-P., et al. 2003, A&A, 398, 551 [NASA ADS] [CrossRef] [EDP Sciences] [Google Scholar]
- Tafalla, M., Myers, P. C., Caselli, P., Walmsley, C. M., & Comito, C. 2002, ApJ, 569, 815 [NASA ADS] [CrossRef] [Google Scholar]
- Taquet, V., Ceccarelli, C., & Kahane, C. 2012, A&A, 538, A42 [NASA ADS] [CrossRef] [EDP Sciences] [Google Scholar]
- Watanabe, N., & Kouchi, A. 2002, ApJ, 571, L173 [NASA ADS] [CrossRef] [Google Scholar]
All Tables
Pure species: energy ranges of CO and N2 binding energy distributions measured as a function of coverage on different water ice substrates.
CO:N2 mixtures: energy ranges for N2 and CO obtained as a function coverage and [CO]/[N2] ratio on c-ASW and PCI.
All Figures
|
Fig. 1. TPD curves of different doses of 15N2 desorbing from c-ASW (top panel), of 13CO from c-ASW (middle panel) and from p-ASW (bottom panel). |
| In the text | |
|
Fig. 2. TPD spectra of different doses of 13CO (top panel) and 15N2 (bottom panel) from poly-crystalline water ice (PCI). |
| In the text | |
|
Fig. 3. Binding energy of pure 13CO (top) and pure 15N2 (bottom) on compact amorphous solid water ice, as a function of coverage, obtained using the classical inversion method, assuming n = 1 and A = 1013 s−1. |
| In the text | |
|
Fig. 4. Binding energy of pure13CO (top) and pure 15N2 (bottom) on poly-crystalline water ice, as a function of coverage (n = 1, A = 1013 s−1). |
| In the text | |
|
Fig. 5. Binding energy of pure 13CO on porous amorphous water ice, as a function of coverage (n = 1, A = 1013 s−1). |
| In the text | |
|
Fig. 6. TPD profiles of various mixtures of CO and N2 deposited on poly-crystalline water ice (PCI) substrate. CO and N2 are plotted with dashed and solid lines, respectively. Each colour corresponds to one experiment. CO is always the most abundant species with and its coverage varying between 0.45 ML and 1.2 ML, whereas N2 coverage remains around 0.1 ML. |
| In the text | |
|
Fig. 7. Experimental (dotted) and simulated (solid) desorption traces of CO:N2 mixtures from c-ASW (top panel) and from PCI (bottom panel). Blue and red arrows indicate the position of the highest temperature at which the most tightly bound molecules desorb, calculated from the energy values reported in Table 2. Vertical dashed lines represent the highest temperature desorption in pure ices experiments, calculated from the energy values reported in Table 1. |
| In the text | |
|
Fig. 8. Binding energy distributions of pure CO and N2 (dashed lines) and of a 0.65 ML-CO–0.35 ML-N2 mixture (solid lines) on c-ASW (top panel) and of a 0.91 ML-CO–0.09 ML-N2 mixture on PCI (bottom panel), obtained using the classical inversion method. The black solid line is the sum of CO (solid blue line) and N2 (red solid line) energy distributions calculated during the CO:N2 mixture experiment. |
| In the text | |
Current usage metrics show cumulative count of Article Views (full-text article views including HTML views, PDF and ePub downloads, according to the available data) and Abstracts Views on Vision4Press platform.
Data correspond to usage on the plateform after 2015. The current usage metrics is available 48-96 hours after online publication and is updated daily on week days.
Initial download of the metrics may take a while.