Fig. 8.
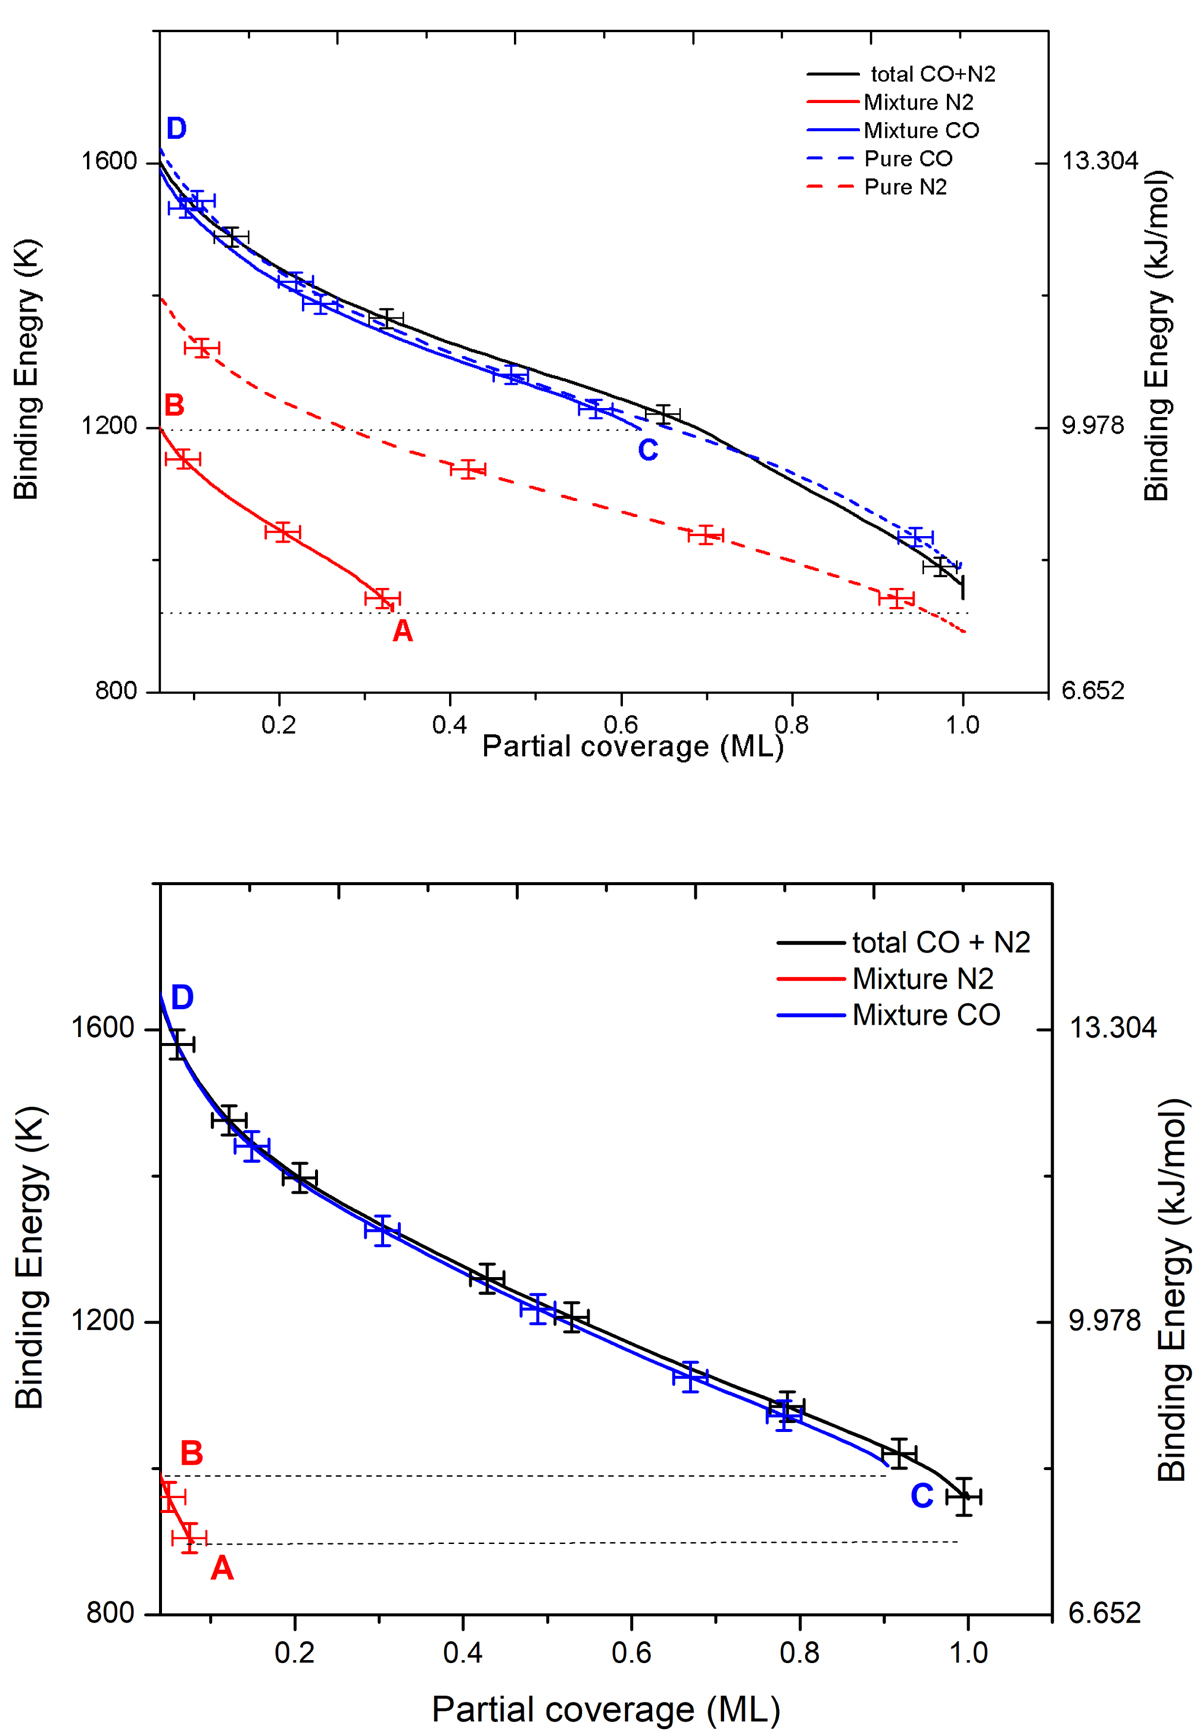
Binding energy distributions of pure CO and N2 (dashed lines) and of a 0.65 ML-CO–0.35 ML-N2 mixture (solid lines) on c-ASW (top panel) and of a 0.91 ML-CO–0.09 ML-N2 mixture on PCI (bottom panel), obtained using the classical inversion method. The black solid line is the sum of CO (solid blue line) and N2 (red solid line) energy distributions calculated during the CO:N2 mixture experiment.
Current usage metrics show cumulative count of Article Views (full-text article views including HTML views, PDF and ePub downloads, according to the available data) and Abstracts Views on Vision4Press platform.
Data correspond to usage on the plateform after 2015. The current usage metrics is available 48-96 hours after online publication and is updated daily on week days.
Initial download of the metrics may take a while.