Fig. 7.
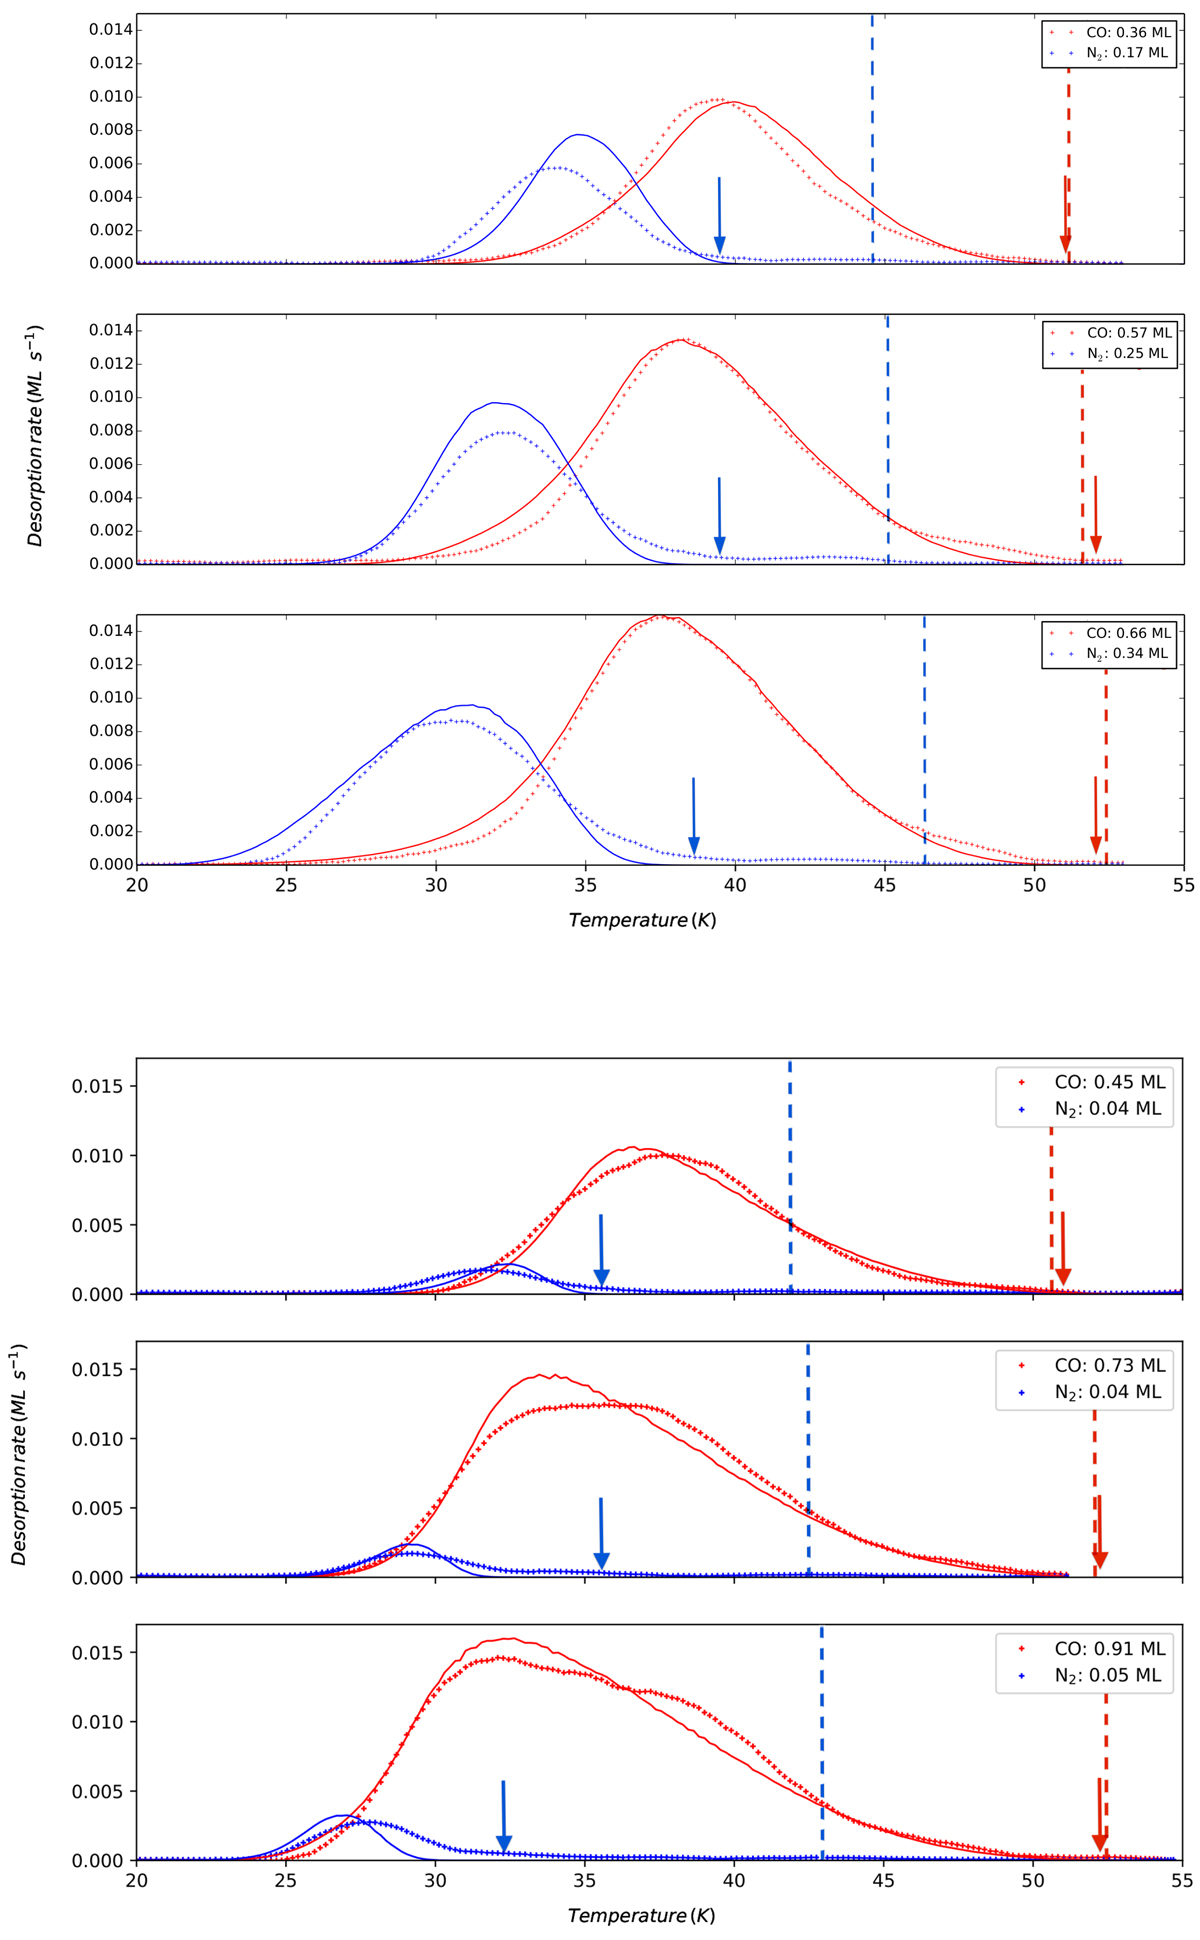
Experimental (dotted) and simulated (solid) desorption traces of CO:N2 mixtures from c-ASW (top panel) and from PCI (bottom panel). Blue and red arrows indicate the position of the highest temperature at which the most tightly bound molecules desorb, calculated from the energy values reported in Table 2. Vertical dashed lines represent the highest temperature desorption in pure ices experiments, calculated from the energy values reported in Table 1.
Current usage metrics show cumulative count of Article Views (full-text article views including HTML views, PDF and ePub downloads, according to the available data) and Abstracts Views on Vision4Press platform.
Data correspond to usage on the plateform after 2015. The current usage metrics is available 48-96 hours after online publication and is updated daily on week days.
Initial download of the metrics may take a while.