| Issue |
A&A
Volume 664, August 2022
|
|
|---|---|---|
| Article Number | A169 | |
| Number of page(s) | 9 | |
| Section | Atomic, molecular, and nuclear data | |
| DOI | https://doi.org/10.1051/0004-6361/202243489 | |
| Published online | 29 August 2022 | |
Desorption of organic molecules from interstellar ices, combining experiments and computer simulations: Acetaldehyde as a case study
1
Institute for Theoretical Chemistry, University of Stuttgart,
Stuttgart, Germany
e-mail: This email address is being protected from spambots. You need JavaScript enabled to view it.
2
Instituto de Estructura de la Materia, Consejo Superior de Investigaciones Científicas (IEM-CSIC),
Madrid, Spain
e-mail: This email address is being protected from spambots. You need JavaScript enabled to view it.
Received:
7
March
2022
Accepted:
20
June
2022
Abstract
Context. Explaining the presence of complex organic molecules (COMs) in interstellar environments requires a thorough understanding of the physics and chemistry occurring in the interplay between the gas phase and interstellar surfaces. Experiments and computer simulations are pivotal in building a comprehensive catalogue of processes of relevance for the build up of organic molecules in those environments.
Aims. We combine experiments with tailored computer simulations to study the desorption dynamics of acetaldehyde CH3CHO – an important organic precursor in cold interstellar environments - on amorphous solid water for the first time. Our goals with this paper are twofold. Firstly, we want to contextualise the role of this molecule in the evolution of organic molecules in space. Secondly, we want to suggest a joint scheme to produce quantitative information on desorption magnitudes based on the combination of computations and experiments. This scheme can be adopted to refine measurements of other molecules.
Methods. We determined desorption energies and pre-exponential factors of desorption theoretically using molecular dynamics simulations that combine semi-empirical and density functional calculations. We also performed temperature-programmed desorption experiments with acetaldehyde on top of non-porous amorphous solid water. The combination of theoretical and experimental results allows us to derive reliable quantities, which are required for understanding the desorption dynamics of interstellar COMs (iCOMs) atop interstellar ices.
Results. The average theoretical and experimental desorption energies found for CH3CHO desorbing from non-porous amorphous solid water (np-ASW) surfaces are 3624 K and 3774 K, respectively. The pre-exponential factor determined theoretically is vtheo = 2.4 × 10¹² s−1 while from the experiments it was possible to constrain this magnitude to 1012±1 s−1.
Conclusions. The comparison of the desorption energies of CH3CHO with other COMs, such as CH3NH2 or CH3NO, shows that CH3CHO is more volatile. Therefore, we suggest that, in consideration of the average binding energy, CH3CHO should undergo preferential desorption during the ice-sublimation phase in hot cores enriching the gas-phase in this particular component. In addition, the overall low binding energy suggests a possible early return to the gas phase of pre-stellar cores due to non-thermal effects (i.e. reactive desorption or cosmic-ray-induced desorption). This could explain the prevalence of CH3CHO in the gas phase of pre-stellar cores. Dedicated laboratory and theoretical efforts are required to confirm this last point.
Key words: molecular data / ISM: molecules / astrochemistry / methods: numerical / methods: laboratory: molecular
© G. Molpeceres et al. 2022
 Open Access article, published by EDP Sciences, under the terms of the Creative Commons Attribution License (https://creativecommons.org/licenses/by/4.0), which permits unrestricted use, distribution, and reproduction in any medium, provided the original work is properly cited.
This article is published in open access under the Subscribe-to-Open model.
Open Access funding provided by Max Planck Society.
1 Introduction
Interstellar complex organic molecules (iCOMs) have been detected in star-forming regions in the interstellar medium. In particular, acetaldehyde (CH3CHO), one of the most abundant iCOMs, was first identified in cold dust clouds by Matthews et al. (1985). Since then, this species has been detected towards hot cores and hot corinos (Bisschop et al. 2007; Cazaux et al. 2003; Imai et al. 2016), in outflows (Codella et al. 2015; Holdship et al. 2019), and in other cold pre-stellar cores (Öberg et al. 2010; Vastel et al. 2014; Jiménez-Serra et al. 2016; Soma et al. 2018; Scibelli et al. 2021). The formation mechanism of iCOMs is still under debate. Several viable routes of formation of this molecule on dust grains have been proposed, via radical-radical or radical-molecule reactions (Garrod & Herbst 2006), or UV processing of ices (Öberg 2016). In hot sources, iCOMs could have been formed on dust grains and then sublimated in the warmer regions near the protostar. In cold regions, they can be formed on interstellar grains followed by non-thermal desorption to return to the gas phase. However, it is also possible that they originate in the gas phase, being the products of ion-neutral or neutral-neutral reactions (Charnley 2004; Vasyunin & Herbst 2013; Vasyunin et al. 2017).
Understanding the formation mechanisms of iCOMs in the different regions is crucial for constructing chemical models and constraining the chemical conditions for star and planetary formation. To this aim, theoretical calculations and experiments can provide helpful information. For example, concerning acetaldehyde, two theoretical works were recently published that investigate the formation of CH3CHO on CO or water-ice surfaces (Lamberts et al. 2019; Enrique-Romero et al. 2021). These latter studies found a route for CH3HO formation on dust grains via recombination of CH3 and CHO radicals. From an experimental point of view, information has been provided about the sublimation energies of iCOMs from water ice or dust analogue surfaces. For example, Smith et al. (2014) investigated the desorption kinetics of methanol, ethanol, and water from graphene surfaces. Chaabouni et al. (2018) provided desorption energies of methylamine and formamide from amorphous solid water. In recent work, Corazzi et al. (2021) studied the sublimation of acetaldehyde and acetonitrile from olivine dust. Each of the different iCOMs presented different desorption profiles, which depend on the desorption substrates. It is therefore apparent that significant effort must be made in terms of laboratory measurements and computer simulations to disentangle the surface dynamics, and in particular the desorption of iCOMs.
Here, we present thermal programmed desorption (TPD) experiments with CH3CHO from non-porous amorphous solid water-ice surfaces, which we use to obtain the distribution of binding energies of this iCOM. The experiments performed at the Instituto de Estructura de la Materia, (IEM-CSIC) were simulated with tailored calculations. The calculations provide atomistic details about the nature of the binding of CH3CHO on interstellar ices and shed light on the unknowns in the experiments. In particular, we focused on obtaining the theoretical distribution of binding energies, sites, and the computation of pre-exponential frequencies of desorption to refine the desorption energies obtained from the experiments.
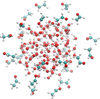 |
Fig. 1 Example of CH3CHO positioning around the water cluster. The figure shows the initial positions for 25 molecules, in contrast to the 50 employed by the ice model for ease in visualisation. |
2 Methodology
2.1 Theoretical methodology
To determine the different CH3CHO binding sites on water clusters, we employed a scheme similar to the one presented in Molpeceres & Kästner (2021). From a randomly generated water cluster with 100 water molecules, we performed molecular dynamics (MD) in the canonical ensemble (NVT; e.g. using a thermostat to control the temperature of the simulation), at 300 K for 50 ps. We extracted a molecular structure snapshot every 10 ps during this simulation, starting at 20 ps. Each of these snapshots was subsequently cooled down to 10 K for 10 ps. We used the GFNFF potential (Spicher & Grimme 2020) and ChemShell (Metz et al. 2014; Sherwood et al. 2003) as the MD driver for the water ice preparation simulations. The GFNFF potential is a recent generic force field, where the dynamics of the system is driven by parameterised interactions (e.g. classical harmonic oscillators, pair dispersion potentials) that allow a very fast initial exploration of the cluster configurations. The resulting cooled ices are further optimised using the GFN2-xTB method (Bannwarth et al. 2019, 2021). In contrast with the GFNFF method, the level of empiricism is reduced for the GFN2-xTB method, and we take advantage of its semi-empirical nature. The combinations of both GFNFF and GFN2-xTB has proven very successful in creating realistic ice models (Germain et al. 2022). In this way, we create four structural models to sample binding energies. Finally, we placed the 50 CH3CHO molecules around the optimised clusters, one at a time, with their centres of mass located at random points spanning a Fibonacci lattice (see Fig. 1). The initial orientation of the CH3CHO molecules is randomised. Recently, the GFN2-xTB method was successfully used to predict the binding energies of closed-shell molecules (Germain et al. 2021). The binding energy of CH3CHO is calculated from the following equation:
 (1)
(1)
where Ucluster+ads represents the internal energy (electronic + zero-point energy) of the adsorbate and the ice complex, and Ucluster and Uads the internal energies of the ice cluster and adsorbate, respectively. Zero-point energy contributions are incorporated at the GFN2-xTB level. In experiments, desorption energies are obtained, ∆Udes = –∆Ubin. The electronic energies were improved with density functional theory calculations (DFT) using various methods, namely BP86-D4 (Becke 1988; Caldeweyher et al. 2019), B3LYP-D4 (Becke 1993; Caldeweyher et al. 2019), and PW6B95-D4 (Zhao & Truhlar 2004; Caldeweyher et al. 2019), all accompanied with a def2-TZVP basis set (Weigend & Ahlrichs 2005). The DFT calculations search for a better description of the electronic energy of our systems. We chose methods involving different grades of approximation to ascertain whether or not particular families of functionals are better suited to our problems. This was not the case, with all the functionals yielding very similar energies. The D4 correction is applied to ensure a proper treatment of weak dispersion forces in non-covalent interactions. All the geometry optimisations were driven by the DL-Find library (Kästner et al. 2009) integrated into the ChemShell package (Sherwood et al. 2003; Metz et al. 2014). The DFT energies were obtained using Turbomole v7.4 (Ahlrichs et al. 1989; Furche et al. 2014).
Once the distribution of binding sites was attained, we determined attempt frequencies of desorption (v in s–1), which are included in the expression for the rate constant of desorption (kd in s–1):
 (2)
(2)
The procedure that we followed to determine the attempt frequencies includes the selection of deep binding configurations from the previously determined binding energy distribution. We selected three binding sites with high binding energies. For each of these configurations, we translated the system to make the CH3CHO centre of mass coincide with the origin of coordinates. We ran NVT molecular dynamics simulations at 100 K (matching the experimental desorption temperature from our experiments) for 10ps. From each molecular dynamics trajectory, we monitored the z coordinate of the centre of mass of CH3CHO, with local maxima in their evolution representing the attempt periods. Attempt frequencies were obtained as the inverse of the average attempt periods of our simulations.
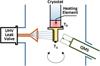 |
Fig. 2 Scheme of the geometry of the TPD experiments. |
2.2 Experimental setup
The experimental setup employed is described more extensively in Maté et al. (2019), and only details relevant to this study are mentioned here. It consists of an ultra-high vacuum (UHV) chamber with a base pressure of 8 × 10⁻¹⁰ mbar. An Al sample holder is located in the centre of the chamber in close thermal contact with the cold head of a closed-cycle He cryostat. The sample temperature is measured between 15 K and 200 K with two silicon diodes at the bottom and top of the sample holder (TA and TB respectively in Fig. 2). A Lakeshore temperature controller is employed to program temperature ramps at the desired velocity. The position of the two temperature sensors allows the observation of possible temperature gradients within different sites in the sample surface during TPD experiments. The chamber is provided with a line-of-sight quadrupole mass spectrometer (QMS) mounted at a 45-degree angle to the plane of the sample on a translation manipulator that allows the QMS end to reach a distance of 10 mm from the sample surface. The QMS is moved close to the sample to perform TPD and is moved away to allow rotation of the substrate to the direct vapour deposition position (see Fig. 2)
Acetaldehyde (Sigma-Aldrich, ≥99.5%), a liquid with a vapour pressure of 1 bar at 20 °C (NIST), was placed in a Pyrex flask and kept at room temperature after removing volatiles via a freeze-pump-thaw cycle. Both water and acetaldehyde vapours were introduced in the chamber via a 45 °C heated line, through a precision UHV leak valve connected to a microchannel plate directed perpendicular to the cold Al surface at a distance of 40 mm. The pressure in the pre-chamber is read with a capacitron gauge and was set to between 6 mbar and 10 mbar, while deposition times varied between 5 s and 60 s.
Grazing-angle reflection-absorption infrared (RAIRS) spectra of ices deposited on the Al sample holder were taken with an FTIR spectrometer coupled to the chamber through ZnSe windows. A liquid nitrogen cooled MCT detector was employed to record 2 cm–1 resolution spectra accumulating 300 scans.
To investigate the interaction of acetaldehyde with a non-porous amorphous solid water (np-ASW) surface, first np-ASW ice of ~20 monolayers (ML) was grown at 110 K. A non-porous ice surface is needed to better compare the experimental results with the calculations, because the simulations do not contemplate porosity. The chosen temperature is low enough to ensure the formation of amorphous water ice, but high enough for it to have very low porosity (see Dohnálek et al. 2003). Moreover, it is also known that ices grown by direct deposition, as in the present work, are more compact than those grown by background deposition. Although the UHV chamber provides a relatively clean environment, some unavoidable water ice grows during the cooling process because of the residual water pressure. The system takes 80min to reach 110K and 35min more to cool to 50 K. During these two time intervals, 1.7 ML and 0.38 ML of water ice are added to the water layer, respectively. After deposition, the temperature was kept at 110K for about 20 min to ensure that the background pressure in the chamber reaches the 10–10 mbar range, before cooling the sample to 50 K again. During this time at 110K, an extra approximately 0.44 ML of np-ASW ice grows. The np-ASW structure does not change during cooling from 110 K to 50 K. Subsequently, a controlled amount of acetaldehyde vapour was introduced into the chamber. Once the two-layer ice deposit was grown, the cryostat was rotated by 180° to place the sample facing the QMS (see Fig. 2). A linear heating ramp of 0.1 Ks–1 was programmed for all the TPD experiments presented in this work. The temperature readings in the two Si sensors differ by less than 2K during the heating.
The column density of water molecules deposited via direct vapour deposition (see Fig. 2) was estimated using the information provided by the RAIRS spectra. The optical constants given in Mastrapa et al. (2009) were taken to simulate RAIRS spectra of 110K ASW ice of different thickness. The available optical constants correspond to background deposited ice layers, while the experimental spectra are directionally deposited ASW layers. Therefore, slight differences are expected in the determination of the ASW thickness when comparing simulated and experimental RAIRS spectra. However, the ASW layer thickness is not relevant for the experiments performed in this work, as long as the whole Al surface is covered with water molecules.
To analyse the acetaldehyde TPD curves, it is necessary to establish the 1ML dose. The column density of acetaldehyde molecules deposited was calibrated using also the acetaldehyde RAIRS spectra, but as no optical constants are available for ices of this species, a different approach was taken. First, using a different inlet port located in a lower plane not shown in Fig. 2, the chamber was filled with a homogeneous pressure of acetaldehyde, and an acetaldehyde-ice layer was formed on top of the clean Al sample holder kept at 50 K. During deposition, the pressure in the UHV chamber was monitored with a calibrated Bayard-Alpert gauge. A pressure of 9 × 10⁻⁸ mbar was introduced in the chamber, and RAIRS spectra were recorded at 2 min time intervals. Assuming acetaldehyde has a sticking probability of one at 50 K, the column density of molecules deposited every two minutes can be estimated from the kinetic theory of gases. Subsequently, another set of experiments was performed recording RAIRS spectra of acetaldehyde ice layers grown via directional vapour deposition (as illustrated in Fig. 2). Comparing the spectra obtained in this way with the set of ‘known number density’ spectra obtained in our previous experiment, it is possible to estimate the column density of acetaldehyde molecules deposited by direct impinging. An example of the spectra recorded for this calibration is given in Fig. 3.
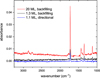 |
Fig. 3 RAIRS spectra of CH3CHO ice layers grown at 50 K on top of an Al substrate via backfilling or via directional vapour deposition, as explained in the main text. |
Average desorption energies (in K) of CH3CHO obtained from four (H2O)100 models.
3 Results
3.1 Theoretical results
From the protocol presented in Sect. 2.1, we extracted an average desorption energy for each of the four structural water ices. Our results are summarised in Table 1. To calculate the mean, and after analysis of the different binding sites, one single structure was discarded based on a repulsive arrangement predicted attractive by GFN2-xTB. The other binding sites are considered, including low binding and deep binding outliers averaged out by the ample statistics. Finally, a more visual representation of the desorption energy distribution is depicted in Fig. 4, with the electronic energies corrected using the B3LYP-D4 exchange and correlation functional.
We also ran molecular dynamics simulations as explained in Sect. 2.1 to evaluate the temporal evolution of CH3CHO in several deep binding sites (in the range ~5000–7000K). A representation of such a molecular dynamics trajectory is presented in Fig. 5. We observe that in the simulation time frame (10 ps) and at this temperature (100 K), acetaldehyde diffuses a couple of angstroms to accommodate the structural changes in the ice arising from a randomly drawn Maxwell-Boltzmann distribution at the beginning of the simulation. This is an artefact of the MD simulation coming from an instantaneous initialisation of the molecular velocities. However, the simulations are sufficiently resolved to obtain a distinct profile for the oscillation of the z coordinate of the centre of mass in the three trajectories that we sampled. We present the results in Fig. 6. We observe an apparent oscillation of the z coordinate that we employed to compute attempt frequencies from them. However, compared to some of our previous works, the oscillations are less clearly resolved (Molpeceres et al. 2020, 2021). We attribute this behaviour to a series of factors. First, in our earlier works, we studied the dynamics of desorption at 10 K and at such low temperatures, the molecular mobility (translation) is much lower than at 100 K. Second, in previous works, we studied the dynamics of the desorption of rather small adsorbates (N atoms and H2 molecules), which are significantly more rigid and not greatly affected by other internal vibrations of the adsorbate. Finally, the models for the surface in those works are larger and more compact, where we used hemispherical clusters containing 1000–1500 atoms. Because of all these factors, we consider that our structural models behave rather well within the limitations of the method and allow quantification of attempt frequencies. To determine the local maxima on the plots in Fig. 6, we scanned the plotted function in search of points of negative curvature. We used the find_peaks tool of the Scipy scientific library to automatise the whole process (Virtanen et al. 2020). The prominence of the peak was required to be 1–2% in order to be considered an actual maximum. Attempt periods were determined as the times between maxima and varied on average between 355 and 456 fs, yielding attempt frequencies of v = 2.2–2.8 × 10¹² s–1, which is in good agreement with the estimations found in astrochemical models, of namely 1 × 10¹² s–1. The average value is 2.4 × 10¹² s–1. By plugging the average binding energy (3624 K, from B3LYP-D4 energies) and attempt frequencies into Eq. (2), we obtain desorption rate constants of 4.37 × 10⁻⁴ s–1, and a half-life time of  .
.
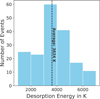 |
Fig. 4 Desorption energies for the CH3CHO + (H2O)100 system in the 1000-7000 K range, employing the B3LYP-D4/def2-TZVP method to obtain the electronic energies. |
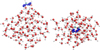 |
Fig. 5 Representation of one molecular dynamics trajectory (left: side view, right: top view) used to sample the attempt frequencies of desorption. The evolution of the centre of mass of the adsorbate is depicted in blue in the figure. For clarity, we represent a point every 12.5 fs of the trajectory. Acetaldehyde (depicted transparently in the figure) is represented in its configuration at the beginning of the simulation. |
 |
Fig. 6 Evolution of the z coordinate of the centre of mass of CH3CHO as a function of time in our simulations. Black dots represent the local maxima of the coordinate positions according to our estimation criteria (see text). |
3.2 Experimental results
3.2.1 Desorption from np-ASW
In Fig. 7, we show CH3CHO desorption from a clean Al surface and from np-ASW. In the case of the CH3CHO/ASW two-layer system, the desorption of ASW is also presented. The larger distribution of absorption sites present in the np-ASW surface in comparison to the Al surface is seen as a longer wing at higher temperatures in the TPD curve. Also, a second weak peak in desorption appears above 140 K coincident with water desorption. With increasing temperature, a small amount of CH3CHO diffuses into the ice. Desorption of this trapped CH3CHO takes place upon water-ice crystallisation. This latter is termed volcano desorption (Smith et al. 1997) and is attributed to the opening of connected pathways formed during the nucleation and growth of crystalline ice. The process is likely favoured by the release of heat from crystallisation and is usually found in the desorption of volatiles from water ice (Collings et al. 2004). This feature is attributed to the diffusion of CH3CHO molecules within the water ice during the amorphous to crystalline water-ice phase transition.
Figure 8 shows TPD spectra of CH3CHO layers deposited on top of np-ASW, ranging from submonolayer to multilayer coverages. A major factor affecting the shape of the TPD curves and their evolution with coverage is the relative strength of the interactions within the system (Nieskens et al. 2003; Maté et al. 2019). When the attraction between the adsorbed molecules dominates over the interaction with the surface, the molecules do not form a homogenous monolayer on top of it but segregate, forming islands. In this situation, even for submonolayer coverages, the molecules desorb following zero-order kinetics at temperatures equal to those of multilayer desorption. On the contrary, when the interaction with the surface is stronger, the molecules diffuse on the surface, forming a homogenous layer, and the species desorb following first-order desorption. In this last case, TPD curves of different coverages align on the high-temperature side. In the experiments presented in Fig. 8, this tendency is observed for CH3CHO for submonolayer coverages and therefore first-order kinetics is assumed.
We employed the curves of one monolayer and two submonolayer coverages to extract information about the distribution of desorption energies of CH3CHO on np-ASW (bottom panel in Fig. 8). For this analysis, the small second TPD peak at T > 140 K was not taken into account. As indicated above, this peak - which is common to the desorption of volatiles from water ice (Collings et al. 2004) – corresponds to the volcano desorption of molecules trapped within the ice and does not reflect the volatile-water interaction, but rather the crystallisation of water-ice. The small TPD peaks were therefore removed from the experimental curves before the analysis. The removed diffused-molecules fraction is about 5%.
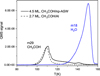 |
Fig. 7 TPD spectra for CH3CHO ice layers deposited on np-ASW and on Al surfaces, heated at 0.10 K s–1. The curves correspond to 4.5 ML and 2.7 ML, respectively. The ML is defined as 1015 molecules cm–2. |
3.2.2 TPD analysis: desorption energies
Processes like surface diffusion (He et al. 2018) or the interaction between neighbouring adsorbate molecules (Jansen 2004; Nieskens et al. 2003) affect the TPD profiles, and the interpretation is not always straightforward. Depending on the system studied, different kinds of approximations can be made to analyse TPD data. In this work, we followed the inversion analysis method (Tait et al. 2005; Zubkov et al. 2007). The TPD curves are described by the Polanyi-Wigner equation (Polanyi & Wigner 1928), which is an Arrhenius-type equation with activation energy and a pre-exponential factor that can be expressed as:
 (3)
(3)
where θ is the coverage (θ =1 for 1 ML), n the desorption order (n = 1 in our case), v the pre-exponential factor of desorption (which is assumed to be coverage independent), β the heating ramp (in our case 0.1 K s–1), and Ed the desorption energy. If we arrange the equation, we can determine the coverage-dependent desorption energy as:
 (4)
(4)
We solved Eq. (4) using the experimental TPD curves presented in Fig. 9. As the desorption energy and the preexponential factor appear in the equation as degenerated parameters, they cannot be derived from a single TPD experiment. However, from a set of monolayer and submonolayer coverage TPD curves, following the procedure previously described by Smith et al. (2014, 2016), it is possible to estimate a preexponential factor from the experiments, as described next. Applying Eq. (4), desorption energies are obtained from the TPD curves corresponding to 1, 0.9, and 0.7 ML using different preexponential factors. The left panel of Fig. 9 shows the desorption energies found for v values varying from 107 to 1015 s–1. It can be seen that, not only does the absolute value of the energies change with v, but also the shape of the Ed(θ) curves. The best coincidence between the energies coming from the three sets of data (1, 0.9, and 0.7 ML curves) is seen when v is between 1011 and 1013 s–1, that is, 1012±1 s–1. We notice that the theoretical value estimated in the previous section of vtheo = 2.4 × 10¹² s–1 lies within this range and provides an alternative way of constraining such a parameter. The desorption energies obtained using the theoretical pre-exponential factor are also shown in the left panel of Fig. 9. An average of the three Ed(θ) curves extracted using vtheo was made and used to simulate the desorption profiles presented in the right panel of Fig. 9 together with the experimental ones. A key factor in reproducing the experimental profiles is to have good overlap between the Ed obtained for 0.7, 0.9, and 1 ML coverages. It is worth noting that a small variation in Ed drastically modifies the simulated profiles. To illustrate this dependence, some error bars have been included in the right panel of Fig. 9. The amplitude of the error bars shows the modification in the desorption rates caused by 1% variation in Ed.
Subsequently, we derived the distribution of binding-site energies, which is given by the expression
 (5)
(5)
from the Ed(θ) calculated with vtheo. We present these results in Fig. 10. The dependence of the average value of the energy distributions on the pre-exponential factor is shown in the bottom panel of this latter figure. It can be seen that an order of magnitude change in v leads only to a 7% variation in the desorption energy. For comparison with the theoretical binding energies estimated in the previous section, we chose the mean value of the energy distribution obtained with vtheo, that is 3774 K. This is the value that we list in Table 1 along with the theoretical ones.
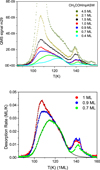 |
Fig. 8 TPD spectra of CH3COH from np-ASW. Top panel: TPD spectra of CH3COH from np-ASW, from submonolayer coverage to multilayer coverage, as specified in the legend. Bottom panel: selected TPD spectra from the top panel, employed to obtain desorption energies. |
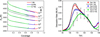 |
Fig. 9 Binding energies distribution and desorption rates. Left panel: distribution of energies obtained for the pre-exponential factors indicated in the legend. The three different colours (green, blue, and red) in each curve correspond to 0.7, 0.9, and 1 ML coverages. Right panel: experimental (solid lines) and simulated (dashed lines) desorption rates obtained with the Ed(θ) distribution corresponding to (vtheo = 2.4 × 10¹² s–1). |
4 Discussion
Looking at the desorption energy values presented in Table 1, we observe that the agreement between experiments and theory is excellent, meaning that DFT//GFN2-xTB is a suitable method for a quick yet reliable exploration of binding energies on water ices. This is in evident agreement with the literature (Germain et al. 2021). The authors of this latter work warn of exceptions in the applicability of this scheme for general adsorbates (i.e. for radicals) and here remains justified in comparison with the estimated desorption energies from our own experiments. The influence of the DFT method used in the correction of the electronic energies is minute; we observe very little difference between the different exchange and correlation functionals.
The excellent match between the binding energies from the GFN2-xTB geometries and experiments proves that the theoretical method based on GFN2-xTB provides a reasonable estimation of the atomic and molecular forces driving the geometry of the binding sites, and consequently validates the theoretical approach employed to determine the pre-exponential factor. From an experimental point of view, the good agreement shows that the Polanyi-Wigner rate equation adequately describes the desorption of CH3CHO from ASW solid surfaces. However, due to the degeneracy in the Polanyi-Wigner equation between v and Ed, the choice of an adequate pre-exponential factor in the analysis of desorption experiments is a critical factor, and is the subject of debate in the literature. Some authors observe first-order desorption kinetics behaviour in their TPD experiments and assume a value in the 1012–1014 s–1 range, which are typical vibration frequencies of small molecules (Noble et al. 2012; He et al. 2014, 2016, 2018). As we have done in the present work, some authors estimate the pre-exponential factor using a set of experimental TPD curves corresponding to monolayer and submonolayer coverages (Smith et al. 2014, 2016; Chaabouni et al. 2018). However, these estimations have large uncertainties due to the logarithmic dependence between the pre-exponential factor and the desorption energy.
In this work, we suggest, for the first time, an alternative to the two approaches mentioned above based on a comparison between an experimentally determined pre-exponential factor and that derived from first-principles theory. The experimental pre-exponential factor obtained is vexp = 1012±1 s–1 while the theoretical one is vtheo = 2.4 × 10¹² s–1. The experimental constraint of the pre-exponential value is in good agreement with the theoretical result, which again proves the adequacy of the approximations employed to analyse the experiments. The cost of computing the theoretical pre-exponential factors is small, because we take advantage of a fast and reliable exploration of the CH3CHO/H2O configurational space using the GFN2-xTB Hamiltonian. For other complex systems, such as radicals, a careful assessment of the predictive capabilities of this method is advised.
Understanding the sublimation and condensation of interstellar ices is essential for a sound interpretation of astrophysical observations in many astrophysical environments and, in particular, in the physics and chemistry of star formation. In dense clouds, an unexpected number of chemical species have been detected in the gas phase. The binding energies of these species on ASW, which is the main component of the ice mantles covering dust grains in those regions, are crucial physical magnitudes in the astrophysical models that try to interpret these observations (Penteado et al. 2017). Also, the binding energy of COMs on ASW will affect the evolution of protostars and the formation of cometary systems, directly influencing the position of the snow lines of the different species. A thorough review was recently published by Minissale et al. (2022) that stresses the relevance of ice desorption in astrochemistry.
The experimental distribution of binding energies for acetaldehyde on ASW extends between 3450 and 4500 K, with its maximum at 3550 K, and an average value of 3774 K. That is well below the binding energies of amorphous or crystalline water which are 4810 K and 4930 K, respectively, with a preexponential factor of 1012 s–1 (Fraser et al. 2001). These values are in accordance with the theoretically determined ones, but show greater scatter, which we attribute to the various processes at play in the experiments (diffusion, molecule-molecule interactions), which are not taken into account in the theoretical calculations. In general, the binding energy distribution of acetaldehyde is entirely below that of formamide (Ed = 5056–6990 K), a species that is less volatile than water (Chaabouni et al. 2018). Methylamine shows an intermediate behaviour between acetaldehyde and formamide, being more volatile than formamide but less than acetaldehyde. Its desorption energy distribution extends between 3010 and 8420 K. Methylamine diffuses very efficiently in water ice and remains on the surface after water sublimation. On the contrary, acetaldehyde desorbs almost completely before water sublimation. However, in our experiments we observe overlap between the sublimation of water and the last tails of the desorption energy distribution of acetaldehyde. A small fraction of acetaldehyde starts to diffuse in the np-ASW layer, but it co-desorbs with water in the first stages of water sublimation. Methanol, a fundamental interstellar molecule, presents desorption energies in the range between 5000 and 5500 K (Collings et al. 2004; Bahr et al. 2008; Wakelam et al. 2017), well above our values for CH3CHO.
In a recent work, Penteado et al. (2017) showed that the current uncertainties in the binding energies of molecules on grains can lead to very different model predictions for the chemical composition of dark clouds. Not surprisingly, the effect was found to be extreme in the case of H2 binding, but was also appreciable for other molecules. Binding energies in the databases used for astrochemical models are from a variety of sources, mostly theoretical calculations of varying accuracy and approximate estimates. Measured values are only available for a small fraction of the molecules included in the models. Appreciable disparities are often found between different data compilations (see discussion in Penteado et al. 2017) stressing the need for more accurate measurements.
We are aware of two previous values for the Ed of CH3CHO. The recommended value by Penteado et al. (2017), which is 2870 ± 500 K, can be traced back to the work of Allen & Robinson (1977). The value is given for desorption from a silicate surface and is an estimate based on thermodynamic data. A value of 3800 K is found in the commonly used UMIST database for astrochemistry (McElroy et al. 2013), where the authors refer to the work of Öberg et al. (2009). This value was derived from TPD measurements of multilayered (4ML) CH3CHO from a metallic substrate and the estimated uncertainty is 400 K. As far as we know, the present Ed = 3774 K, corresponding to the average of the binding energy distribution, is the first experimental determination of a binding energy for CH3CHO on a realistic water-ice surface.
At present, just a few molecules have been unquestionably identified in interstellar ices: H2O, CO, CO2,CH3OH, NH3, and CH4 (Boogert et al. 2015). Among them, carbon-containing molecules have just one carbon atom. However, the recently launched James Web Space Telescope (JWST) will conduct a search for less abundant ice species with special attention to COMs with two carbon atoms. Acetaldehyde is one of the firmest candidates for detection. Besides its ubiquity and comparatively high gas phase abundance mentioned in the introduction, it has been tentatively suggested as a possible carrier of the weak 7.41 µ m band recorded in observations of the Infrared Space Observatory (ISO-SW) towards the young stellar object W33A (Schutte et al. 1999). As demonstrated by theoretical studies, acetaldehyde can be formed from the recombination of CH3 and CHO on dust grains (Lamberts et al. 2019; Enrique-Romero et al. 2021). Such recombination is a highly exothermic process that, in combination with the relatively low binding energy of the molecule with ASW, may suggest a return to the gas phase of the nascent molecule via non-thermal effects. Other mechanisms can be at play in this non-thermal scenario, such as cosmic-ray-induced desorption (Roberts et al. 2007; Sipilä et al. 2021). These assumptions remain speculative but may explain the apparent abundance of CH3CHO in pre-stellar cores compared to some other iCOMS. The present data on the desorption of CH3CHO from water-ice can be of help for the interpretation of future, more sensitive observations and for the elaboration of grain-gas models.
The different desorption energies found for the different iCOMs will affect the composition of the gas-phase environments; not only those present in the ISM in the various stages of star and planet formation but also in our Solar System in the coma of comets. The desorption energies might be helpful for understanding the process that leads to the formation of these species, helping us to decipher whether it takes place in the gas or in the solid phase.
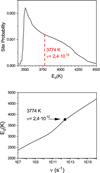 |
Fig. 10 Binding energies distribution and distribution mean value. Top panel: distribution of binding-site energies of CH3CHO on np-ASW. Bottom panel: variation of the position of the mean value of the binding-site distribution with the pre-exponential factor. |
5 Conclusion
We provide for the first time experimental and theoretical values for CH3CHO desorption energies from np-ASW, and, consequentially, information on the nature of the binding of this molecule with interstellar surfaces. The comparison of the desorption energies of CH3CHO with other organic molecules, such as CH3NH2 and NH2CHO, shows that CH3CHO is more volatile. Therefore, we suggest that, in consideration of the average binding energy, CH3CHO might undergo reactive desorption, cosmic-ray-induced desorption, or be exposed to other types of non-thermal effects, providing an explanation for its prevalence in the gas phase of pre-stellar cores. Dedicated laboratory and theoretical efforts are required to confirm this possibility. In addition to reactive desorption, the more volatile nature of CH3CHO also indicates that it will experience early desorption during the ice-sublimation phase in hot cores (Boogert et al. 2015).
Finally, we would like to emphasise the convenience of merging experimental and computational efforts in the study of desorption dynamics to better understand desorption in interstellar ices and provide quantitative information on the magnitudes relevant for this process. Such improvements will lead to a better description of the grain-gas interface in astrochemical models.
Acknowledgements
Computer time was granted by the state of Baden-Württemberg through bwHPC and the German Research Foundation (DFG) through grant no. INST 40/467-1FUGG is greatly acknowledged. G.M thanks the Alexander von Humboldt Foundation for a post-doctoral research grant. We thank the Deutsche Forschungsgemeinschaft (DFG, German Research Foundation) for supporting this work by funding EXC 2075 – 390740016 under Germany’s Excellence Strategy. We acknowledge the support by the Stuttgart Center for Simulation Science (SimTech). V.J.H., R.J.P. and B.M. thank the funding by the Ministerio de Ciencia e Innovacion of Spain under grant PID2020-113084GB-I00, and the CSIC i-LINK+ project LINKA20353.
References
- Ahlrichs, R., Bär, M., Häser, M., Horn, H., & Kölmel, C. 1989, Chem. Phys. Lett., 162, 165 [NASA ADS] [CrossRef] [Google Scholar]
- Allen, M., & Robinson, G. W. 1977, ApJ, 212, 396 [Google Scholar]
- Bahr, S., Toubin, C., & Kempter, V. 2008, J. Chem. Phys., 128, 134712 [CrossRef] [Google Scholar]
- Bannwarth, C., Ehlert, S., & Grimme, S. 2019, J. Chem. Theory Comp., 15, 1652 [CrossRef] [Google Scholar]
- Bannwarth, C., Caldeweyher, E., Ehlert, S., et al. 2021, WIREs Comput. Mol. Sci., 11, e1493 [CrossRef] [Google Scholar]
- Becke, A. D. 1988, Phys. Rev. A, 38, 3098 [NASA ADS] [CrossRef] [Google Scholar]
- Becke, A. D. 1993, J. Chem. Phys., 98, 5648 [Google Scholar]
- Bisschop, S. E., Jørgensen, J. K., van Dishoeck, E. F., & de Wachter, E. B. M. 2007, A&A, 465, 913 [NASA ADS] [CrossRef] [EDP Sciences] [Google Scholar]
- Boogert, A. C. A., Gerakines, P. A., & Whittet, D. C. 2015, ArA&A, 53, 541 [CrossRef] [Google Scholar]
- Caldeweyher, E., Ehlert, S., Hansen, A., et al. 2019, J. Chem. Phys., 150, 154122 [Google Scholar]
- Cazaux, S., Tielens, A. G. G. M., Ceccarelli, C., et al. 2003, ApJ, 593, L51 [NASA ADS] [CrossRef] [Google Scholar]
- Chaabouni, H., Diana, S., Nguyen, T., & Dulieu, F. 2018, A&A, 612, A47 [NASA ADS] [CrossRef] [EDP Sciences] [Google Scholar]
- Charnley, S. B. 2004, Adv. Sp. Res., 33, 23 [NASA ADS] [CrossRef] [Google Scholar]
- Codella, C., Fontani, F., Ceccarelli, C., et al. 2015, MNRAS, 449, L11 [CrossRef] [Google Scholar]
- Collings, M. P., Anderson, M. A., Chen, R., et al. 2004, MNRAS, 354, 1133 [NASA ADS] [CrossRef] [Google Scholar]
- Corazzi, M. A., Brucato, J. R., Poggiali, G., et al. 2021, ApJ, 913, 128 [NASA ADS] [CrossRef] [Google Scholar]
- Dohnálek, Z., Kimmel, G. A., Ayotte, P., Smith, R. S., & Kay B. D. 2003, J. Chem. Phys., 118, 364 [CrossRef] [Google Scholar]
- Enrique-Romero, J., Ceccarelli, C., Rimola, A., et al. 2021, A&A, 655, A9 [NASA ADS] [CrossRef] [EDP Sciences] [Google Scholar]
- Fraser, H. J., Collings, M. P., McCoustra, M. R. S., & Williams, D. A. 2001, MNRAS, 327, 1165 [Google Scholar]
- Furche, F., Ahlrichs, R., Hättig, C., et al. 2014, Wiley Interdiscip. Rev.: Comput. Mol. Sci., 4, 91 [CrossRef] [Google Scholar]
- Garrod, R. T., & Herbst, E. 2006, A&A, 457, 927 [NASA ADS] [CrossRef] [EDP Sciences] [Google Scholar]
- Germain, A., Corno, M., & Ugliengo, P. 2021, in Lecture Notes in Computer Science (including subseries Lecture Notes in Artificial Intelligence and Lecture Notes in Bioinformatics), eds. O. Gervasi, B. Murgante, S. Misra, C. Garau, I. Blečič, D. Taniar, B. O. Apduhan, A. M. A. C. Rocha, E. Tarantino, & C. M. Torre (Cham: Springer International Publishing), 12953 LNCS 632 [Google Scholar]
- Germain, A., Tinacci, L., Pantaleone, S., Ceccarelli, C., & Ugliengo, P. 2022, ACS Earth Space Chem., 6, 1286 [Google Scholar]
- He, J., Jing, D., & Vidali, G. 2014, Phys. Chem. Chem. Phys., 16, 3493 [Google Scholar]
- He, J., Acharyya, K., & Vidali, G. 2016, ApJ, 825, 89 [Google Scholar]
- He, J., Emtiaz, S., & Vidali, G. 2018, ApJ, 863, 156 [CrossRef] [Google Scholar]
- Holdship, J., Viti, S., Codella, C., et al. 2019, ApJ, 880, 138 [NASA ADS] [CrossRef] [Google Scholar]
- Imai, M., Sakai, N., Oya, Y., et al. 2016, ApJ, 830, L37 [CrossRef] [Google Scholar]
- Jansen, A. P. J. 2004, Phys. Rev. B, 69, 035414 [NASA ADS] [CrossRef] [Google Scholar]
- Jiménez-Serra, I., Vasyunin, A. I., Caselli, P., et al. 2016, ApJ, 830, L6 [Google Scholar]
- Kästner, J., Carr, J. M., Keal, T. W., et al. 2009, J. Phys. Chem. A, 113, 11856 [CrossRef] [Google Scholar]
- Lamberts, T., Markmeyer, M. N., Kolb, F. J., & Kästner, J. 2019, ACS Earth Space Chem., 3, 958 [Google Scholar]
- Mastrapa, R. M., Sandford, S. A., Roush, T. L., Cruikshank, D. P., & Ore, C. M. D. 2009, ApJ, 701, 1347 [NASA ADS] [CrossRef] [Google Scholar]
- Matthews, H. E., Friber, P., & Irvine, W. M. 1985, ApJ, 290, 609 [NASA ADS] [CrossRef] [Google Scholar]
- Maté, B., Jiménez-Redondo, M., Peláez, R. J., Tanarro, I., & Herrero, V. J. 2019, MNRAS, 490, 2936 [CrossRef] [Google Scholar]
- McElroy, D., Walsh, C., Markwick, A. J., et al. 2013, A&A, 550, A36 [NASA ADS] [CrossRef] [EDP Sciences] [Google Scholar]
- Metz, S., Kästner, J., Sokol, A. A., Keal, T. W., & Sherwood, P. 2014, Wiley Interdiscip. Rev. Comput. Mol. Sci., 4, 101 [Google Scholar]
- Minissale, M., Aikawa, Y., Bergin, E., et al. 2022, ACS Earth Space Chem., 6, 597 [NASA ADS] [CrossRef] [Google Scholar]
- Molpeceres, G., & Kästner, J. 2021, ApJ, 910, 55 [NASA ADS] [CrossRef] [Google Scholar]
- Molpeceres, G., Zaverkin, V., & Kästner, J. 2020, MNRAS, 499, 1373 [Google Scholar]
- Molpeceres, G., Zaverkin, V., Watanabe, N., & Kästner, J. 2021, A&A, 648, A84 [NASA ADS] [CrossRef] [EDP Sciences] [Google Scholar]
- Nieskens, D., van Bavel, A., & Niemantsverdriet, J. 2003, Surf. Sci., 546, 159 [NASA ADS] [CrossRef] [Google Scholar]
- Noble, J. A., Theule, P., Mispelaer, F., et al. 2012, A&A, 543, A5 [NASA ADS] [CrossRef] [EDP Sciences] [Google Scholar]
- Öberg, K. I. 2016, Chem. Rev., 116, 9631 [Google Scholar]
- Öberg, K. I., Garrod, R. T., van Dishoeck, E. F., & Linnartz, H. 2009, A&A, 504, 891 [NASA ADS] [CrossRef] [EDP Sciences] [Google Scholar]
- Öberg, K. I., Bottinelli, S., Jørgensen, J. K., & van Dishoeck, E. F. 2010, ApJ, 716, 825 [Google Scholar]
- Penteado, E. M., Walsh, C., & Cuppen, H. M. 2017, ApJ, 844, 71 [Google Scholar]
- Polanyi, M., & Wigner, E. 1928, Z. Phys. Chem., 139A, 439 [CrossRef] [Google Scholar]
- Roberts, J. F., Rawlings, J. M., Viti, S., & Williams, D. A. 2007, MNRAS, 382, 733 [NASA ADS] [CrossRef] [Google Scholar]
- Schutte, W. A., Boogert, A. C. A., Tielens, A. G. G. M., et al. 1999, A&A, 343, 966 [NASA ADS] [Google Scholar]
- Scibelli, S., Shirley, Y., Vasyunin, A., & Launhardt, R. 2021, MNRAS, 504, 5754 [NASA ADS] [CrossRef] [Google Scholar]
- Sherwood, P., De Vries, A. H., Guest, M. F., et al. 2003, J. Mol. Struct, 632, 1 [CrossRef] [Google Scholar]
- Sipilä, O., Silsbee, K., & Caselli, P. 2021, ApJ, 922, 126 [CrossRef] [Google Scholar]
- Smith, R. S., Huang, C., Wong, E. K. L., & Kay, B. D. 1997, Phys. Rev. Letters, 79, 909 [NASA ADS] [CrossRef] [Google Scholar]
- Smith, R. S., Matthiesen, J., & Kay, B. D. 2014, J. Phys. Chem. A, 118, 8242 [NASA ADS] [CrossRef] [Google Scholar]
- Smith, R. S., May, R. A., & Kay, B. D. 2016, J. Phys. Chem. B, 120, 1979 [Google Scholar]
- Soma, T., Sakai, N., Watanabe, Y., & Yamamoto, S. 2018, ApJ, 854, 116 [Google Scholar]
- Spicher, S., & Grimme, S. 2020, Angew. Chem. Int. Ed., 59, 15665 [Google Scholar]
- Tait, S. L., Dohnálek, Z., Campbell, C. T., & Kay, B. D. 2005, J. Chem. Phys., 122, 164707 [NASA ADS] [CrossRef] [Google Scholar]
- Vastel, C., Ceccarelli, C., Lefloch, B., & Bachiller, R. 2014, ApJ, 795, L2 [NASA ADS] [CrossRef] [Google Scholar]
- Vasyunin, A. I., & Herbst, E. 2013, ApJ, 769, 34 [Google Scholar]
- Vasyunin, A. I., Caselli, P., Dulieu, F., & Jiménez-Serra, I. 2017, ApJ, 842, 33 [Google Scholar]
- Virtanen, P., Gommers, R., Oliphant, T. E., et al. 2020, Nat. Methods, 17, 261 [Google Scholar]
- Wakelam, V., Loison, J.-C., Mereau, R., & Ruaud, M. 2017, Mol. Astrophys., 6, 22 [NASA ADS] [CrossRef] [Google Scholar]
- Weigend, F., & Ahlrichs, R. 2005, Phys. Chem. Chem. Phys., 7, 3297 [Google Scholar]
- Zhao, Y., & Truhlar, D. G. 2004, J. Phys. Chem. A, 108, 6908 [CrossRef] [Google Scholar]
- Zubkov, T., Smith, R. S., Engstrom, T. R., & Kay, B. D. 2007, J. Chem. Phys., 127, 184707 [NASA ADS] [CrossRef] [Google Scholar]
All Tables
All Figures
|
Fig. 1 Example of CH3CHO positioning around the water cluster. The figure shows the initial positions for 25 molecules, in contrast to the 50 employed by the ice model for ease in visualisation. |
| In the text | |
|
Fig. 2 Scheme of the geometry of the TPD experiments. |
| In the text | |
|
Fig. 3 RAIRS spectra of CH3CHO ice layers grown at 50 K on top of an Al substrate via backfilling or via directional vapour deposition, as explained in the main text. |
| In the text | |
|
Fig. 4 Desorption energies for the CH3CHO + (H2O)100 system in the 1000-7000 K range, employing the B3LYP-D4/def2-TZVP method to obtain the electronic energies. |
| In the text | |
|
Fig. 5 Representation of one molecular dynamics trajectory (left: side view, right: top view) used to sample the attempt frequencies of desorption. The evolution of the centre of mass of the adsorbate is depicted in blue in the figure. For clarity, we represent a point every 12.5 fs of the trajectory. Acetaldehyde (depicted transparently in the figure) is represented in its configuration at the beginning of the simulation. |
| In the text | |
|
Fig. 6 Evolution of the z coordinate of the centre of mass of CH3CHO as a function of time in our simulations. Black dots represent the local maxima of the coordinate positions according to our estimation criteria (see text). |
| In the text | |
|
Fig. 7 TPD spectra for CH3CHO ice layers deposited on np-ASW and on Al surfaces, heated at 0.10 K s–1. The curves correspond to 4.5 ML and 2.7 ML, respectively. The ML is defined as 1015 molecules cm–2. |
| In the text | |
|
Fig. 8 TPD spectra of CH3COH from np-ASW. Top panel: TPD spectra of CH3COH from np-ASW, from submonolayer coverage to multilayer coverage, as specified in the legend. Bottom panel: selected TPD spectra from the top panel, employed to obtain desorption energies. |
| In the text | |
|
Fig. 9 Binding energies distribution and desorption rates. Left panel: distribution of energies obtained for the pre-exponential factors indicated in the legend. The three different colours (green, blue, and red) in each curve correspond to 0.7, 0.9, and 1 ML coverages. Right panel: experimental (solid lines) and simulated (dashed lines) desorption rates obtained with the Ed(θ) distribution corresponding to (vtheo = 2.4 × 10¹² s–1). |
| In the text | |
|
Fig. 10 Binding energies distribution and distribution mean value. Top panel: distribution of binding-site energies of CH3CHO on np-ASW. Bottom panel: variation of the position of the mean value of the binding-site distribution with the pre-exponential factor. |
| In the text | |
Current usage metrics show cumulative count of Article Views (full-text article views including HTML views, PDF and ePub downloads, according to the available data) and Abstracts Views on Vision4Press platform.
Data correspond to usage on the plateform after 2015. The current usage metrics is available 48-96 hours after online publication and is updated daily on week days.
Initial download of the metrics may take a while.