Fig. 5
Download original image
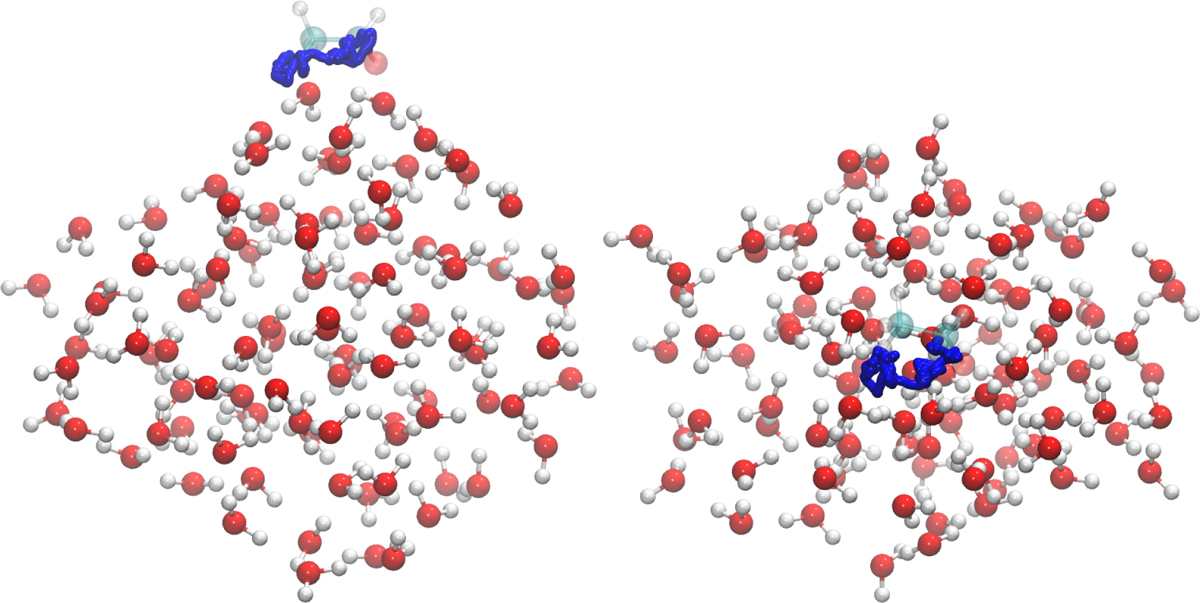
Representation of one molecular dynamics trajectory (left: side view, right: top view) used to sample the attempt frequencies of desorption. The evolution of the centre of mass of the adsorbate is depicted in blue in the figure. For clarity, we represent a point every 12.5 fs of the trajectory. Acetaldehyde (depicted transparently in the figure) is represented in its configuration at the beginning of the simulation.
Current usage metrics show cumulative count of Article Views (full-text article views including HTML views, PDF and ePub downloads, according to the available data) and Abstracts Views on Vision4Press platform.
Data correspond to usage on the plateform after 2015. The current usage metrics is available 48-96 hours after online publication and is updated daily on week days.
Initial download of the metrics may take a while.