Fig. 6.
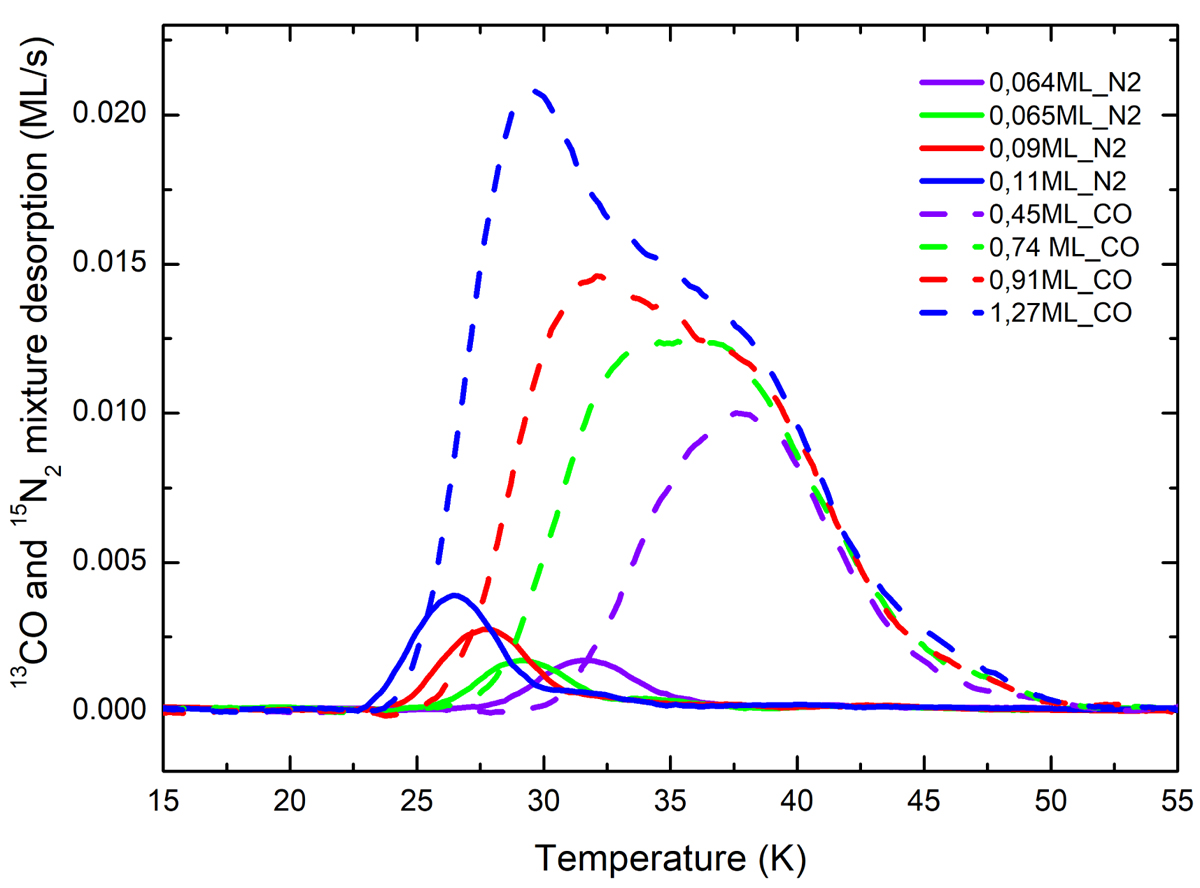
TPD profiles of various mixtures of CO and N2 deposited on poly-crystalline water ice (PCI) substrate. CO and N2 are plotted with dashed and solid lines, respectively. Each colour corresponds to one experiment. CO is always the most abundant species with and its coverage varying between 0.45 ML and 1.2 ML, whereas N2 coverage remains around 0.1 ML.
Current usage metrics show cumulative count of Article Views (full-text article views including HTML views, PDF and ePub downloads, according to the available data) and Abstracts Views on Vision4Press platform.
Data correspond to usage on the plateform after 2015. The current usage metrics is available 48-96 hours after online publication and is updated daily on week days.
Initial download of the metrics may take a while.