Fig. 4
Download original image
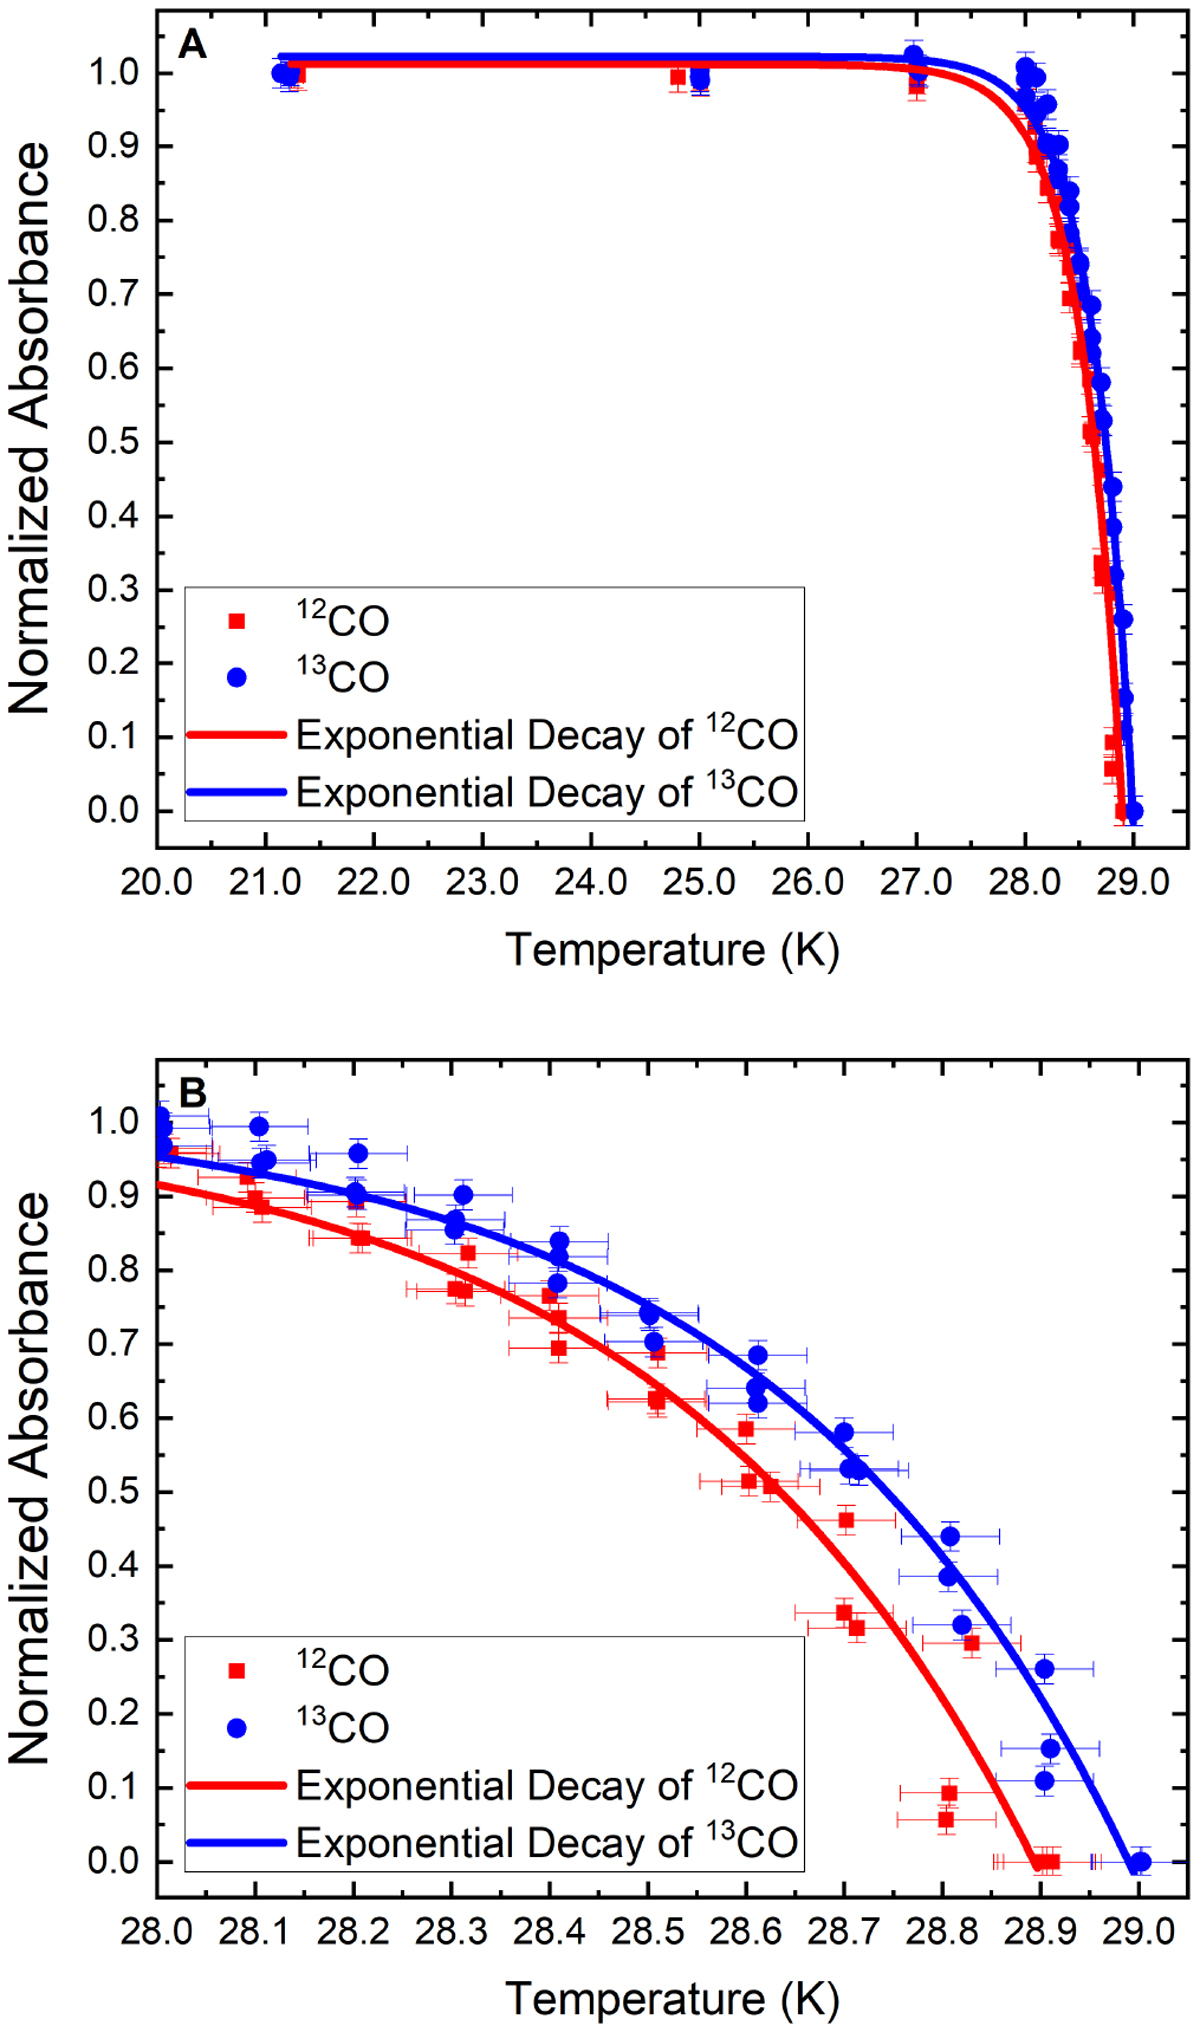
Normalized ice absorbance at each equilibrated temperature for 12CO ice (red squares) and 13CO ice (blue circles) obtained from each of the three TID experiments per isotopologue, showing (A) the entire TID temperature range and (B) the range of temperatures with measurable desorption. Exponential decay fits from Eq. (1) are shown as solid lines. Fit parameters are: A° = 1.01 ± 0.2, A = (−1.0 ± 4.0) × 10−33, and τ = − 0.38 ± 0.04 K for 12CO; and A° = 1.02 ± 0.02, A = (−0.6 ± 2.0) × 10−34, and τ = −0.37 ± 0.02 K for 13CO. Both curves have an associated R2 > 0.97.
Current usage metrics show cumulative count of Article Views (full-text article views including HTML views, PDF and ePub downloads, according to the available data) and Abstracts Views on Vision4Press platform.
Data correspond to usage on the plateform after 2015. The current usage metrics is available 48-96 hours after online publication and is updated daily on week days.
Initial download of the metrics may take a while.