| Issue |
A&A
Volume 655, November 2021
|
|
|---|---|---|
| Article Number | A37 | |
| Number of page(s) | 21 | |
| Section | Astronomical instrumentation | |
| DOI | https://doi.org/10.1051/0004-6361/202141028 | |
| Published online | 10 November 2021 | |
Quantitative polarimetry of the disk around HD 169142
Institute for Particle Physics and Astrophysics, ETH Zurich, Wolfgang-Pauli-Strasse 27, 8093 Zurich, Switzerland
e-mail: This email address is being protected from spambots. You need JavaScript enabled to view it.
Received:
8
April
2021
Accepted:
10
July
2021
Abstract
Context. Many scattered light images of protoplanetary disks have been obtained with the new generation of adaptive optics (AO) systems at large telescopes. The measured scattered radiation can be used to constrain the dust that forms planets in these disks.
Aims. We want to constrain the dust particle properties for the bright, pole-on transition disk around HD 169142 with accurate measurements and a quantitative analysis for the polarization and intensity of the scattered radiation.
Methods. We investigate high resolution imaging polarimetry of HD 169142 taken in the R′ and I′ bands with the SPHERE/ZIMPOL AO instrument. The geometry of this pole-on disk is close to rotational symmetry, and we can use azimuthally averaged radial profiles for our analysis. We describe the dependence of the disk polarimetry on the atmospheric turbulence, which strongly impacts the AO point spread function (PSF). With non-coronagraphic data we can analyze the polarimetric signal of the disk simultaneously with the stellar PSF and determine the polarization of the disk based on simulations of the PSF convolution. We also extract the disk intensity signal and derive the fractional polarization for the R′ and I′ bands. We compare the scattered flux from the inner and outer disk rings with the corresponding thermal dust emissions measured in the IR and estimate the ratio between scattered and absorbed radiation.
Results. We find for the inner and outer disk rings of HD 169142 mean radii of 170 ± 3 mas and 522 ± 20 mas, respectively, and the same small deviations from a perfect ring geometry as previous studies. The AO performance shows strong temporal variation because of the mediocre seeing of about 1.1″; this produces PSF peak variations of up to a factor of four and strongly correlated changes for the measured disk polarization of about a factor of two for the inner disk ring and about 1.2 for the more extended outer disk. This variable PSF convolution effect can be simulated and accurately corrected, and we obtain ratios between the integrated disk polarization flux and total system flux (Q̂ϕ/Itot) of 0.43 ± 0.01% for the R′ band and 0.55 ± 0.01% for the I′ band. This indicates a reddish color for the light reflection by the dust. The inner disk ring contributes about 75% and the outer disk about 25% to the total disk flux. The extraction of the scattered intensity of the disk is only possible for the bright, narrow, inner disk ring, and the obtained fractional polarization p̂ for the scattered radiation is 23.6 ± 3.5% for the I′ band and 22.0 ± 5.9% for the R′ band. The ratio between scattered disk flux and star flux (Îdisk/I⋆) is about 2.3 ± 0.3%. This is much smaller than the derived IR excess FfIR/F⋆ = 17.6% for the disk components observed in scattered light. This indicates that only a small fraction of the radiation illuminating the disk is scattered; most is absorbed and reemitted in the IR.
Conclusions. We demonstrate the feasibility of accurate quantitative photo-polarimetry of a circumstellar disk with a radius of less than 0.2″, observed with ground-based AO systems, if the PSF convolution effects can be properly taken into account. Accurate measurements are a pre-requisite for finding differences in the dust properties for different disks. The derived fractional polarization of about 23% in the R′ and I′ bands for the compact (20 AU) inner disk of HD 169142 is lower than the measurement for the more extended disk HD 142527 for the same wavelength range and significantly lower than the estimates for near-IR data of other extended protoplanetary disks.
Key words: protoplanetary disks / polarization / scattering / instrumentation: adaptive optics / stars: individual: HD 169142 / techniques: polarimetric
© ESO 2021
1. Introduction
Planetary systems are formed in circumstellar disks made of gas and dust around pre-main-sequence stars. Much has been learned about these systems in recent years thanks to improved observational techniques. Important information about disks, in particular about the dust in the disks, is gained from the analysis of the spectral energy distribution (SED; e.g., Woitke et al. 2016), from detailed Atacama Large Millimeter/submillimeter Array (ALMA) images of the cold, large dust particles in the disk midplane (e.g., van der Marel 2017), from IR interferometry of the hot dust near the star (Kluska et al. 2020) and from the imaging in the near-IR and visual of the light scattered by the dust at the disk surface (e.g., Avenhaus et al. 2018). Each of these techniques provides complementary information and improves our understanding of the role of the dust in the planet formation process in circumstellar disks. This work describes quantitative measurements of the polarization and intensity of the light scattered by the dust in the disk around HD 169142 based on archival data from the Very Large Telescope (VLT) adaptive optics (AO) instrument Spectro-Polarimetric High-contrast Exoplanet REsearch (SPHERE)/Zurich Imaging Polarimeter (ZIMPOL). A quantitative analysis is a prerequisite for constraining with the model simulation the scattering albedo, the size distribution, and the compactness of the scattering particles, which can be compared with expectations for different dust types, such as icy high albedo grains, carbon-rich dark particles, or highly porous aggregates (e.g., Kolokolova & Kimura 2010; Min et al. 2016; Tazaki et al. 2019). Such investigations will complement studies on the thermal emission of the dust and help us better understand the evolution of the dust particles in these disks and the resulting composition of the forming planets.
The disk integrated intensity (or spectral flux density) is low when compared to the central star, on the order Idisk/Istar ≲ 3%, and depends on the disk geometry. The surface brightness is relatively high for strongly illuminated regions, such as the inner disk wall of transition disks, and faint for disk regions, which are far from the star and illuminated only under gracing incidence, or regions located in the shadow cast by disk structures farther in (Garufi et al. 2017a). The measurement of scattered light from a protoplanetary disk requires an instrument with high spatial resolution and high contrast capabilities to resolve the strongly illuminated inner disk regions.
Early detections of the scattered light from protoplanetary disks were achieved with the first AO systems at large telescopes and with Hubble Space Telescope (HST) (e.g., Roddier et al. 1996; Silber et al. 2000). Initially, only extended targets, r > 1″, could be observed, for instance the circumbinary disk of GG Tau. Differential polarimetry turned out to be a very useful high contrast technique for separating the scattered, and therefore polarized, light of the disk from the direct, unpolarized, bright starlight (Gledhill & Scarrott 1989; Kuhn et al. 2001). This technique was combined in many high resolution instruments that use AO systems (see Schmid 2021, for a review), such as VLT/NACO (Lenzen et al. 2003), Subaru/CIAO (Murakawa et al. 2004), HICIAO (Hodapp et al. 2008), Gemini/GPI (Perrin et al. 2015), and VLT/SPHERE (Beuzit et al. 2019; Schmid et al. 2018; de Boer et al. 2020). Detections of the polarized intensity from about 100 protoplanetary disks have meanwhile been achieved with these systems, and some examples from different instruments are described in Apai et al. (2004), Quanz et al. (2011), Hashimoto et al. (2011), Muto et al. (2012), Benisty et al. (2015), Monnier et al. (2017), and Garufi et al. (2017a). These data reveal a rich variety of disk morphologies and provide details about the geometric structure, disk dynamics, and possible interactions between the disk and newly formed planets.
However, almost no accurate photo-polarimetric measurements of the scattered light from protoplanetary disks exist despite the many successful and very clear detections of polarization signals. Typically, rough values for the maximum fractional polarization are given, for example p ≈ 50% for GG Tau for λ = 1 μm (Silber et al. 2000) and ≈55% for AB Aur at 2 μm (Perrin et al. 2009), based on HST polarimetry, or a maximum polarization of p ≈ 60% in the H band for HD 34700A Monnier et al. (2019) based on ground-based AO observations. There are also strongly controversial estimates for a given disk, for example for the eastern side of HD 142527 for which Canovas et al. (2013) reported a value of pdisk < 20% in the H band while Avenhaus et al. (2014) guessed a much larger value of ≈45% for the same wavelength. HD 142527 has a very bright and extended disk for which a determination of the fractional polarization is relatively easy. Therefore, Hunziker et al. (2021) was able to obtain a first accurate photo-polarimetric measurement for this system for a protoplanetary disk, including a detailed assessment of bias effects and measurements of uncertainties. Among other parameters, the controversial H-band fractional polarizations of the eastern side were finally found to be p = (35.1 ± 2.0)%. In addition, the corresponding value of (28.0 ± 0.8)% for a visual broad band (VBB λc = 735 nm) was also obtained, and this yields a well-defined wavelength dependence of the fractional polarization and, therefore, strong constraints on the scattering dust.
Quantitative measurements such as those for HD 142527 should be obtained for many circumstellar disks, but this also requires the investigation of measuring procedures for systems with other geometries taken with different instruments and observational conditions. Important problems to be solved are the polarimetric calibration of the AO instrument, the accurate extraction of the disk intensity signal, and the correction of measuring results for the variable intensity smearing and polarization cancelation effects. It will be of great interest to achieve a high accuracy for disks with different geometries, ages, and host stars and for different wavelengths in order to constrain the evolution of the scattering dust particles. All these challenges are easier or harder to solve depending on the properties of the investigated disk, the instrument used, and the quality of the observations. In this work we carry out a case study for accurate photometric and polarimetric measurements for the bright, pole-on, and almost centro-symmetric transition disk around HD 169142.
The next section summarizes relevant properties of the HD 169142 system from the literature, and Sect. 3 describes the used SPHERE/ZIMPOL data from the European Southern Observatory (ESO) archive and the data reduction. The data analysis in Sect. 4 characterizes the geometric structure of disk rings, measures and models the radial polarization profile, extracts the disk intensity signal, and compares the scattered light intensities with the thermal dust emission taken from the literature. In Sect. 5 we discuss our measurements for the disk around HD 169142, deduce scattering parameters for the dust, and provide constraints on the properties of the scattering dust, before concluding in Sect. 6.
2. The HD 169142 disk
HD 169142 is a well-studied young star with a protoplanetary disk seen close to pole-on (see Fig. 1). It was first identified as a “Vega-like” star with IR excess emission based on photometry from the IRAS satellite (Walker & Wolstencroft 1988). The system is located at a distance of 114 pc (Gaia Collaboration 2018) and it cannot be associated with a well-known star forming region. Grady et al. (2007) estimate an age in the range 3 − 12 Myr from a close-by, co-moving T Tauri star binary. Spectral classifications for HD 169142 range from A5 Ve (Teff ≈ 8400 K) to A8 Ve and it could be a rapidly rotating A-star with a latitudinal temperature gradient (Dunkin et al. 1997; Grady et al. 2007). No clear signatures of gas accretion have been detected to a limit of about < 2 × 10⁻⁹ M⊙ yr−1 based on far-UV spectroscopy with IUE satellite or X-ray observations with ROSAT and Chandra space telescopes (see Grady et al. 2007). The interstellar extinction is low E(B − V)≈0.1 mag and the stellar luminosity is estimated to be about 10 L⊙ (Sylvester et al. 1996; Woitke et al. 2019).
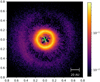 |
Fig. 1. High signal-to-noise Qϕ azimuthal polarization image of the HD 169142 protoplanetary disk obtained by stacking all R′, I′, and VBB-filter frames from 2015 given in Table 1. The position of the star is marked with a green circle, and the axes give the separation in arcseconds. North is up and east to the left. |
The transition disk IR excess is dominated by a cold dust component peaking around 25 μm (Sylvester et al. 1996; Woitke et al. 2019). Mid-IR spectroscopy shows strong polycyclic aromatic hydrocarbon (PAH) emission around 6, 8 and 11 μm, but no typical silicate features (Sylvester et al. 1995; Meeus et al. 2001; Acke & van den Ancker 2004; Sloan et al. 2005; Keller et al. 2008). There exists also hot dust with T ≈ 1500 K at a separation of about 0.1 AU to the star as inferred from near-IR photometry and interferometry (e.g., Chen et al. 2018).
Scattered light from the disk was first detected for separations r ≈ 0.5″ − 1.2″ with seeing limited polarimetric imaging (Kuhn et al. 2001; Hales et al. 2006). Grady et al. (2007) measured with HST the disk brightness for r = 0.57″ − 1.3″ and found an azimuthally symmetric disk structure with a radial dependence of ∝r−3.0. The combination of imaging polarimetry and AO with VLT/NACO by Quanz et al. (2013) revealed a central cavity surrounded by a very prominent ring at r ≈ 0.18″ then a circular gap extending to about r ≈ 0.50″ surrounded by the weaker, outer disk seen previously. Subsequent imaging polarimetry confirmed this structure but also found deviations from perfect axis-symmetry, which could be caused by interactions with newly formed planets (Momose et al. 2015; Monnier et al. 2017; Pohl et al. 2017; Ligi et al. 2018; Bertrang et al. 2018, 2020; Gratton et al. 2019).
Some polarimetric measurements for the disk around HD 169142 are given in, for example, Quanz et al. (2013), Momose et al. (2015), and Monnier et al. (2017) as surface brightness profiles, which are at least qualitatively in good agreement. Also, maps, azimuthal profiles, or parameters of a well-fitting disk model are presented (Monnier et al. 2017). However, the extraction and comparison of quantitative polarimetric parameters are difficult, because the presented results are very heterogeneous and the involved point spread function (PSF) convolution effects are not described. A quite simple and well-defined polarimetric value is the ratio between the integrated polarized intensity of the disk and the total intensity of the system Qϕ/Itot = 0.41% observed for the H band by Quanz et al. (2013), but this value is not corrected for PSF smearing and polarimetric cancelation effects.
Radio-observations in the millimeter and submillimeter range provide complementary information about the disk structure. Raman et al. (2006) derived from CO line maps a disk inclination of 13° and an orientation of the major axis of the projected disk of 5°. High resolution observations in the millimeter range with ALMA show clear circular structures for the thermal emission from large dust grains in the disk midplane and for the line emission from molecular species and both can be associated with the rings seen in scattered light (Osorio et al. 2014; Carney et al. 2018; Macías et al. 2019; Pérez et al. 2019). The prominent inner ring and weaker features have also been imaged in the IR, in particular in the PAH emission bands as well as for the dust continuum λ = 8.8 − 25 μm (e.g., Habart et al. 2006; Honda et al. 2012; Okamoto et al. 2017).
Important for our study of the disk of HD 169142 is the location of the bright, narrow ring at an ideal separation for our AO observations, and the pole-on orientation providing an almost perfect azimuthal symmetry enabling the analysis of averaged radial profiles for the analysis of the disk polarization and intensity. Also useful is the well-established SED.
3. Data and data reduction
3.1. SPHERE/ZIMPOL data
The data of HD 169142 used in this work were retrieved from the ESO data archive1 and are listed in Table 1. The observations were taken with the VLT instrument SPHERE/ZIMPOL on July 9–10, 2015, by H. Avenhaus (ESO program 095.C-0404) and they are described in Bertrang et al. (2018) including a detailed analysis of the geometric and hydrodynamic structure of the disk. Our study is complementary, because we investigate the photometric and polarimetric properties of the scattering dust in the disk and therefore our data description highlights the aspects relevant to this topic. Technical details about the SPHERE instrument and the ZIMPOL subsystem can be found in Beuzit et al. (2019) and Schmid et al. (2018), respectively, or in the ESO/VLT SPHERE user manual.
Parameters for the used SPHERE/ZIMPOL polarimetric observation cycles of HD 169142.
All data listed in Table 1 are obtained with ZIMPOL imaging polarimetry in non-coronagraphic mode, with a pixel scale of 3.6 mas × 3.6 mas and a field of view of about 3.6″ × 3.6″ centered on HD 169142. Different instrument configurations were used on July 9 and July 10, and the observing conditions also changed.
Our study is mainly based on the data from July 9, 2015, for which the filters R′ (λc = 626 nm, Δλ = 149 nm) and I′ (λc = 790 nm, Δλ = 153 nm) were used simultaneously in ZIMPOL cam1 and cam2 or vice versa (Schmid et al. 2018). Part of these data were taken in the high-gain (10.5 e−/ADU) fast modulation polarimetry mode, allowing for observations without saturating the detector at the position of the bright central star. This observing strategy turned out to be most useful for our photo-polarimetry, because it provides the disk intensity and polarization signal simultaneously with the unsaturated stellar PSF in two wavelength bands. In addition, also slow modulation polarimetry was taken, which uses a low-gain (1.5 e−/ADU) and low-read-out noise detector mode, which is optimized for the detection of fainter polarization signals. The peak of the central star is saturated for these data but they trace better the structure of the outer disk because of the lower read-out noise.
A standard polarimetric measuring cycle consists of four polarimetric exposures, Q+, Q−, and U+, U−, which in turn consist of nDIT detector integration time (DIT) sub-integrations. The Stokes parameters Q and U for one cycle are obtained with the appropriate combination of exposures Q = (Q+ − Q−)/2 and U = (U+ − U−)/2 (Schmid et al. 2018). For HD 169142 a single cycle took a few minutes of telescope time and adding up many cycles yields then a polarimetric observation with higher sensitivity. The polarimetric measurements depend on the PSF quality and the measured polarization is different from cycle to cycle depending on the variable atmospheric conditions and the related AO performance. For this reason Table 1 lists the sequence of polarimetric cycles for the main data for our analysis from July 9, 2015, in detail. The atmospheric conditions for July 9 were for VLT standards less than average, with a seeing around 1.0 arcsec and an atmospheric coherence time of about τ0 = 1.5 ms.
HD 169142 was observed again on July 10, but in the very broad VBB filter (λc = 735 nm, Δλ = 291 nm) in both ZIMPOL arms and in fast polarimetry mode. The wide VBB filter doubles roughly the flux throughput when compared to the R′ or I′-filters and therefore this data set provides a higher sensitivity, but the central star is saturated. These data are not included in our photo-polarimetric analysis because the central star cannot be used as simultaneous flux and PSF reference source. The atmospheric conditions were good on July 10 with a seeing of about 0.75 arcsec and these data were used for the study of the geometric structure of the disk by Bertrang et al. (2018).
3.2. Data reduction
The data were reduced with the IDL-based sz (SPHERE-ZIMPOL) software developed at the Eidgenössische Technische Hochschule (ETH), Zurich. Basic steps include image extraction, bad pixel cleaning, bias subtraction, flat-fielding, a subtraction of the frame transfer smearing, and a calibration of the polarimetric modulation efficiency. Important for our analysis are the corrections for the differential polarimetric beam shifts, which can be easily determined from the PSF peak of the non-saturated, fast-polarization data. The star is centered in all images and the images are rotated so that north is up and east is to the left.
In addition we consider the telescope polarization and polarization position angle offset δsz of the ZIMPOL instrument as described in Schmid et al. (2018). The telescope polarization adds a fractional polarization ptel to the data with a position angle θpara + δtel, where θpara rotates with the parallactic angle of the observations so that the uncorrected, flux averaged fractional polarization of HD 169142 rotates along a circle in the Q/I–U/I-plane. The telescope polarization effects and the correction thereof are described in more details in Appendix A. We find that the sum of interstellar and intrinsic polarization of HD 169142 is p ⪅ 0.1%. This limit is more constraining than previous upper limits obtained with aperture polarimetry of HD 169142 by Yudin & Evans (1998) and Chavero et al. (2006). According to Schmid et al. (2018) we also consider a polarization position angle offset introduced by the half-wave plate HWP2 and apply for the final Q and U images an extra correction (formulas for Qc4, Uc4) with δsz = +4.5° and +5.8° for the R′ and I′-filters, respectively.
The primary data product of the reduction yields for each polarization cycle four images: the total intensity for the Q-measurement IQ = I0 + I90, Stokes Q = I0 − I90 and the equivalent parameters IU = I45 + I135, U = I45 − I135 for Stokes U. In principle it should hold that: IQ = IU = I.
We use for the polarization images of the disk the azimuthal Stokes parameters Qϕ and Uϕ with respect to the central star. This approach for describing the polarization of centro-symmetric scattering geometries was initially introduced by Schmid et al. (2006) with radial Stokes parameters Qr, Ur, which are related to azimuthal parameters by Qϕ = −Qr and Uϕ = −Ur. For circumstellar scattering as for disks the induced polarization is essentially azimuthal or in Qϕ direction, while the Uϕ signal is very small |Uϕ|≪|Qϕ| in particular for axisymmetric disks seen close to pole-on. The polarized flux  is therefore essentially equal to ≈Qϕ, so that Qϕ can be used as polarized flux, with the advantage of avoiding bias effects from noisy observational data in the “traditional” formula for p ⋅ I using the square-root of the sum of squares (see Simmons & Stewart 1985). For HD 169142 the difference between p ⋅ I and Qϕ is small for the inner bright ring but for the faint, noisy outer disk the upward bias for the integrated polarized flux p ⋅ I is on the order of a factor of two as illustrated in Schmid (2021) and therefore not useful without a correction procedure that takes this strong bias effects into account. The azimuthal polarization is related to Q and U according to Qϕ = −Qcos(2ϕ)−Usin(2ϕ) and Uϕ = −Qsin(2ϕ)+Ucos(2ϕ), where ϕ is the position angle with respect to the central star measured from north over east (see also Monnier et al. 2019).
For Fig. 1 all observations from 2015 listed in Table 1 were normalized considering the different DITs, pixel gain values (slow versus fast polarization mode), and filter throughputs and then median-combined. The 2018 data are not included because significant disk movements occurred in the three years (Bertrang et al. 2020).
4. Analysis
4.1. Geometry of HD 169142
The median Qϕ polarized flux image of HD 169142 in Fig. 1 is used for the analysis of the disk geometry. We focus our analysis on deviations from axisymmetry for the inner and outer ring. Figure 2 shows the azimuthal dependence of the radially integrated polarization flux Qϕ, Σ(ϕ) and the separation of the Qϕ flux peak rmax(ϕ) for the inner and outer ring.
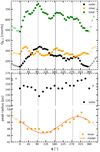 |
Fig. 2. Azimuthal dependence of the polarized flux from the dust disk around HD 169142. Top: radially integrated polarized flux Qϕ(ϕ) for 8° wide angles for the inner (30 − 60 px) and outer (110 − 300 px) ring and the total disk (30 − 300 px) as a function of azimuthal angle ϕ. Bottom: separation rmax(ϕ) of the Qϕ peak flux rmax = maxr(Qϕ(r)) in 20° angle intervals for the inner and outer dust ring. The red curve is a simple fit of a circle with a 2.5 px center offset (1 px = 3.6 mas). The major (darker) and minor axis position are marked with vertical gray lines. |
Radio observations of molecular lines for HD 169142 provide kinematic disk maps that yield a major axis orientation of 5° and an inclination of 12.5° (Raman et al. 2006). Brightness peaks in the disk move on Keplerian orbits in clockwise direction around the star (Ligi et al. 2018; Gratton et al. 2019) indicating in combination with CO maps that the northern side is moving away from us and the eastern side is the near side of the disk. We adopt these geometric parameters and the positions of the major and minor axes are also indicated in Fig. 2.
The polarized flux (or azimuthal polarization) Qϕ as a function of azimuthal angle is calculated from radial integrations of all counts
in azimuthal angle intervals of Δϕ = ϕ2 − ϕ1 = 8°. The radial integration goes from 30 px to 60 px for the inner ring, from 110 px to 300 px for the outer ring, and from 30 px and 300 px for the entire disk. The resulting Qϕ, Σ(ϕ) curves are shown in Fig. 2. We measure roughly the same amount of polarized flux for the two rings. However, the intrinsic Qϕ-flux of the inner ring is significantly higher after the consideration of observational bias effects as will be described in Sect. 4.3.
The shape of the Qϕ, Σ(ϕ)-curves is essentially identical to the J-band (λ = 1.26 μm) measurements of HD 169142 presented in Pohl et al. (2017) and also described in Bertrang et al. (2018) for the VBB filter. For the inner ring we find deviations σ ≈ 9% from the mean  count units with maxima at ϕ ≈ 30°, ϕ ≈ 90°, ϕ ≈ 190° and ϕ ≈ 330°. The motion of these maxima is described in Ligi et al. (2018) and Gratton et al. (2019).
The outer ring shows stronger azimuthal variations in Qϕ, Σ(ϕ) with a σ ≈ 22%, in particular a bright eastern side of the disk, which is about 1.35 times brighter than the western side and with the peak value more than twice as bright than the strong minimum in the north. We notice an anti-correlation between the brightness of the inner ring and the outer disk, which could be a result of shadowing of the outer disk by the inner ring.
As second parameter, we derive the separation of the polarization flux peak rmax(ϕ) = maxr(Qϕ(r, ϕ)) for the inner and outer ring from the central star as a function of azimuthal angle ϕ. The values are shown in Fig. 2, which were derived from smoothed mean radial profiles Qϕ(r) for Δϕ angle intervals with widths of 20°.
The mean separation for the inner dust ring is 47.2 ± 1.7 px (0.170″ ± 0.006″) and for the outer ring 145 ± 7 px (0.522″ ± 0.026″). The inner ring shows for rmax(ϕ) a systematic deviation from the mean, which looks like a sine-wave with an amplitude of 2.5 ± 0.3 px. This is essentially equivalent to a circle with a center offset of 2.5 px in direction ϕ = 300° ±10 from the star as illustrated in Fig. 2 by the sine fit curve. The outer ring shows also a smaller separation for the eastern side with rmax ≈ 135 px and a larger separation ≈150 px for the western side. These values are not accurate because the determination of the location of the flux peak is rather uncertain for the outer ring. Our determination of the ring radii for HD 169142 agrees with previous measurements of Bertrang et al. (2018).
The smaller ring separation toward the east and the enhanced brightness of the eastern side are expected features of a tilted disk with the eastern side closer to us. The enhanced brightness can be attributed to enhanced forward scattering and the smaller separation is a tilt projection effect for the illuminated surfaces above the disk midplane. However, the two effects are small because the disk inclination is only i = 12.5° and they are partly masked by small deviations from axisymmetry of the intrinsic disk structure.
Circumstellar dust rings around HD 169142 are also seen in continuum observation in the millimeter range, which represent the distribution of the large dust grains in the disk midplane. For example the maps of Pérez et al. (2019) or Macías et al. (2019) show rings with only small deviations from circles. The radius of the inner ring is in millimeter wavelengths around 0.22″, which is substantially larger than the radius measured for the inner ring in scattered light. This radius difference between scattered light and thermal light in the millimeter range is often seen in transition disks (e.g., Villenave et al. 2019), and this is explained by the accumulation of large grains in the gas pressure maximum of the ring, which is, in transition disks, farther out than the scattered light emission from the inner wall. For the outer ring of HD 169142, the millimeter-wave ring has a radius of about 0.53″, which coincides well with the peak flux radii derived for the scattered light.
4.2. Radial polarization profiles
4.2.1. Observed mean radial profiles for the polarized flux
Because the disk in HD 169142 is very close to rotational symmetric we can use azimuthally averaged radial polarization profiles Qϕ(r) for our analysis. This yields a much improved sensitivity, simplifies significantly the analysis, and still provides measurements that represent the properties of the disk well at all azimuthal angles.
We compile in Fig. 3 the observed radial distribution of the polarized flux Qϕ(r) for R′- and I′ bands out to r = 1.7″. These averaged (red and blue) profiles include all data from July 9, 2015, also the saturated slow polarimetry data, considering the correct weighting of frames taken with different DITs and polarimetric detector mode (gain factors 1.5 and 10.5 e−/ADU). The curves  are normalized for each band to the total intensity of the star as measured for the fast polarization data in an aperture with a diameter of 3″ corresponding to a radius of 416 pixels. The slow polarimetry data reduce significantly the noise further out and therefore this “total” average is ideal to measure
  for the weak, outer disk r > 0.36″. Because of the saturation of the star in the slow polarization data the scale of these images is adjusted to the normalized, and non-saturated fast polarimetry data. The final radial curves in Fig. 3 were smoothed over 0.018″ (5 px) for the outer disk because of the low signal and over 0.07″ inside because of the noise from the stellar PSF peak. The observed peak surface brightness in the mean radial profiles differs by more than a factor of ten between inner ring and outer disk with
  and 0.098 for the I′ band and 1.5 and 0.073 for the R′ band in units of 10−7 (relative to the total flux of the star), respectively.
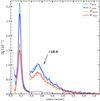 |
Fig. 3. Mean radial profiles for the azimuthal polarization |

We notice strong temporal changes in  for the inner ring caused by PSF variations. Figure 3 includes as illustration for these variations averaged profiles for a series of four consecutive cycles 19 to 22 (Table 1) taken under better atmospheric conditions and therefore with better PSFs. For the inner ring the difference in Qϕ is clearly visible, while the extended outer disk is much less affected.
4.2.2. Impact of the PSF variability
We investigate the dependence of Qϕ on the temporal PSF variability with the fast polarimetry data, because they provide the disk profile and the instrumental PSF simultaneously. The observed  = Qϕ(r)/Itot-profiles of the inner disk vary strongly from cycle to cycle.
Figure 4 shows, for each fast polarimetry cycle and both color bands, the variations in the peak flux in the stellar PSF  and the peak polarization
  polarization for the inner disk ring around r = 0.18″ for the R′ and the I′ band. All these values are again normalized to the total star intensity Itot (HD 169142 flux) in a large aperture that is not affected by atmospheric seeing variations. The normalized peak flux
  is a simple measure of the Strehl ratio of the data (see Schmid et al. 2018). As the HD 169142 observations were taken with quite strong atmospheric turbulence, the PSF
  shows temporal variations of up to a factor of about four (max/min). Obviously the observed disk peak polarization
  is strongly correlated with variation of up to a factor of about two. The R′ and I′ band data behave very similar, because they were taken strictly simultaneously with the two arms of ZIMPOL. In Appendix B we show two-dimensional PSFs and variations and compare the achieved quality.
 |
Fig. 4. Cycle-to-cycle variations in the normalized PSF peak intensity |


The variability is investigated in more detail in Fig. 5, which shows very well-defined correlations between the integrated polarization  for the inner dust ring and the PSF peak flux. This shows how well the polarization flux measurements are correlated with the instantaneous AO performance.
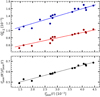 |
Fig. 5. Correlations with the PSF peak quality |


The color ratio of the normalized PSF peak flux 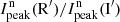 in Fig. 5 shows a positive correlation with PSF quality (
 ). This indicates that the R′-band PSF depends stronger on the observing conditions than the I′ band because the atmospheric turbulence affects shorter wavelengths more.
Of course, measuring such a tight correlation in two color bands for the variations in the stellar PSFs or for the disk polarization is only possible because the data are taken strictly simultaneous in the ZIMPOL double beam imaging polarimeter. This is very useful for an accurate measurement of the color of the disk.
4.3. Disk polarization model
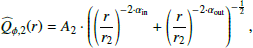
An accurate determination of the intrinsic disk polarization requires an appropriate consideration of the smearing and polarization cancelation effects for our data. For this, we construct a model simulating the intrinsic disk polarization for HD 169142 that reproduces the observed polarimetric signal quite well if convolved with the corresponding PSF available from the simultaneous, unsaturated intensity frame. Our model is an azimuthally averaged radial profile for which we selected after various tests a two-component model  . The inner component is described by a narrow Gaussian disk ring
with peak radius r1, peak amplitude A1, and width σ1. The outer component is more extended and can be described by two power laws
with amplitude A2, approximate peak radius r2, and inner power law slope ∝rαin with αin > 0 and outer slope rαout with αout < 0. We then searched for the  model parameters that best fit the observations after convolution with the PSF using a forward modeling method based on approximate Bayesian computations (e.g., Sisson et al. 2018). This is achieved in two steps, first determining the best parameters for the inner disk ring and then for the outer disk, because these two polarization components are essentially detached.
In the forward modeling a large range flat prior was used. Two-dimensional images for Stokes  and Stokes
  were generated for each set of geometric parameters assuming a scattering polarization in strictly azimuthal direction. Then the
  and
and  frames were convolved with I of the specific observation to simulate the same observing conditions. The I intensity image is a good approximation for the PSF, as more than 97% of the intensity is from the star and less than 3% from the disk. From the convolved Stokes Q and U images a convolved azimuthal polarization image Qϕ and the corresponding, azimuthally averaged radial profile Qϕ(r) was calculated. The model simulations for two-dimensional, non-convolved
  ,
,  ,
,  model and convolved Qϕ, Q, U simulation are shown in Fig. 6 for the R′ band. The small deviations from axisymmetry in the simulations are introduced by the observed PSF used for the convolution.
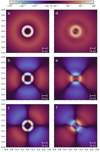 |
Fig. 6. Comparison of the Stokes |


The quality of the calculated profile Qϕ(r) simulation was then evaluated with a comparison with the observed profile Qϕ(r) using as distance metric the sum of the squared residuals and the best solution was adopted. For the optimization we selected the R′ and I′ data from the fast polarimetry cycles 19–22 (illustrated in lighter color in Fig. 3), which were obtained under the best atmospheric conditions. These data provide the highest spatial resolution and therefore constrain best the ring width σ1 ≈ 5 px (FWHM ≈ 11.8 px or 43 mas) and amplitude  , while the best ring radius r1 = 47.5 px (171 mas) depends not so much on the data quality.
The derived flux maxima  should be considered as lower limit and the obtained σ1 values as upper limits for the inner disk ring. Assuming a narrower ring with a higher peak leads to convolved inner ring images that are essentially indistinguishable. In addition, the ring width of the observed azimuthally averaged profile Qϕ(r) is slightly larger than the width of the ring for a particular section in the two-dimensional image, because the ring is not exactly centered on the star and slightly distorted so that the azimuthal averaging increases the width. Therefore, the indicated FWHM of 43 mas for the width of the inner ring is an upper limit for the intrinsic model. Of course, a model with a narrower ring would have an enhanced
  parameter so that the total ring flux
  is preserved. The
  model parameter results for R′ and I′ band are listed in Table 2.
Disk model parameters for the normalized polarized flux  for the R′ and I′ band, where fluxes are expressed relative to the total R′ and I′ intensity of the HD 169142 system.
The convolution of the bright inner ring with a SPHERE/ZIMPOL PSF yields in the radial profile a weak but significant maximum around r ≈ 150 px (inner ring radius plus ≈100 px). This artifact is caused by the PSF speckle ring, which is related to the AO control radius of about 100 px for the R band and slightly larger for the I band. The observed peak surface brightness of the outer disk  is of order 4.5 % of the inner ring. However, the observed integrated polarization
  is around 75 % of the inner disk. About 1/6 of the observed
  signal at the position of the outer ring is caused by this PSF convolution artifact from the inner ring. This effect is taken into account in our analysis.
The forward modeling search of the intrinsic parameters of the outer disk is then carried out in a second step keeping the above derived parameters for the inner disk fixed. The found model parameters for the outer disk are also given in Table 2. One should keep in mind that the outer disk deviates significantly from rotational symmetry and therefore the obtained results represent the azimuthal average. The parameters also depend on each other. A slightly smaller model radius r2 leads consequently to a steeper αin value and vice versa. In general the uncertainty for the fitting parameters of the outer disk is larger.
The obtained intrinsic radial profiles  from the disk polarization model is compared in Fig. 7 with the observed profiles
  for the R′ and I′ bands. The differences between the curves are caused by the PSF smearing and cancelation effects, which are obviously very strong. The observed peak polarization surface brightness for the inner disk for cycles 19–22 is reduced by factors of
  and 0.28 for the R′ and I′ bands, respectively. The effect is less dramatic for the outer disk, where these ratios are 0.7 for both filters.
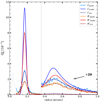 |
Fig. 7. R′ band (red) and I′ band (blue) radial profiles for the azimuthal polarization |


An important quantity for the characterization of disks is the integrated polarized fluxes of the scattered light normalized to the total system intensity flux. For this we integrate the  profiles
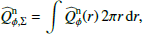 (1)
(1)
for the entire disk, but also for the inner disk ring  and the outer, more extended disk
  . The resulting values are given in Table 2. Key numbers are the polarized reflectivity, the ratio between polarized flux and total system flux, which is
  for the R′ band and 0.0055 for the I′ band. Thus, the dust in the disk appears “reddish” in polarized flux, because it reflects more efficiently in the longer wavelength I′ band when compared to the R′ band. The same color effect is also obtained for the bright inner ring and the outer extended disk.
The integrations for  and
and  yield also the relative contributions of > 70% for the inner, narrow ring and ≈25% of the outer extended disk to the total polarized flux of the disk. This splitting is significantly different from the observations shown in Fig. 2, which yield about
  . The reason is the smearing and polarimetric cancelation, which reduces the integrated polarization signal of the compact ring by a factor of about 2.5 (I′) to 3.3 (R′), while the reduction for the extended outer disk is less dramatic with a factor of 1.3 (I′) or 1.4 (R′). Not considering the convolution effects would in our case, for the HD 169142 disk observed with SPHERE/ZIMPOL, underestimate the total polarized flux by about a factor of 1.9.
4.4. Simulation of observational variation
As a check of our analysis for cycles 19–22, we simulate the cycle-to-cycle variations for the observed polarized flux of the inner ring described in Sect. 4.2.2. For this we convolve the derived disk polarization model with the PSF of each cycle and construct the same plot as for the observations (5), but now for the simulated  polarized disk signal variations in Fig. 8. The agreement with the observations is excellent for the relative level of the R′ and I′ band data, but also for the slope of the correlation between
  and the PSF peak flux
  . The mean of the residuals between the convolved model and the observations is essentially zero with a standard deviation of about σ ≈ 7%.
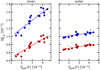 |
Fig. 8. PSF-convolved polarization model flux |


The same analysis for the outer disk gives also a very good agreement. The slope of the  –
– correlation is much shallower, because the PSF variations have a much smaller impact on extended structures. The observed
  varies only by about a factor of 1.2 between the cycles with the highest and lowest quality PSF. For the inner disk, the corresponding ratio is about 2.
4.5. Extracting the disk intensity signal
The intensity images are strongly dominated by the variable PSF of the star, including an extended speckle halo and narrow features from the instrument as described in Schmid et al. (2018). The disk intensity Id is much weaker and cannot be recognized by eye in the image, but we know accurately the position of the disk from the polarization signal Qϕ(r), which defines the expected intensity distribution Id(r) quite well.
HD 169142 is a favorable target to extract the disk intensity with SPHERE/ZIMPOL observations, because this disk has a bright, narrow, ring located at r = 47 px, far enough from the star to be well separated, but also clearly inside the strong speckle ring at r ≈ 100 px (control radius of AO system). For the outer, extended disk there is not much hope that the disk intensity can be detected in our data. The observed peak polarization at r = 47 px is 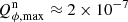 , where the intensity of the stellar PSF is about 100 times stronger. If we assume a fractional polarization in the range p = Qϕ/I ≈ 10 − 50% for the scattered light, then the expected disk intensity is only a few to several percent of the stellar PSF intensity at this location. The extraction of such a weak disk intensity signal is difficult because of the described PSF variations.
For the extraction, we assume that the radial profile of the disk intensity is just a factor γ = 1/p stronger than the polarized intensity Id(r, γ) = γQϕ(r). This assumption disregards a possible radial dependence p(r) for the inner ring what is well justified because the radial structure of the inner ring is just barely resolved.
We fit the observed total intensity profile Itot(r) with a model for the stellar PSF profile and the disk intensity Id(r, γ) and determine the optimal scaling factor γ:

The central peak of the stellar PSF profiles show in our data essentially no Airy rings (see Appendix B) partly because of the wide passbands Δλ ≈ 150 nm of the used R′- and I′-filters, and partly because of the limited AO-performance. Therefore, we can approximate the stellar PSF in the range of the inner ring, from r = 0.108″ to 0.252″, by a power law function and determine the best fit parameters I0, α and γ, which minimize with a Markov chain Monte Carlo (MCMC) method the sum of squared residuals between observed and fitted profile ∑R2 = ∑(Itot, fit(r)−Itot(r))2. Best parameters I0, α and γ, were calculated for each cycle, the means for all cycle, or several subsets of cycles, but always separately for the R′ and I′ bands. All these determinations give very consistent results for the γ parameter and we derived a best γ parameter based on weighted least squares, giving more weight to the best cycles considering the ∑R2 error. As MCMC method we use a own implementation of the simple and commonly used Metropolis-Hastings algorithm as described in Mackay (2003) with a large range flat prior, normal distributed step size and an acceptance of a point if exp(−errnew + errold) is larger than a random number between 0 and 1.
Figure 9 shows the resulting radial profiles for Id(r) for the R′ and I′ bands, the observed intensity profiles Itot(r) and the PSF power law fits I⋆(r). The two profiles for Itot(r) and I⋆(r) in the upper panels are almost indistinguishable and the difference caused by the disk intensity Id(r) can hardly be recognized. The intensity differences between Itot(r) and I⋆(r) are plotted in the lower panel on a much finer intensity scale, together with the Id(r, γ) = γQϕ(r) curve and the fit residuals R. The obtained γ parameters are 3.9 for the I′ band and 4.3 for the R′ band, but these values are subject to a systematic bias because the PSF convolution effects for the intensity and polarization are different.
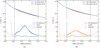 |
Fig. 9. Azimuthally averaged intensity profiles of HD 169142 showing the difference between the stellar PSF and the disk. Upper panels: radial profiles for the I′ band (left) and the R′ band (right) for the observed intensity Itot(r) and the best power-law fit for the stellar PSF I⋆(r). Bottom panels: profiles for the best fitting disk intensity model Id(r) = γQϕ(r), together with the difference Itot(r)−I⋆(r) and the fit residuals (dashed lines). The MCMC fit optimization range is between 30 px (0.108″) and 70 px (0.252″), as indicated by the vertical lines. |
As shown in Fig. 10 the convolution preserves the integrated disk intensity but smears the disk signal and produces a “smearing” halo with a substantial flux level inside and outside the disk ring. This is different for the Qϕ-profile, which is based on the Stokes Q and U images composed of positive and negative quadrants. The smearing by the PSF convolution leads to polarization cancelation of the “smeared” halo signal for Q and U and the disk integrated polarized flux Qϕ is reduced. This PSF convolution cancelation effect is demonstrated in Fig. 6 with two-dimensional images. The dotted line in Fig. 10 is the difference between the convolution of the normalized intensity profile 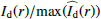 and the convolution of the normalized polarization profile
 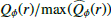 , where we assumed that both normalized profiles are identical. The difference is large, but our disk intensity extraction procedure can only capture the narrow radial disk bump (purple area in Fig. 10). The radially extended “smeared intensity halo” below the solid purple line and outside of the radial fitting range indicated by the vertical lines cannot be disentangled from the much stronger, stellar PSF profile fitted by a power law. We investigated our procedure and find that the fitting of a scaled γQϕ(r) profile to the observed disk intensity bump in the Itot(r) profile accounts only for the purple area in the convolved profile for the normalized intensity bump
  . The fitting of the stellar PSF by a power law gives the shape of the solid purple line. This underestimates the flux of the disk intensity bump with respect to the bump for the polarized intensity
  of C(I′) = 1.075 and C(R′) = 1.068 and we apply these small corrections
  and obtain convolution corrected γ factors of
  and
and  .
.
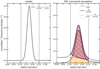 |
Fig. 10. Relative PSF convolution differences for the radial profiles of the disk intensity |


The derived  parameters give the intrinsic fractional polarization
  listed in Table 3. The uncertainties for these parameters follow from the weighted least square determination of the many different PSF-fits described above. The relative uncertainties for
  or
or  are smaller (≈15%) for the I′ band than for the R′ band (≈25%) because the PSF quality is better and therefore the intensity extraction more accurate for the I′ band. The resulting fractional polarizations for the inner disk ring are
  and
and  . This is compatible with no color dependence for the fractional polarization
  . For the relative intensities
  we consider the small difference between the total system intensity Itot and the intensity of the central, unresolved object I⋆ = Itot − Id composed of the stellar intensity and the expected scattered intensity of the hot dust.
Model parameters for the scattered intensity for the HD 169142 disk:  parameter, fractional polarization
  , normalized disk intensities
  measured for the inner ring and for the outer disk and the entire disk adopting the
  values from the inner ring.
The resulting intrinsic disk intensity  yields roughly the same reddish R′−I′ color as for the polarized flux, but the quite large uncertainties from the γ parameter determination makes this color determination inconclusive. However, we find a correlation between the many γ(R′) and γ(I′) determinations of simultaneous observations (same cycle). If we determine for a given cycle a relatively low or high γ value for the R′ band, then we also find typically for the I′ band a low or high value, respectively, and we derive a Pearson correlation coefficient of p = 0.71. Because of this correlation the uncertainties for the wavelength dependence or for the color of the fractional polarization
  and the relative disk intensity
  are smaller than what one would expect if the indicated errors of the R′ band and I′ band are treated as independent measurements. Therefore, we can restrict the wavelength dependence of the fractional polarization for the inner narrow ring to ratios of about
  and the intensity color
  or expressed in magnitudes
  mag. Thus we also find a red color for the scattered intensity from the inner bright disk ring, relative to the color of the star.
The scattered intensity for the outer disk or the entire disk can be guessed from  adopting just the derived
  from the inner disk ring as approximation for the entire disk. This is a questionable assumption that should be verified in future with measurements. The indicated uncertainties for the guessed outer and total disk values disregard this problem.
Azimuthal variation in the fractional polarization. We tried to derive the azimuthal dependence of the scattered intensity of the inner ring and estimate the fractional polarization for different disk regions, using the same intensity extraction method as for the azimuthally averaged profile. For this we selected four azimuthal wedges with Δϕ = 45° centered on the major (ϕ = 5° ,185°) and minor (ϕ = 95° ,275°) axes. We analyzed the mean profiles of the fast polarization R′- and I′-band data, but unfortunately the ∑R2 errors were quite large and as a consequence, only qualitative estimates can be made. For the following we assume that the azimuthal dependence of the scattered polarized flux Qϕ(ϕ) is small because we found in Sect. 4.1 only small variations (σ = 9%).
For the northern and southern disk sections, along the major axis, the derived intrinsic fractional polarization  is a few percent larger than the weighted mean of about 23% (Table 3). For the eastern side (95 ± 22.5°) the errors were the smallest, as there was significantly more scattered intensity
  and the estimated
  is clearly lower at a level of about
  %. On the western side, the intensity signal is difficult to extract and the uncertainty is larger, but it seems that p is less than the mean but larger than on the eastern side.
The enhanced scattering intensity on the eastern side, which is also the nearer side for the HD 169142 disk, could be explained by a forward peaked dust scattering phase function. But because the inclination of this disk is small the scattering phase function effects are weak and could be masked by geometric deviations from axisymmetry, which are small but present in this disk. SPHERE/ZIMPOL data taken under better observing conditions should allow more accurate extractions of the disk intensity signal and provide more accurately the azimuthal dependence of the fractional polarization.
4.6. Comparison of the reflected light with the thermal emission
The reflected intensity and polarization from the disk in HD 169142 can be compared to the measured IR-excess, which is the result of light absorption and thermal reemission by the same circumstellar disk structures. These two emission components are therefore strongly related and Garufi et al. (2017b) finds for transition disks (Meeus group I disks) a correlation between far-IR excess and polarized light contrast of F(fIR)/Ftot ≈ 35 × Qϕ/Itot. This relation is based on very heterogeneous literature data for Qϕ indicating that the correlation must be strong, but it is probably also not accurate. In Garufi et al. (2017b) the uncertainty in the adopted polarization data, as well as the uncertainty in the derived IR excess values are not discussed. For HD 169142 the far-IR excess in Garufi et al. (2017b) is 18.2%, while Sylvester et al. (1996) report FfIR/F⋆ = 8.8% and Seok & Li (2016) estimate ≈24%. In addition there exist detailed model fits to the SED of HD 169142 (e.g., Honda et al. 2012; Bertrang et al. 2018; Woitke et al. 2019), but these studies do not provide the radiation budgets for the different dust emission components. We determine the IR excess again in this work because of the large discrepancy in the available values.
4.6.1. Spectral energy distribution
The SED of HD 169142 is fitted by a stellar source, a near-IR excess from hot dust, PAH emission lines in the 6–12 μm region, and a strong λ > 10 μm excess at longer wavelengths, which is modeled as in Honda et al. (2012), Seok & Li (2016), and Bertrang et al. (2018) by the combined thermal emission of warm dust from the inner ring and cold dust form the outer disk.
For our determination we took the data from the DIANA database (Dionatos et al. 2019) and their resulting model fit, which matches excellently these data points. We interpolated the points to obtain an SED with constant d log λ steps with a step size of 0.01, which is about the average spacing of available data points.
For the stellar component we fitted the stellar model and the reddening correction of AV = 0.06 from Woitke et al. (2019), where the star is a PHOENIX spectrum with Teff = 7800 K (Brott & Hauschildt 2005). Woitke et al. (2019) used 145 pc as distance to HD 169142 instead of the newer GAIA DR2 estimate of 114 pc and therefore we introduce the fitting factor A0 to adjust the star spectrum to the rescaled SED. For the reddening correction we use the model from Fitzpatrick (2004).
The IR emission is fitted by three Planck functions, Bλ(Ax, Tx), x = 1 − 3, for the hot dust, for the inner ring and the outer disk, each with the two free parameters Ax for the flux scale and Tx for the temperature. For the determination of the seven free model parameters we applied a Metropolis-Hastings MCMC (Mackay 2003) procedure with a large range flat prior, normal distributed step size, and an acceptance of a point if exp(−errnew + errold) is larger than a random number between 0 and 1. The error function is the sum of squared residuals with an increased weighting for the low flux values (in units of W/m2) at longer wavelengths. The wavelength range of the PAH features between 6 − 12 μm was ignored for the fitting. We used the difference between the observed strong spectral features in this wavelength range and the Planck fit as measure for the PAH flux FPAH in HD 169142.
An important additional constraint is included in the fitting procedure for disentangling in the SED the contributions of the inner, narrow ring and the outer extended disk. The resolved mid-IR imaging data of Honda et al. (2012) show for the wavelengths of 18.8 μm and also 24.5 μm that the inner ring dominates strongly the flux at these wavelengths. Therefore, we included in the fitting a corresponding penalty factor for this wavelength region.
The resulting fit to the SED is shown in Fig. 11 and the corresponding integrated flux values and black-body temperatures are listed in Table 4. The integrated flux of the PAH features in the mid-IR is calculated from the residuals between data and fit in this spectral region (5.5–15 μm). We use in Table 4 and the SED model the symbol Fstar for the integrated flux of the stellar SED, which includes the stellar emission and the scattered stellar radiation from the hot dust and the disk. The symbol F⋆ is used for the stellar flux corrected for the scattered (stellar) radiation from the disk, or the emission of the star plus only the scattered stellar light from the hot dust. This is equivalent to the stellar intensity  used in the imaging observations for the unresolved central object that includes also the emission of the star and the scattered emission of the hot dust.
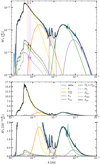 |
Fig. 11. Detailed SED model fit for HD 169142. Blue represents our merged data fit, black our total model, yellow the radiation of the star, orange the hot dust close to the star, green the warm inner ring, purple the cold outer disk, and gray the PAH estimate. The dots are our measurements of the dust reflection and the dashed lines our estimates for the spectral distribution of the scattering. |
Of course, our dust model based on just three single-temperature black-body components is strongly oversimplifying the complex emission properties and temperature distribution of the emitting dust. Nonetheless, we get a very good fit to the SED and can accurately quantify the flux from the individual spectral components. The radiation budget in Table 4 yields a total IR excess of FIR, tot/F⋆ = 0.339 where FIR, tot includes the four SED contributions of the hot dust in the near-IR, the inner ring and outer disk in the mid- to far-IR range and the PAH-emission features (FIR, tot is the whole SED minus Fstar).
The extended disk resolved with scattered light imaging is responsible for the thermal emission from about 10 μm to 1 mm and we obtain for this part of the SED without PAH an excess of FfIR/F⋆ = 0.175 in good agreement with the value 0.182 given in Garufi et al. (2017b). The value FfIR/Fstar = 0.088 from Sylvester et al. (1996) is much lower probably because only the less accurate far-IR data points from the IRAS satellite were available at the time of that work. Seok & Li (2016) focused their model mainly on the PAH-features in HD 169142, but they also give an overall SED fit that (slightly) underestimates the data points in the visual and near-IR, which also underestimates Fstar; therefore, the resulting relative IR excess (FfIR/Fstar ≈ 0.24) is probably higher than our value and the result from Garufi et al. (2017b).
For the individual dust components F/F⋆ our obtained relative values yield for the hot 14.8%, warm 14.4%, cold 3.1% and PAH 1.6% spectral dust components. The corresponding values from Seok & Li (2016) for the hot ≈12.7%, warm ≈16.4%, cold ≈7.8% and PAH ≈4.1% components show a quite good agreement for the strong hot and warm dust components, but they obtained clearly higher values for the PAH features and the cold dust component. For the PAH emission our simple estimate is not considering spectral regions with low PAH flux and therefore the determination of Seok & Li (2016) should be more accurate. For the cold dust, the fit of Seok & Li (2016) overestimates clearly the data points in the submillimeter range and this could explain partly the discrepancy with our fit results (see below). Overall, we conclude that our simple dust model fit using three black body components provides good values for the energy budget for the hot and warm dust and probably also for the cold dust.
Very interesting for the investigation of the light scattering and light absorption by the dust in the disk of HD 169142 is the thermal IR emission from the warm and cold dust components, which correspond to the narrow ring and the outer disk components seen in scattered light. The “Planck curve fitting procedure” gives a ratio of Fin/Fout ≈ 4.6 ± 1.8 between these two thermal components. However, the formal fitting uncertainties from Table 4 disregard errors introduced by our use of simple Planck-curve models. The flux Fin for the inner disk ring seems to be quite reliable, because it must fit the emission peak around λ ≈ 25 μm according to the thermal IR imaging of Honda et al. (2012). However, the flux of the “cold” component and therefore the ratio Fin/Fout depends strongly on the adopted spectral shape for the dominant “warm” component. The model of Seok & Li (2016) gives a much lower ratio of Fin/Fout = 2.1 by calculating more sophisticated spectral shapes for the SEDs of the warm and cold dust, but their fit for the cold dust overestimates the emission in the submillimeter range and underestimates the flux at 7 cm, but all these data points at λ > 200 μm are not relevant for the energy budget (see Fig. 11). One may wonder how much the derived cold dust flux Fout/Fstar would change in a detailed model like the one from Seok & Li (2016) if the weights for the data points are optimized for the determination of the energy budget. Considering these points we extend the uncertainty range from the black body fit for the flux ratio between the warm and cold dust components to Fin/Fout ≈ 2 − 6.4. This is similar to the ratio in scattered light between the inner narrow ring and the outer disk, where we derive for the I′ band a value of  (Table 3) for the intrinsic, integrated dust intensities. This indicates that the ratio between thermal and scattered flux of the dust in the disk is roughly similar for the warm, inner ring and the cold outer disk, but we may suspect from the ratios derived in this work that the scattering with respect to the thermal emission is more “efficient” for the outer disk.
Finding significant differences between scattering and absorption could be very important for the characterization of the dust. For example, it is expected that forward scattering dust would produce a larger differences in the reflectivity between a steep inner wall illuminated close to perpendicularly, when compared to a flat disk surface illuminated under gracing incidence. This difference would be smaller for isotropically scattering dust as expected for small dust grains. Alternatively, a reflectivity change between inner and outer disk could also point to a radial evolution of dust particles because of the presence of an ice line. More accurate far-IR SED measurements or spatially resolved observations would be extremely interesting for such detailed investigations of the dust reflectivity.
4.6.2. Ratios between scattered and thermal radiation components
The observed scattered and thermal radiation from the disk is essentially produced by the same dust in the surface layers of illuminated disk regions. The relative strength of these two emission components can therefore be used to investigate the single scattering albedo ω of the dust particles from the normalized scattered flux and the fractional IR excess

or from the equivalent ratios for the normalized polarized flux

These Λ ratios based on observable quantities can be considered as a measure for the disk reflectivity ℛ ≈ Id,Σ/I⋆ or equivalent for the reflected polarization and the normalized disk absorption 𝒦 ≈ FIR/F⋆ or
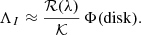
The disk reflectivity ℛ is a function of the wavelength-dependent dust scattering albedo ωλ and therefore an estimate of ℛ is only representative for the observed wavelength. The absorption 𝒦 derived from the normalized thermal emission represents a wavelength integrated mean of the absorbed radiation by the dust particles in the disk. Existing Id, Σ/I⋆ data suggest that protoplanetary disks show often a higher reflectivity for longer wavelengths (e.g., Mulders et al. 2013; Stolker et al. 2016; Hunziker et al. 2021).
The Λ ratios depend also on the disk geometry, certainly on the disk inclination, the separation and structure of strongly illuminated disk regions, the distribution of unresolved absorbing and scattering hot dust near the star, and probably other factors that are not well defined and which are lumped together in the function Φ(disk). With model calculations and measurements of the Λ ratios for many disks it should be possible to constrain the Φ(disk) term so that the Λ ratios provide useful information about the scattering and absorption properties of the dust particles in the disk. In addition, we may gain insights about the impact of the hot dust by comparing Λ ratios for disks with strong and weak near-IR emission from hot dust.
A first study of the ratio Λϕ between polarized scattered radiation and thermal radiation from circumstellar disk was carried out by Garufi et al. (2017b) based on literature data. They found for transition disks a well-defined average value of about 2.9%, or log Λϕ = −1.54 dex although with a quite large scatter and unclear measuring uncertainties. Our study on HD 169142 provides values of log Λϕ = −1.60 (R′) and −1.49 (I′) with a much improved precision of about ±0.06 dex.
Table 5 summarizes the Λ double ratios following from the result of previous sections (Tables 2, 3, and 4). Separate values are given for the R′ and I′ band and for the bright, inner ring, the extended outer disk and the total disk. The most accurate parameter are obtained for the double ratio Λϕ between polarized flux and the IR excess. This double ratio is larger for the I′ band when compared to the R′ band, mirroring the derived color dependence of the normalized polarized flux (Table 2). The Λϕ parameter is about 1.65 times larger for the outer disk when compared to the inner ring. This result depends on the splitting of the SED curve between the warm and the cold dust emission as discussed in the previous section and a more sophisticated model fit to the far-IR SED data of HD 169142 could clarify this issue. A lower Λ ratio, or less scattering, for the inner disk can be explained by the incidence angle for the inner ring, where we see the scattering from a steep inner wall illuminated with nearly normal incidence, while for the outer disk the reflection is from the disk surface, which is illuminated under gracing incidence. It is expected for dust with a typical preference for forward scattering that more light is absorbed for the inner disk wall with respect to the disk surface (e.g., Mulders et al. 2013).
Comparison of scattered radiation with thermal radiation.
The double ratio for the intensity ΛI of the inner disk ring yields values of 10.0% for the R′ band and 12.3% for the I′ band. We can also make some guesses on the ΛI parameters of the outer disk and the total disk. However, for this we are adopting the measured fractional polarization p derived for the inner disk, also for the outer disk. Further, we adopt also the not-so-well-determined two-component splitting for the inner and outer disk for the IR SED, where uncertainties have a much larger impact on the weaker cold component. Thus, the estimated parameter are based on several assumptions and should consequently be considered very cautiously. Therefore, we have put these result in extra lines in Table 5 under the label “estimated parameters”.
Unresolved issues. For the moment, we can use the ΛI double ratio as first guess for the ratio between disk reflection at a given wavelength and the spectrally averaged absorption ℛ/𝒦 ≈ 0.1 for the disk in HD 169142. We can also use the more accurately measured parameter Λϕ for the ratio between polarized reflectivity and absorption (p × ℛ)/𝒦 ≈ 0.03 (I′ band) for the characterization of the disk. However, for a more detailed analysis of dust properties based on comparisons with other disks, we should investigate the impact of various simplifications made in our analysis and elaborate appropriate corrections to eliminate systematic effects like disk inclination and geometry or the color dependence of ℛ(λ).
The rough guess on the disk scattering and absorption assumes that the irradiation of the disk is well described by I⋆, the measured intensity of the unresolved central object, and F⋆, the stellar spectral component in the SED corrected for the contribution of the scattered light from the disk. This assumption is problematic for HD 169142 because of the presence of absorbing hot dust near the star as revealed by the strong near-IR excess (Fhot/F⋆ = 14.4%). This hot dust, could be distributed in the disk plane and reduce substantially the illumination of the disk imaged in scattered light. Therefore, the observed stellar radiation I⋆ and F⋆ are overestimating the disk illumination. Possibly, one can assume for this “disk case” that both I⋆ and F⋆ are overestimated by about the same factor, so that the impact of a disk of hot dust on the double ratios ΛI and Λϕ is rather small. This scenario assumes that scattered and thermal emission from the hot dust disk is emitted predominantly perpendicular to the disk plane and is not adding to the illumination of the resolved disk.
Alternatively, the absorbing hot dust could also be distributed in an optically thin halo around the star. If this halo is close to spherical, then the disk irradiation by stellar light is reduced by about the same amount as the observed stellar radiation I⋆ and F⋆. However, the near-IR emission of the hot dust halo would then also contribute significantly to the disk irradiation and we should use modified Λ ratios where the SED components of the star and the hot dust are taken into account
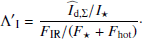
This would reduce for the case of HD 169142 the Λ ratios by roughly 15%. Similar scenarios apply for the light scattering, but the impact of dust scattering on the radiation budget and the Λ ratios is expected to be significantly smaller when compared to the effect of the thermal emission of the hot dust.
5. Discussion
This work presents a quantitative analysis of scattered light observations for the transition disk around HD 169142 taken with the AO system SPHERE at VLT. Such studies have the potential to clarify the properties of the scattering dust particles and may provide evidence for dust evolution in protoplanetary disks if the results from systems with different properties are compared. The signatures of different types of dust particles are expected to be small and therefore a high measuring accuracy is required for meaningful interpretations. The data analysis must consider several instrumental effects and there are hardly any studies in the literature with a focus on quantifying the uncertainties, and getting the accurate results for the measurements of the photo-polarimetric parameters of a circumstellar disk. Therefore, we carried out a step by step analysis of HD 169142 based on imaging polarimetry with an AO system. In this section we discuss the key points for the determination of accurate scattered light parameters for the disk around HD 169142 and then we put the derived results into context for the investigation of the dust particle properties in protoplanetary disks.
5.1. SPHERE/ZIMPOL measurements of HD 169142
The used SPHERE/ZIMPOL instrument and the selected disk HD 169142 are both special when compared to the many existing polarimetric disk observations.
ZIMPOL is unique, because it works at optical wavelengths (500 − 900 nm), and uses a fast modulation-demodulation technique for the polarimetric measurements. ZIMPOL observations have, because of the short wavelength, a lower Strehl ratio and therefore more halo light and larger temporal variations in the PSFs when compared to IR-systems. On the other side, ZIMPOL has the advantage of using detectors with a very high dynamic range so that the circumstellar disk can be observed simultaneously in two wavelength bands together with the corresponding stellar PSF (Schmid et al. 2018). This helps significantly in the signal calibration and the determination of wavelength dependences. The strong PSF variations induced by the atmospheric turbulence can be calibrated and corrected very well, as described in this work.
HD 169142 is a very special disk target because it is seen essentially pole-on and appears as highly axisymmetric system with a circular inner ring and a broader outer disk. Consequently, also smearing and polarization cancelation effects are to first order “axisymmetric” and the scattered light signal can be analyzed in terms of radial profiles with much improved S/Ns because of the azimuthal averaging. Therefore, we can measure exactly the impact of PSF variations for individual polarimetric observation cycles and correct for it. For inclined disks, the simple radial profile analysis carried out for HD 169142 is not applicable, but many effects are qualitatively similar.
SPHERE/ZIMPOL provides as prerequisite for a quantitative analysis of well-calibrated polarimetric data (Schmid et al. 2018). AO systems are complex and require dedicated and extensive polarimetric monitoring to quantify cross-talk effects, which depend typically on the telescope pointing direction and which can convert linear polarization into circular polarization and reduce significantly (≳20%) the measurable signal. Fortunately, there exist several other well-calibrated AO polarimeters, such as GPI (Perrin et al. 2015) or SPHERE/IRDIS (de Boer et al. 2020; van Holstein et al. 2020), and this enables very important cross-checks of results. HD 169142 is one of the good examples where the same object was observed with Gemini/GPI (Monnier et al. 2017), VLT/SPHERE (Pohl et al. 2017; Bertrang et al. 2018; Gratton et al. 2019, and this work), and Subaru/HICIAO (Momose et al. 2015) and the agreement of the described Qϕ signal is good (see Sect. 4.1). Unfortunately, quantitative comparisons of the measurements are difficult because the results are presented in different ways or because the intrinsic disk parameters cannot be separated easily from instrumental effects.
5.1.1. Polarimetric correction for the PSF convolution
The ZIMPOL data of HD 169142 demonstrate the very strong impact of the variable PSF smearing and polarization cancelation effect for the measurement of the azimuthal polarization Qϕ for the compact (r ≈ 0.17″) inner disk. The good message is that the observed and highly variable Qϕ disk signal, with variations of up to a factor of two, is tightly correlated with the measured PSF quality. Therefore, the observed Qϕ signal can be simulated with a disk model and the simultaneously registered PSF with an accuracy of a few percent. Not correcting Qϕ for the PSF smearing and cancelation effects would underestimate the signal for the inner ring of HD 169142 by a factor of about three for the best polarimetric cycles taken under good atmospheric conditions and more for average or bad cycles (see, e.g., Figs. 7 and 8). For the more extended r ≈ 0.5″ outer disk of HD 169142 the Qϕ degradation is “only” at a level of about 30%.
The wavelength dependence of the polarized flux relative to the star  (λ) is important for the characterization of the dust in circumstellar disks, because the disk geometry can be assumed to be the same for different wavelengths and a gradient for
  (λ) is therefore caused by the wavelength dependence of the particle properties. With ZIMPOL, this color effect has been measured accurately as the R′- and I′-band data for HD 169142 were taken simultaneously and therefore under identical atmospheric conditions.
5.1.2. Extracting the disk intensity Id
Measuring the disk intensity Id together with Qϕ yields the fractional polarization p = Qϕ/Id of the scattered light, which is a strong function of the scattering angle α. For circumstellar disks the angle α can typically be well determined and therefore a p measurement is quite unambiguous and provides well-defined constraints for the reflected light.
Unfortunately, it is difficult with ground-based AO observations to extract the disk intensity Id, because of the strongly variable intensity PSF of the bright central star. Polarimetric observations have the advantage that the location of the disk is accurately traced by the Qϕ signal so that photometric extraction windows can be accurately defined. Nonetheless, favorable conditions are still required for a successful extraction, such as for the inner ring of HD 169142, which is bright, narrow, axisymmetric and for ZIMPOL located far enough from the star but close enough to avoid the strong speckle ring at r ≈ 0.5″ from the AO system. For these reasons, we were successful in extracting the disk intensity signal.
The PSF smearing needs again to be considered for the derivation of p as Qϕ is smeared and partially canceled, while Id is only smeared out. This effect reduces for our ZIMPOL observations the measured p = 25.6% for the inner ring of HD 169142 to a de-biased intrinsic fractional polarization value of  (I′ band).
5.2. Dust properties for the disk of HD 169142
5.2.1. Derived photo-polarimetric results
For HD 169142 we obtained as most basic photo-polarimetric parameter the intrinsic, normalized, azimuthal polarization 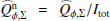 of (0.430 ± 0.010)% for the R′ band and (0.548 ± 0.010)% for the I′ band for the scattered light from the resolved disk covering the radial range from r = 0.07″ to 1.6″. The inner narrow disk ring contributes 72% to this total. The derived value for the polarized flux of ≈0.5% for HD 169142 is typical for transition disks with a large central gap (Garufi et al. 2017b) where a substantial fraction of the stellar light is scattered by the inner wall of the outer disk. These result yield also the intrinsic R′−I′ color of the polarized flux relative to the central star of

indicating a slightly reddish color with respect to the star. We find no significant color difference between the strong inner ring component (0.26 ± 0.05 mag) and the outer disk (0.31 ± 0.10 mag). The color of the normalized polarization flux can also be expressed as double ratio with respect to the wavelength
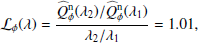
or roughly  for the R′ to I′ band range. The red color for
  is also supported by the measurement of Quanz et al. (2013) who obtained
  = 0.41% for the H band with VLT/NACO, without a correction for the PSF smearing and cancelation effects. The intrinsic value
  for the H band should therefore be significantly larger, perhaps by a factor of 1.5 or even more, in agreement with the derived red color above. A red wavelength dependence of the
  (λ) signal is also measured for the transition disk HD 142527 by Hunziker et al. (2021), who obtained for
  for the near-IR H band a value that is a factor of 2.3 higher than for the “visual” VBB band. Interestingly, this yields a double ratio of ℒϕ(λ) = 1.04 or the same rough
  relation, but for a much wider wavelength range. Similar red color trends are also seen in other protoplanetary disks as for instance HD 135344B (Stolker et al. 2016), but the
  color has not been quantified accurately.
The second important result of this study is the determination of the fractional polarization of the scattered light from the disk in HD 169142. We find for the I′ band a value of
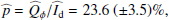
and for the R′ band a similar but less constrained value of 22.0 (±5.9)%. The achieved accuracy is not high enough to claim a positive or negative wavelength trend for p(λ).
The fractional polarization is a strong function of the scattering angle p(α) and is expected to have for many types of dust a maximum near α ≈ 90°, and low values for forward α ≈ 0° and backward scattering α ≈ 180°. For transition disk seen pole-on like HD 169142, the main contribution to the brightness of the inner ring comes most likely from reflections near the upper rim of the inner wall, where the scattering angle is about ≈80°. Therefore, we can assume that the measured p value is close to the maximum fractional polarization produced by the reflection from the disk wall.
It is again interesting to compare with HD 142527 (i ≈ 20°), where Hunziker et al. (2021) find p = (28.0 ± 0.8)% for the polarization of the backside wall for the VBB band (λc = 735 nm). In HD 142527 the backside wall is spatially resolved and one can see the change of the fractional polarization as a function of α for the range of scattering angles from α = 90° to 130°. The peak polarization is a bit higher than the average, at a level of ppeak ≈ 31%. We conclude from this comparison that the fractional polarization produced by the dust in the inner ring of HD 169142 is lower by more than one sigma when compared to HD 142527.
For wavelength λ < 1 μm, no other p values have been measured for the reflecting dust in protoplanetary disks. At near-IR wavelength there are the accurate results for HD 142527 of Hunziker et al. (2021) for the H band, who find for the back wall a mean value of p = (35.1 ± 2.0)%, which is a significantly higher fractional polarization than in the optical. Other estimates of p for protoplanetary disks are unfortunately rare. Monnier et al. (2019) obtained GPI-observations for the disk HD 34700A and report a peak fractional polarization of about ppeak ≈ 50% for the J band and ≈60% for the H band, and Perrin et al. (2009) obtained from λ = 2 μm HST polarimetry of the disk around AB Aur a maximum value of ppeak ≈ 55%, which is also much higher than for HD 169142. One reason is probably the general trend that dust scattering produces a higher fractional polarization at longer wavelengths but it also seems that the dust particles in HD 169142 are different when compared to HD 142527, HD 34700B or AB Aur and produce a lower level of fractional polarization for the scattered light. In Sect. 5.3, we speculate that the dust particles in the inner ring of HD 169142 produce less polarization as they are more compact as a result of the stronger stellar irradiation compared to the other objects.
Another interesting result for HD 169142 follows from the comparison of the scattered light with the thermal emission from the same disk region. This yields for the dust in the disk a rough measure of the ratio between the reflected radiation and the absorbed and reemitted radiation in the IR.
The comparison of the normalized polarized flux  with the near-IR excess FIR/F⋆ for the warm, inner ring and the cold, outer disk yields Λϕ ≈ 2.2 to 4.7%, which is, according to the compilation of Garufi et al. (2017b), quite typical for transition disks. In HD 169142 we can even split the scattered radiation and the thermal emission for the two imaged disk components and find that the values for Λϕ are marginally higher for the outer disk, which is illuminated under grazing incidence.
Adopting the fractional polarization  gives then for the Λ ratio between normalized scattered intensity
  and IR excess FIR/F⋆ the value ΛI ≈ 12.3%. This value indicates roughly that the disk surface albedo is on the order of 10% within an uncertainty of probably a factor of two.
5.2.2. Scattering parameters for the dust
The photo-polarimetric results described above constrain the averaged scattering parameter of the dust in the disk. A simple description of scattering grains consists of three parameters, the single scattering albedo ω, the asymmetry factor g for the adopted Henyey-Greenstein intensity phase function, and a Rayleigh-scattering-like angle dependence of the induced fractional polarization with pmax for the maximum value for θ = 90° (Graham et al. 2007; Engler et al. 2017). Protoplanetary disks are optically thick and therefore one has to take multiple scattering effects into account. This complicates the conversion from the photo-polarimetric disk parameters to dust scattering parameters. We use for the interpretation preliminary results of a disk model grid calculating the conversion between disk scattering parameters and dust scattering parameters (Ma & Schmid, in prep.).
For the low inclination disk HD 169142 the scattering angle α is close to 90° and therefore the measured fractional polarization of  of the scattered light is close to the peak value ppeak produced by the reflection from the disk surface. The observed ppeak value requires for the dust scattering parameters a maximum polarization pmax > ppeak, because under multiple scattering conditions the fractional polarization produced by single scatterings is always reduced by the more randomly polarized (the equivalent of unpolarized) contribution from photons undergoing more than one scattering. Thus, pmax must be higher than ppeak, pmax/ppeak ≳ 2 if multiple scattering dominate the reflected light, while pmax/ppeak ≈ 1 − 2, if the observed photons undergo on average between 1 and 2 scatterings only.
Thus, the depolarization effect is strong for high albedo particles ω ≳ 0.7 producing a lot of multiple scattered light and weak for low albedo ω ≲ 0.3 particles. Our measurements for ΛI yield a rough guess for the ratio between surface reflectivity and absorption or for the surface albedo of about 10% for the disk of HD 169142. As described by Mulders et al. (2013) the surface albedo depends also strongly on the scattering asymmetry parameter g of the particles. If forward scattering is strong (e.g., g = 0.75) then the photons will be scattered into deeper dust layers where the probability for absorption is high, while for little forward scattering (g = 0.25) many photons are undergoing only one scattering, and escape or stay near the surface and can escape after a few scatterings.
Our measurement ΛI ≈ 10% can be met by high albedo, forward scattering particles, producing a high scattering polarization (ω ≈ 0.7, g ≈ 0.75, and pmax ≈ 50%) or lower albedo, almost isotropically scattering particles with lower scattering polarization (ω ≈ 0.5, g ≈ 0.25 and pmax ≈ 30%), or particles with about intermediate scattering parameters (ω ≈ 0.6, g ≈ 0.5, and pmax ≈ 40%).
Unfortunately, the pole-on disk HD 169142 is not suited to constrain the scattering asymmetry parameter g, which can be better estimated in inclined disks from the front side to back side brightness contrast. In future, it should be possible to deduce a “typical” g parameter for protoplanetary disk from observations of inclined disks and then one can narrow down further the possible parameter range for ω and pmax for the dust in HD 169142.
5.3. Constraints on dust properties
The dust scattering parameters derived for HD 169142 and other protoplanetary disks inform us about the physical properties of the scattering grains, such as size distribution, composition, and structure. Small grains with radii a < λ/(2π) are in the Rayleigh regime and they produce a high fractional polarization pmax and only moderate forward scattering g, while large spherical grains a > λ/(2π) have a much smaller pmax but larger ω. Therefore, interstellar dust as described by Draine (2003) with particle size distribution found by Weingartner & Draine (2001) is expected to show a strong wavelength dependence for pmax, decreasing from more than 50% in H band (a/λ small), to 40% in the I band and only 30% in the R band (a/λ large), while the asymmetry parameter increases from g ≈ 0.2 in the H band to about 0.5 in the R band. We cannot constrain the g parameter for the pole-on HD 169142, but inclined protoplanetary disks, for example HD 142527 (Hunziker et al. 2021), show a strong forward scattering effect at λ = 0.73 μm, but without the expected decrease in g for the near-IR (1.6 μm) as inferred from the front to back side disk brightness ratio. This indicates that the scattering particles in these disks are larger than for the interstellar dust. However, the Mie theory predicts for a distribution of large spherical particles with a composition such as interstellar dust a low fractional scattering polarization pmax ⪅ 30% in the visual and near-IR. Considering multiple scattering led to a dilution of the observable fractional polarization for a optically thick disk to pmax ⪅ 20%, which is still compatible with our observations of HD 169142, but certainly not with the higher fractional disk polarization max(p)≈30%−60% measured for, for example, HD 142527, AB Aur, or HD34700A (Hunziker et al. 2021; Perrin et al. 2009; Monnier et al. 2019). This is a well-known general problem of the Mie theory for describing the dust scattering in protoplanetary disks. Therefore, models for more complex dust were introduced, based on aggregates or porous grains, which produce a high scattering asymmetry g > 0.5 as found for large particles but also a high scattering polarization pmax ⪆ 30% from the (Rayleigh scattering like) interaction of the radiation with small-scale substructures of the particle.
Models for more complex particles are for example discussed in Min et al. (2016) for compact dust aggregates with a porosity of about 25% or Tazaki et al. (2019) for fluffy aggregates with a porosity > 80%. Large particles with a low porosity as described in Min et al. (2016) tend to produce a lower scattering polarization pmax ⪅ 50% compatible with the observed fractional disk polarization of p ≈ 23% for HD 169142, while a disk with p ≈ 50% requires more porous grains as discussed in Tazaki et al. (2019).
We may speculate that the relatively low fractional polarization found for HD 169142 could be explained by the presence of more compact grains. HD 169142 is special because as of now no fractional polarization measurements exist for dust scattering in protoplanetary disks that is so close to the star (r = 0.17″ or 19 AU) and as strongly illuminated as the inner disk wall of this object. Therefore, the corresponding black body temperature for the scattering dust of ≈137 K is much higher than for other disks with p measurements. We therefore speculate that the strong stellar irradiation could be responsible for the presence of more compact dust particles. This tentative hypothesis should be considered cautiously and should be tested with similar measurements of the dust scattering for other disks with strong irradiation.
Another important piece of information for testing dust models is the wavelength dependence of the scattering parameters because it seems reasonable to assume that the disk geometry is identical for different colors. We find for HD 169142 a red color for the disk reflectivity in polarized light, similar to other disks. For large particles a > 1 μm the color of the disk reflectivity is expected to depend strongly on the wavelength dependence of the single scattering albedo ω(λ), and much less on g(λ) or pmax(λ). The scattering albedo is certainly a strong function of the particle composition, with high albedos for silicate rich and icy particles and low albedos for carbon rich particles. The wavelength dependences of the albedo for complex grains have not yet been investigated in much detail. For example, Tazaki et al. (2019) find for their a > 1 μm aggregate grains predominantly a gray or even slightly blue dependence for ω(λ). The less porous grains in the model of Min et al. (2016), which are composed of silicates, carbon and iron sulfides typical for solar abundances, show little wavelength dependence for ω(λ) for λ < 2 μm and an increase with wavelength for λ ⪆ 2 μm. It seems that there are some clear discrepancy between our observations and these dust models.
It is beyond the scope of this paper to discuss the merits of different dust models. But we like to strongly emphasize that accurate polarimetric measurements of the scattered light from protoplanetary disks, such as the ones presented in this paper for HD 169142, are now possible and more will become available. These data provide interesting new constraints and will help to establish the models for the scattering dust in disks and clarify its relations to the resulting composition of the planets formed in these disks.
6. Conclusions
The new generation of AO polarimeters provides the opportunity to obtain quantitative polarimetric measurements for the light scattered by the dust in circumstellar disks (e.g., Schmid 2021). Such observations are potentially very useful for constraining the properties of the dust that may also become part of newly formed planets. Apart from a few previous polarimetric studies based on HST data (e.g., Perrin et al. 2009), such investigations are rather new for protoplanetary disks, and one needs to first establish the data analysis procedures and the diagnostics for the interpretation of the polarization results. This paper is one of the first studies with a primary focus on a quantitative polarimetry of protoplanetary disks based on ground-based AO instruments.
We selected HD 169142 as a simple target for our basic study; it is a well-resolved, bright, pole-on, axisymmetric transition disk. Therefore, we were able to carry out an analysis based on azimuthally averaged radial profiles instead of two-dimensional disk maps. We found that the measured disk polarization depends strongly on the variable AO performance, a fact that is often overlooked in disk polarimetry. We show that the corresponding PSF convolution effects can be accurately modeled if the PSFs for the observations are well known. Convolution must be taken into account for accurate measurements of the polarized disk flux. The same type of correction can be applied to inclined disks but requires, of course, an analysis procedure that considers the azimuthal dependences.
Due to the fact that the SPHERE/ZIMPOL instrument simultaneously measures the stellar intensity PSF and the polarized disk flux in two pass-bands, we achieved, after detailed correction for the convolution effects, a very high accuracy for the intrinsic polarized flux relative to the total system intensity of  for the R′ band and (5.48 ± 0.10)×10−3 for the I′ band. This color dependence for the polarized reflectivity of the disk surface is an easily measurable quantity that seems to be very useful for the characterization of the scattering dust. Thus, for HD 169142 the dust has a red color in polarized scattered light, similar to the previous study for HD 142527 (Hunziker et al. 2021).
It was also possible to extract the intensity signal for the bright inner disk ring of HD 169142, and we derived a intrinsic fractional polarization of about 23% for the scattered light, considering again the important convolution and signal extraction effects. In addition, we compared the scattered intensity with the thermal emission components of the dust and estimated a rough value for the disk surface albedo of about 10%.
The imprints of different types of dust particles on the scattering polarization are expected to be subtle, and accurately measuring the polarization parameters for the reflectivity of the dust is important. Only this will allow, from measurements of different types of protoplanetary disks, an assessment of the heterogeneity or homogeneity of dust scattering properties, and this is important for deriving new constraints regarding the dust evolution processes in these systems.
Of course, we would like to ultimately derive the size distribution, structure, and composition of the dust grains in the studied disks. This requires model calculations for protoplanetary disks for the interpretation of the polarization data that consider the detailed geometry of the disk and the multiple scatterings taking place at the surface and which use realistic descriptions for the light scattering by the complex dust particles. Much progress has been made in modeling the thermal emission of disks (e.g., Chiang & Goldreich 1997; Dullemond & Dominik 2004; Woitke et al. 2016), the general hydrodynamic structures (e.g., Armitage 2011), the overall disk appearance in polarized scattered light (e.g., Murakawa 2010; Min et al. 2012; Dong et al. 2012), and the light scattering properties of different types of dust (Min et al. 2016; Tazaki et al. 2019). However, these models are still far from a comprehensive radiative transfer model for a given circumstellar disk, and they include ad hoc assumptions and produce unsolved parameter ambiguities for the best fitting solution to disk observations.
For example, a larger fraction of disk models in the literature use the Mie theory for homogeneous spherical particles with a composition typical for silicates (Draine & Lee 1984). This light scattering description is not able to easily explain the scattered light observations of protoplanetary disks; it typically shows the properties of strong forward scattering, as expected for large grains, and a contradictory high fractional scattering polarization of > 20%, as expected for small spherical grains. For this reason, more complex particles, so-called aggregates, are proposed; they are large with respect to the wavelength in order to produce a strong forward scattering diffraction peak but have a lot of small-scale features so that the light can interact with small structures similar to scattering by small particles (like Rayleigh scattering), producing a relatively high fractional scattering polarization (Min et al. 2016; Tazaki et al. 2019).
Model calculations for the expected polarization signal for disks with such complex dust grains are presented by Tazaki et al. (2019). It is interesting to note that for pole-on disks they predict the fractional polarization  at λ = 1.6 μm for grains with different porosities. For disks with low porosity (25 percent) compact grains they calculate
  , while disks with highly porous (85 percent) grains produce
  . The measured fractional polarization for HD 169142 and HD 142527 lies between these two cases. Tazaki et al. (2019) also predict blue colors in the near-IR for the polarized reflectivity of grains with high porosity (≳85 percent), and one may expect that this is not compatible with the red polarized reflectivity colors in this work despite the fact that the color is measured at shorter wavelengths. The red colors for the disk reflectivity of HD 169142 and HD 142527 are more compatible with large, low porosity (≈ 25 percent) dust aggregates, as described by Min et al. (2016).
More such model calculations are required to better constrain the dust properties in circumstellar disks based on polarimetric measurements as presented in this work. In particular, the models should provide diagnostic parameters for the determination of dust properties that can easily be compared with observational data and do not depend strongly on often unknown details of the disk geometry. Such a parameter is the polarized reflectivity color derived in this work for HD 169142, where we expect that the measured color value depends predominantly on the dust scattering properties. Also, the fractional polarization of the scattered light  is such a “dust scattering parameter” because the scattering angle, the most important geometric parameter for the
  of a surface, is typically well constrained for circumstellar disks. The comparison between the scattered intensity and thermal emission of the disk as described in this work by the Λ double ratios provide additional information about the dust scattering opacity. In addition, inclined disks will be very useful for constraining the scattering asymmetry parameter. Combining all this observational information from high quality data with sophisticated dust scattering models will advance our knowledge of the scattering dust in protoplanetary disks in the near future.
Acknowledgments
We would like to thank the anonymous referee for helping to improve this manuscript with valuable comments. We thank Jie Ma for giving access to preliminary results of her model calculations. We acknowledge the financial support by the Swiss National Science Foundation through grant 200020_162630/1. Based on data obtained from the ESO Science Archive Facility.
References
- Acke, B., & van den Ancker, M. E. 2004, A&A, 426, 151 [NASA ADS] [CrossRef] [EDP Sciences] [Google Scholar]
- Apai, D., Pascucci, I., Brandner, W., et al. 2004, A&A, 415, 671 [NASA ADS] [CrossRef] [EDP Sciences] [Google Scholar]
- Armitage, P. J. 2011, ARA&A, 49, 195 [Google Scholar]
- Avenhaus, H., Quanz, S. P., Schmid, H. M., et al. 2014, ApJ, 781, 87 [Google Scholar]
- Avenhaus, H., Quanz, S. P., Garufi, A., et al. 2018, ApJ, 863, 44 [NASA ADS] [CrossRef] [Google Scholar]
- Benisty, M., Juhasz, A., Boccaletti, A., et al. 2015, A&A, 578, L6 [NASA ADS] [CrossRef] [EDP Sciences] [Google Scholar]
- Bertrang, G. H. M., Avenhaus, H., Casassus, S., et al. 2018, MNRAS, 474, 5105 [NASA ADS] [CrossRef] [Google Scholar]
- Bertrang, G. H. M., Flock, M., Keppler, M., et al. 2020, ApJ, submitted [arXiv:2007.11565] [Google Scholar]
- Beuzit, J. L., Vigan, A., Mouillet, D., et al. 2019, A&A, 631, A155 [NASA ADS] [CrossRef] [EDP Sciences] [Google Scholar]
- Brott, I., & Hauschildt, P. H. 2005, in The Three-Dimensional Universe with Gaia, ESA Spec. Publ., 576, 565 [NASA ADS] [Google Scholar]
- Canovas, H., Ménard, F., Hales, A., et al. 2013, A&A, 556, A123 [NASA ADS] [CrossRef] [EDP Sciences] [Google Scholar]
- Carney, M. T., Fedele, D., Hogerheijde, M. R., et al. 2018, A&A, 614, A106 [NASA ADS] [CrossRef] [EDP Sciences] [Google Scholar]
- Chavero, C., Gómez, M., Whitney, B. A., & Saffe, C. 2006, A&A, 452, 921 [NASA ADS] [CrossRef] [EDP Sciences] [Google Scholar]
- Chen, L., Kóspál, Á., Ábrahám, P., et al. 2018, A&A, 609, A45 [NASA ADS] [CrossRef] [EDP Sciences] [Google Scholar]
- Chiang, E. I., & Goldreich, P. 1997, ApJ, 490, 368 [Google Scholar]
- de Boer, J., Langlois, M., van Holstein, R. G., et al. 2020, A&A, 633, A63 [NASA ADS] [CrossRef] [EDP Sciences] [Google Scholar]
- Dionatos, O., Woitke, P., Güdel, M., et al. 2019, A&A, 625, A66 [NASA ADS] [CrossRef] [EDP Sciences] [Google Scholar]
- Dong, R., Rafikov, R., Zhu, Z., et al. 2012, ApJ, 750, 161 [NASA ADS] [CrossRef] [Google Scholar]
- Draine, B. T. 2003, ApJ, 598, 1017 [NASA ADS] [CrossRef] [Google Scholar]
- Draine, B. T., & Lee, H. M. 1984, ApJ, 285, 89 [NASA ADS] [CrossRef] [Google Scholar]
- Dullemond, C. P., & Dominik, C. 2004, A&A, 421, 1075 [NASA ADS] [CrossRef] [EDP Sciences] [Google Scholar]
- Dunkin, S. K., Barlow, M. J., & Ryan, S. G. 1997, MNRAS, 286, 604 [NASA ADS] [CrossRef] [Google Scholar]
- Engler, N., Schmid, H. M., Thalmann, C., et al. 2017, A&A, 607, A90 [NASA ADS] [CrossRef] [EDP Sciences] [Google Scholar]
- Fitzpatrick, E. L. 2004, in Astrophysics of Dust, ASP Conf. Ser., 309, 33 [NASA ADS] [Google Scholar]
- Gaia Collaboration 2018, VizieR Online Data Catalog: I/345 [Google Scholar]
- Garufi, A., Benisty, M., Stolker, T., et al. 2017a, The Messenger, 169, 32 [NASA ADS] [Google Scholar]
- Garufi, A., Meeus, G., Benisty, M., et al. 2017b, A&A, 603, A21 [NASA ADS] [CrossRef] [EDP Sciences] [Google Scholar]
- Gledhill, T. M., & Scarrott, S. M. 1989, MNRAS, 236, 139 [NASA ADS] [CrossRef] [Google Scholar]
- Grady, C. A., Schneider, G., Hamaguchi, K., et al. 2007, ApJ, 665, 1391 [Google Scholar]
- Graham, J. R., Kalas, P. G., & Matthews, B. C. 2007, ApJ, 654, 595 [Google Scholar]
- Gratton, R., Ligi, R., Sissa, E., et al. 2019, A&A, 623, A140 [NASA ADS] [CrossRef] [EDP Sciences] [Google Scholar]
- Habart, E., Natta, A., Testi, L., & Carbillet, M. 2006, A&A, 449, 1067 [NASA ADS] [CrossRef] [EDP Sciences] [Google Scholar]
- Hales, A. S., Gledhill, T. M., Barlow, M. J., & Lowe, K. T. E. 2006, MNRAS, 365, 1348 [Google Scholar]
- Hashimoto, J., Tamura, M., Muto, T., et al. 2011, ApJ, 729, L17 [Google Scholar]
- Hodapp, K. W., Suzuki, R., Tamura, M., et al. 2008, in Ground-based and Airborne Instrumentation for Astronomy II, eds. I. S. McLean, & M. M. Casali, International Society for Optics and Photonics (SPIE), 7014, 488 [Google Scholar]
- Honda, M., Maaskant, K., Okamoto, Y. K., et al. 2012, ApJ, 752, 143 [Google Scholar]
- Hunziker, S., Schmid, H. M., Ma, J., et al. 2021, A&A, 648, A110 [NASA ADS] [CrossRef] [EDP Sciences] [Google Scholar]
- Keller, L. D., Sloan, G. C., Forrest, W. J., et al. 2008, ApJ, 684, 411 [Google Scholar]
- Kluska, J., Berger, J. P., Malbet, F., et al. 2020, A&A, 636, A116 [NASA ADS] [CrossRef] [EDP Sciences] [Google Scholar]
- Kolokolova, L., & Kimura, H. 2010, A&A, 513, A40 [NASA ADS] [CrossRef] [EDP Sciences] [Google Scholar]
- Kuhn, J. R., Potter, D., & Parise, B. 2001, ApJ, 553, L189 [NASA ADS] [CrossRef] [Google Scholar]
- Lenzen, R., Hartung, M., Brandner, W., et al. 2003, in NAOS-CONICA first on sky results in a variety of observing modes, SPIE Conf. Ser, 4841, 944 [NASA ADS] [Google Scholar]
- Ligi, R., Vigan, A., Gratton, R., et al. 2018, MNRAS, 473, 1774 [Google Scholar]
- Macías, E., Espaillat, C. C., Osorio, M., et al. 2019, ApJ, 881, 159 [CrossRef] [Google Scholar]
- Mackay, D. J. C. 2003, Information Theory, Inference and Learning Algorithms [Google Scholar]
- Meeus, G., Waters, L. B. F. M., Bouwman, J., et al. 2001, A&A, 365, 476 [NASA ADS] [CrossRef] [EDP Sciences] [Google Scholar]
- Min, M., Canovas, H., Mulders, G. D., & Keller, C. U. 2012, A&A, 537, A75 [NASA ADS] [CrossRef] [EDP Sciences] [Google Scholar]
- Min, M., Rab, C., Woitke, P., Dominik, C., & Ménard, F. 2016, A&A, 585, A13 [NASA ADS] [CrossRef] [EDP Sciences] [Google Scholar]
- Momose, M., Morita, A., Fukagawa, M., et al. 2015, PASJ, 67, 83 [Google Scholar]
- Monnier, J. D., Harries, T. J., Aarnio, A., et al. 2017, ApJ, 838, 20 [Google Scholar]
- Monnier, J. D., Harries, T. J., Bae, J., et al. 2019, ApJ, 872, 122 [Google Scholar]
- Mulders, G. D., Min, M., Dominik, C., Debes, J. H., & Schneider, G. 2013, A&A, 549, A112 [NASA ADS] [CrossRef] [EDP Sciences] [Google Scholar]
- Murakawa, K. 2010, A&A, 518, A63 [NASA ADS] [CrossRef] [EDP Sciences] [Google Scholar]
- Murakawa, K., Suto, H., Tamura, M., et al. 2004, PASJ, 56, 509 [NASA ADS] [Google Scholar]
- Muto, T., Grady, C. A., Hashimoto, J., et al. 2012, ApJ, 748, L22 [Google Scholar]
- Okamoto, Y. K., Kataza, H., Honda, M., et al. 2017, AJ, 154, 16 [Google Scholar]
- Osorio, M., Anglada, G., Carrasco-González, C., et al. 2014, ApJ, 791, L36 [Google Scholar]
- Pérez, S., Casassus, S., Baruteau, C., et al. 2019, AJ, 158, 15 [Google Scholar]
- Perrin, M. D., Schneider, G., Duchene, G., et al. 2009, ApJ, 707, L132 [Google Scholar]
- Perrin, M. D., Duchene, G., Millar-Blanchaer, M., et al. 2015, ApJ, 799, 182 [Google Scholar]
- Pohl, A., Benisty, M., Pinilla, P., et al. 2017, ApJ, 850, 52 [Google Scholar]
- Quanz, S. P., Schmid, H. M., Geissler, K., et al. 2011, ApJ, 738, 23 [Google Scholar]
- Quanz, S. P., Avenhaus, H., Buenzli, E., et al. 2013, ApJ, 766, L2 [Google Scholar]
- Raman, A., Lisanti, M., Wilner, D. J., Qi, C., & Hogerheijde, M. 2006, AJ, 131, 2290 [Google Scholar]
- Roddier, C., Roddier, F., Northcott, M. J., Graves, J. E., & Jim, K. 1996, ApJ, 463, 326 [NASA ADS] [CrossRef] [Google Scholar]
- Schmid, H. M. 2021, IAU Symp., 360 [Google Scholar]
- Schmid, H. M., Joos, F., & Tschan, D. 2006, A&A, 452, 657 [NASA ADS] [CrossRef] [EDP Sciences] [Google Scholar]
- Schmid, H. M., Bazzon, A., Roelfsema, R., et al. 2018, A&A, 619, A9 [NASA ADS] [CrossRef] [EDP Sciences] [Google Scholar]
- Seok, J. Y., & Li, A. 2016, ApJ, 818, 2 [NASA ADS] [CrossRef] [Google Scholar]
- Silber, J., Gledhill, T., Duchêne, G., & Ménard, F. 2000, ApJ, 536, L89 [Google Scholar]
- Simmons, J. F. L., & Stewart, B. G. 1985, A&A, 142, 100 [NASA ADS] [Google Scholar]
- Sisson, S. A., Fan, Y., & Beaumont, M. A. 2018, ArXiv e-prints [arXiv:1802.09720] [Google Scholar]
- Sloan, G. C., Keller, L. D., Forrest, W. J., et al. 2005, ApJ, 632, 956 [NASA ADS] [CrossRef] [Google Scholar]
- Stolker, T., Dominik, C., Avenhaus, H., et al. 2016, A&A, 595, A113 [NASA ADS] [CrossRef] [EDP Sciences] [Google Scholar]
- Sylvester, R. J., Barlow, M. J., & Skinner, C. J. 1995, Ap&SS, 224, 405 [CrossRef] [Google Scholar]
- Sylvester, R. J., Skinner, C. J., Barlow, M. J., & Mannings, V. 1996, MNRAS, 279, 915 [Google Scholar]
- Tazaki, R., Tanaka, H., Muto, T., Kataoka, A., & Okuzumi, S. 2019, MNRAS, 485, 4951 [NASA ADS] [CrossRef] [Google Scholar]
- van der Marel, N. 2017, The ALMA Revolution: Gas and Dust in Transitional Disks, eds. M. Pessah, & O. Gressel, 445, 39 [NASA ADS] [Google Scholar]
- van Holstein, R. G., Girard, J. H., de Boer, J., et al. 2020, A&A, 633, A64 [NASA ADS] [CrossRef] [EDP Sciences] [Google Scholar]
- Villenave, M., Benisty, M., Dent, W. R. F., et al. 2019, A&A, 624, A7 [NASA ADS] [CrossRef] [EDP Sciences] [Google Scholar]
- Walker, H. J., & Wolstencroft, R. D. 1988, PASP, 100, 1509 [NASA ADS] [CrossRef] [Google Scholar]
- Weingartner, J. C., & Draine, B. T. 2001, ApJ, 548, 296 [Google Scholar]
- Woitke, P., Min, M., Pinte, C., et al. 2016, A&A, 586, A103 [NASA ADS] [CrossRef] [EDP Sciences] [Google Scholar]
- Woitke, P., Kamp, I., Antonellini, S., et al. 2019, PASP, 131, 064301 [NASA ADS] [CrossRef] [Google Scholar]
- Yudin, R. V., & Evans, A. 1998, A&AS, 131, 401 [NASA ADS] [CrossRef] [EDP Sciences] [Google Scholar]
Appendix A: Telescope polarization correction
The aluminum coating of the M3 mirror in the VLT introduces instrumental polarization, which is partly but not completely compensated for by the following optical components. The details are described in Schmid et al. (2018) with correction formulas and parameters for different filters. The measured polarization for uncorrected cycles are expected to lie on a circle in the Q/I-U/I plane because the M3-mirror orientation of a Nasmyth telescope rotates with respect to the sky during the observations. The radius of the circle is defined by the telescope polarization ptel, and the position angle θtel depends on the parallactic angle θpara(t) and a SPHERE-ZIMPOL specific position angle offset δtel, which depends on the used passband filter. The midpoint (qm, um) of the circle can be offset from (0,0) because of an intrinsic polarization of the star or interstellar polarization introduced by dust between us and the target.
Therefore, the telescope polarization ptel can be derived from the systematic change of the polarization from cycle to cycle along this circle in the Q/I-U/I plane. Actually, a more accurate correction should even consider the evolution of θpara during each polarimetric cycle, which can be very fast for targets near zenith. In this case θpara(t) differs strongly between the Stokes Q and U measurements introducing a systematic bias effect in the polarization measurement and one should use the following correction formulas for the four measurements Q+, Q−, U+, and U− of a polarimetric cycle:
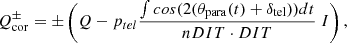
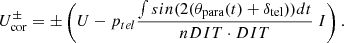
Figure A.1 shows an extreme numerical example for a strong evolution of the parallactic angle by 50° during a long polarimetric cycle, resulting in (qc, uc) position of the cycle in the Q/I-U/I plane. The necessary polarization corrections shown in orange (Stokes Q) and green (Stokes U), calculated from the formulas above, represent a time average Q/I value for the instrument polarization circle sections shown in light blue for the Q+ and Q− measurements and for the average U/I value for the dark blue U+ and U− measurements. For this example using the mean parallactic angle of the complete cycle for the U correction would lead to a small correction (+0.08%) instead of the value (+0.38%) indicated by the green arrow. Neglecting the temporal evolution effect of θpara(t) can produce wrong results for the telescope polarization ptel, θtel and therefore also the “corrected” target polarization (Qcor/I, Ucor/I) = (qm, um).
 |
Fig. A.1. Measured Q/I and U/I parameters and correction for the temporal evolution of the telescope polarization position angle due to the changing parallactic angle during one polarimetric cycle. The blue circle sections show the effect of the changing telescope polarization angle θtel during the Q+ (lightest blue), Q−, U+, and U− (darkest blue) integrations. The required corrections for Stokes Q/I and U/I are indicated by the orange and green arrows, respectively. |
We analyzed our fast polarimetry cycles of HD 169142 (all cycles without saturation) using the detailed formula above and searched for the telescope polarization parameters ptel and δtel, which minimize the scatter for the resulting circle center (Qcor/I, Ucor/I). Figure A.2 shows the measured polarization (Q/I, U/I) of each cycle for the I′ band and the R′ band and the median values for the corrected polarization (Qcor/I, Ucor/I) = ( − (0.08 ± 0.03)%, −(0.06 ± 0.03)%) for the I′ band and ( − (0.05 ± 0.05)%, −(0.05 ± 0.04)%) for the R′ band. Also shown are the circles, which represent the telescope polarization parameters ptel = 0.34% and δtel = 44.4° for the I′ band and ptel = 0.59% and δtel = 13.8° for the R′ band. For our data of HD 169142 the parallactic angle changes during one cycle are less than 6 degrees and the detailed formulae given above yields almost the same result like the approximate correction described in Schmid et al. (2018) using just polarization values for the mean parallactic angle θpara(mean) for each cycle Qcor ≈ Q − ptel cos(2(θpara(mean)+δtel)) I and Ucor ≈ U − ptel sin(2(θpara(mean)+δtel)) I.
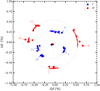 |
Fig. A.2. Measured I′-band (blue dots) and R′-band (red dots) polarization for HD 169142 for the individual, non-corrected, cycle. The best solutions for the corrected polarization are shown with diamonds for the two bands. The thin circles illustrate the derived telescope polarization ptel, and the colored lines the derived position angle offset θtel for the measured cycles. Every fourth cycle number, as defined in Table 1, is annotated. |
Appendix B: PSF variations
The shape of the PSF depends strongly on the atmospheric turbulence and the AO performance. As illustrated in Sect. 4.2.2 this has a strong impact on the observed Qϕ signal, due to smearing and polarimetric cancelation. In Fig. B.1 we show the I′-band intensity images of HD 169142 with the highest and lowest peak intensity, selected from  given in Fig. 4. We use these images as proxy for the best and the worst I′-band PSF and to assess the effects of the convolution on Qϕ. Figure B.2 shows the corresponding best and worst radial intensity profiles for HD 169142, and the mean profile for all unsaturated (fast polarimetry mode) I′-band observations from July 7, 2015. Additionally, we show as comparison the profiles of standard stars for the N_I filter from Schmid et al. (2018) taken under different observing conditions. The profiles are flux normalized and the peak flux can be used as proxy for the Strehl ratio. According to Schmid et al. (2018) we derive for the best profiles of HD 169142 an approximate Strehl ratios of about 15 % for the I′ band and 10 % for the R′ band. It should be noted that this kind of Strehl ratio is underestimating the AO-performance, because it includes also stray light effects, detector smearing (e.g., from the frame transfer), and other instrumental effects not related to the AO system. The lower panel in Fig. B.2 shows the encircled flux as cumulative radial counts normalized to 1 inside an aperture with r = 1.5″ aperture as illustration of PSF smearing. However, the logarithmic presentations can be misleading and corresponding profiles on linear scales can be found in Schmid et al. (2018).
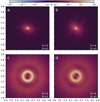 |
Fig. B.1. I′-band PSF variations in the HD 169142 observations on July 9, 2015, and impact on the Qϕ simulation. The top row shows the best cycle PSF (a) and the worst cycle PSF (b). Both are divided by the maximum of the best cycle PSF. The bottom row illustrates the Qϕ model (normalized to 1) given in Fig. 6 (c) convolved with the best PSF (d) and the worst PSF (j). |
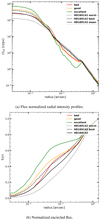 |
Fig. B.2. I′-band PSF variations in the HD 169142 observations from July 9, 2015, in comparison with other PSF profiles obtained with SPHERE/ZIMPOL (N_I filter). (a) Flux normalized radial intensity profiles. (b) Normalized encircled flux. |
All Tables
Parameters for the used SPHERE/ZIMPOL polarimetric observation cycles of HD 169142.
Disk model parameters for the normalized polarized flux for the R′ and I′ band, where fluxes are expressed relative to the total R′ and I′ intensity of the HD 169142 system.
Model parameters for the scattered intensity for the HD 169142 disk: parameter, fractional polarization , normalized disk intensities measured for the inner ring and for the outer disk and the entire disk adopting the values from the inner ring.
All Figures
|
Fig. 1. High signal-to-noise Qϕ azimuthal polarization image of the HD 169142 protoplanetary disk obtained by stacking all R′, I′, and VBB-filter frames from 2015 given in Table 1. The position of the star is marked with a green circle, and the axes give the separation in arcseconds. North is up and east to the left. |
| In the text | |
|
Fig. 2. Azimuthal dependence of the polarized flux from the dust disk around HD 169142. Top: radially integrated polarized flux Qϕ(ϕ) for 8° wide angles for the inner (30 − 60 px) and outer (110 − 300 px) ring and the total disk (30 − 300 px) as a function of azimuthal angle ϕ. Bottom: separation rmax(ϕ) of the Qϕ peak flux rmax = maxr(Qϕ(r)) in 20° angle intervals for the inner and outer dust ring. The red curve is a simple fit of a circle with a 2.5 px center offset (1 px = 3.6 mas). The major (darker) and minor axis position are marked with vertical gray lines. |
| In the text | |
|
Fig. 3. Mean radial profiles for the azimuthal polarization |
| In the text | |
|
Fig. 4. Cycle-to-cycle variations in the normalized PSF peak intensity |
| In the text | |
|
Fig. 5. Correlations with the PSF peak quality |
| In the text | |
|
Fig. 6. Comparison of the Stokes |
| In the text | |
|
Fig. 7. R′ band (red) and I′ band (blue) radial profiles for the azimuthal polarization |
| In the text | |
|
Fig. 8. PSF-convolved polarization model flux |
| In the text | |
|
Fig. 9. Azimuthally averaged intensity profiles of HD 169142 showing the difference between the stellar PSF and the disk. Upper panels: radial profiles for the I′ band (left) and the R′ band (right) for the observed intensity Itot(r) and the best power-law fit for the stellar PSF I⋆(r). Bottom panels: profiles for the best fitting disk intensity model Id(r) = γQϕ(r), together with the difference Itot(r)−I⋆(r) and the fit residuals (dashed lines). The MCMC fit optimization range is between 30 px (0.108″) and 70 px (0.252″), as indicated by the vertical lines. |
| In the text | |
|
Fig. 10. Relative PSF convolution differences for the radial profiles of the disk intensity |
| In the text | |
|
Fig. 11. Detailed SED model fit for HD 169142. Blue represents our merged data fit, black our total model, yellow the radiation of the star, orange the hot dust close to the star, green the warm inner ring, purple the cold outer disk, and gray the PAH estimate. The dots are our measurements of the dust reflection and the dashed lines our estimates for the spectral distribution of the scattering. |
| In the text | |
|
Fig. A.1. Measured Q/I and U/I parameters and correction for the temporal evolution of the telescope polarization position angle due to the changing parallactic angle during one polarimetric cycle. The blue circle sections show the effect of the changing telescope polarization angle θtel during the Q+ (lightest blue), Q−, U+, and U− (darkest blue) integrations. The required corrections for Stokes Q/I and U/I are indicated by the orange and green arrows, respectively. |
| In the text | |
|
Fig. A.2. Measured I′-band (blue dots) and R′-band (red dots) polarization for HD 169142 for the individual, non-corrected, cycle. The best solutions for the corrected polarization are shown with diamonds for the two bands. The thin circles illustrate the derived telescope polarization ptel, and the colored lines the derived position angle offset θtel for the measured cycles. Every fourth cycle number, as defined in Table 1, is annotated. |
| In the text | |
|
Fig. B.1. I′-band PSF variations in the HD 169142 observations on July 9, 2015, and impact on the Qϕ simulation. The top row shows the best cycle PSF (a) and the worst cycle PSF (b). Both are divided by the maximum of the best cycle PSF. The bottom row illustrates the Qϕ model (normalized to 1) given in Fig. 6 (c) convolved with the best PSF (d) and the worst PSF (j). |
| In the text | |
|
Fig. B.2. I′-band PSF variations in the HD 169142 observations from July 9, 2015, in comparison with other PSF profiles obtained with SPHERE/ZIMPOL (N_I filter). (a) Flux normalized radial intensity profiles. (b) Normalized encircled flux. |
| In the text | |
Current usage metrics show cumulative count of Article Views (full-text article views including HTML views, PDF and ePub downloads, according to the available data) and Abstracts Views on Vision4Press platform.
Data correspond to usage on the plateform after 2015. The current usage metrics is available 48-96 hours after online publication and is updated daily on week days.
Initial download of the metrics may take a while.