Fig. 5.
Download original image
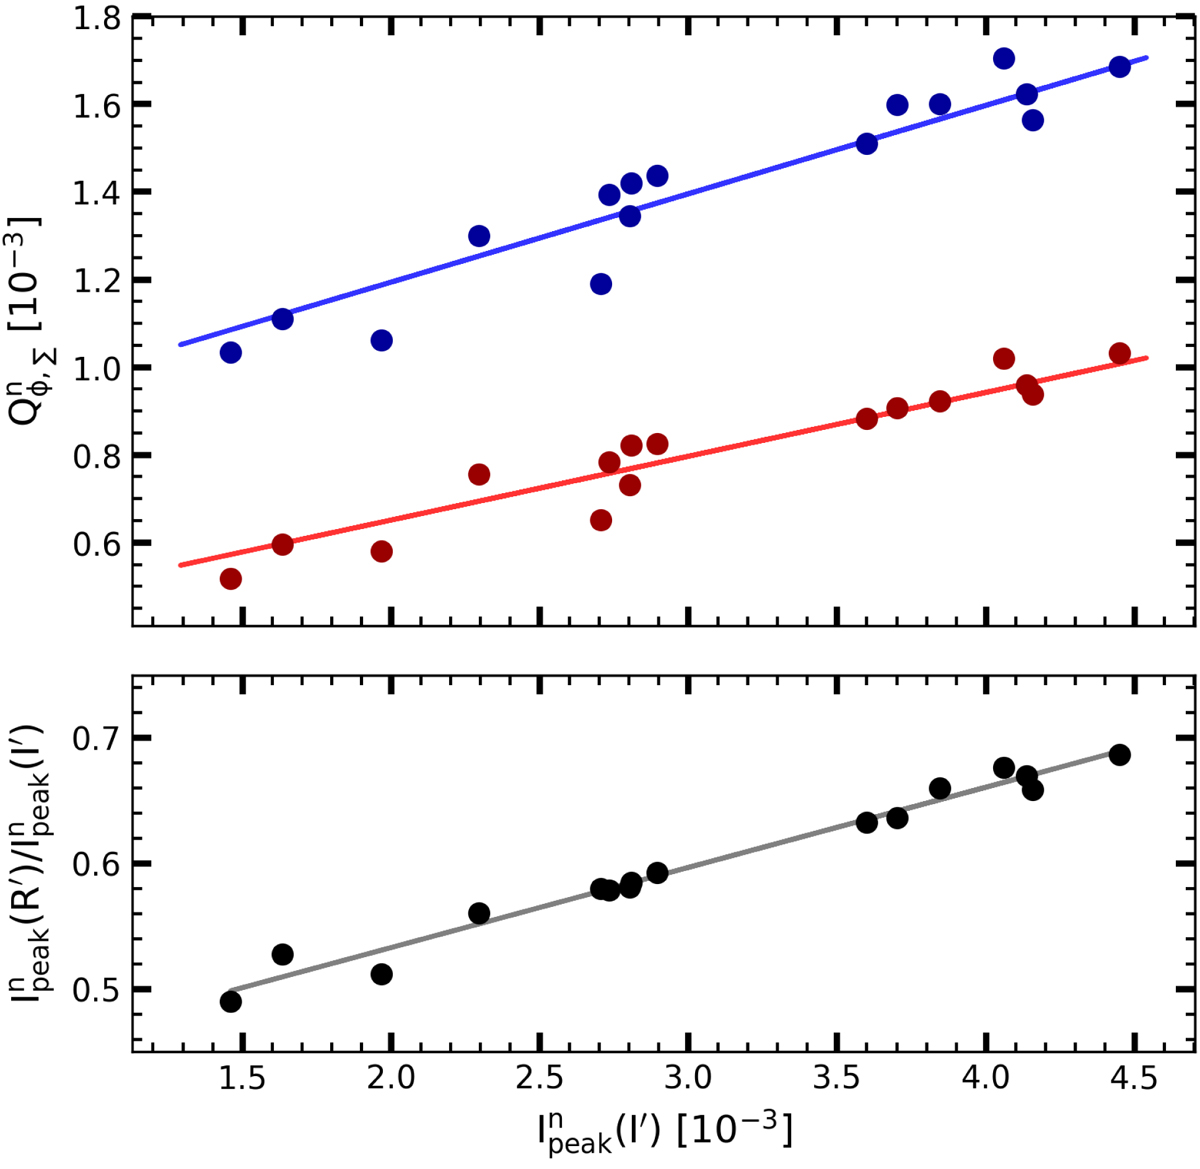
Correlations with the PSF peak quality ![]() . Top: correlation between the polarized flux
. Top: correlation between the polarized flux ![]() for the inner dust ring and the PSF peak
for the inner dust ring and the PSF peak ![]() for the R′(red) and I′(blue) band. Bottom: correlation of the ratio of peak intensities between the R′ and I′ band and the
for the R′(red) and I′(blue) band. Bottom: correlation of the ratio of peak intensities between the R′ and I′ band and the ![]() as an illustration of the stronger dependence of the PSF peak intensity in the R′ band on atmospheric conditions.
as an illustration of the stronger dependence of the PSF peak intensity in the R′ band on atmospheric conditions.
Current usage metrics show cumulative count of Article Views (full-text article views including HTML views, PDF and ePub downloads, according to the available data) and Abstracts Views on Vision4Press platform.
Data correspond to usage on the plateform after 2015. The current usage metrics is available 48-96 hours after online publication and is updated daily on week days.
Initial download of the metrics may take a while.