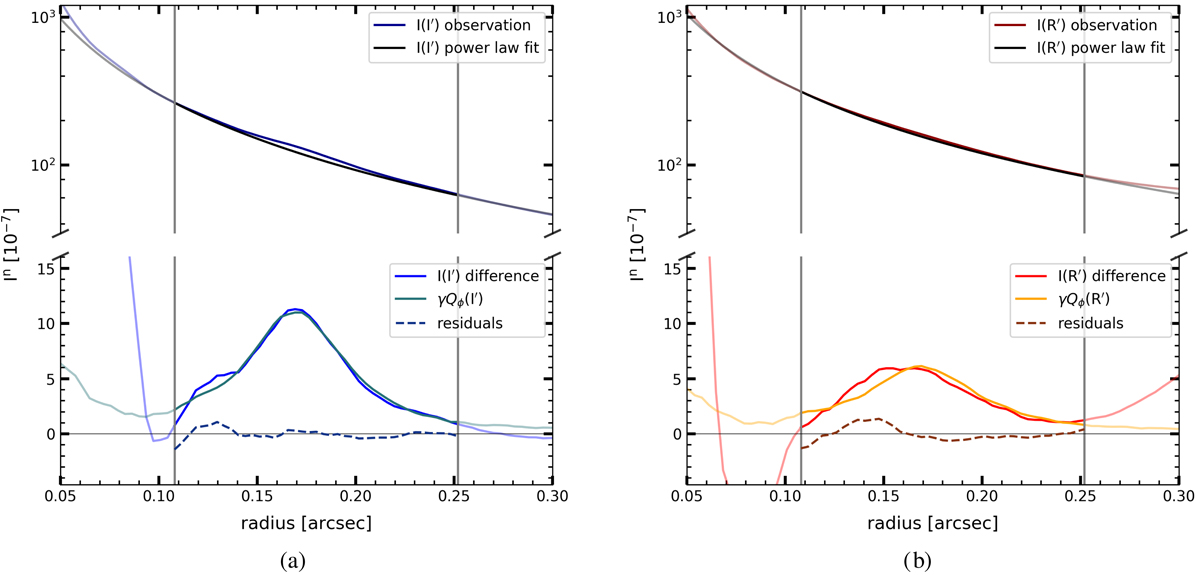
Fig. 9.
Download original image
Azimuthally averaged intensity profiles of HD 169142 showing the difference between the stellar PSF and the disk. Upper panels: radial profiles for the I′ band (left) and the R′ band (right) for the observed intensity Itot(r) and the best power-law fit for the stellar PSF I⋆(r). Bottom panels: profiles for the best fitting disk intensity model Id(r) = γQϕ(r), together with the difference Itot(r)−I⋆(r) and the fit residuals (dashed lines). The MCMC fit optimization range is between 30 px (0.108″) and 70 px (0.252″), as indicated by the vertical lines.
Current usage metrics show cumulative count of Article Views (full-text article views including HTML views, PDF and ePub downloads, according to the available data) and Abstracts Views on Vision4Press platform.
Data correspond to usage on the plateform after 2015. The current usage metrics is available 48-96 hours after online publication and is updated daily on week days.
Initial download of the metrics may take a while.