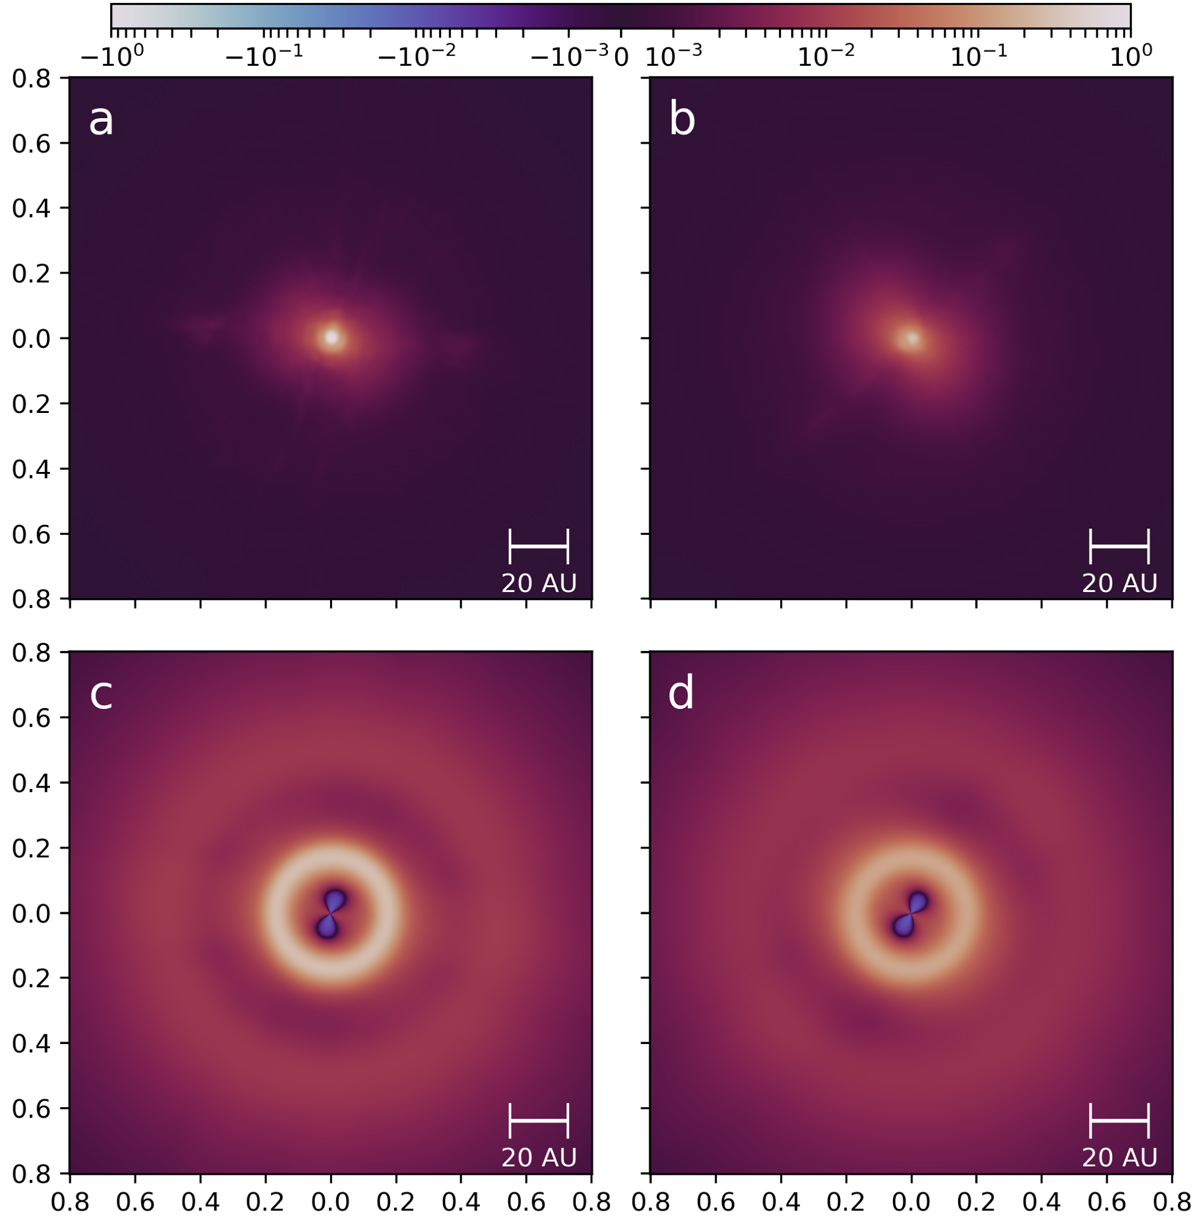
Fig. B.1.
Download original image
I′-band PSF variations in the HD 169142 observations on July 9, 2015, and impact on the Qϕ simulation. The top row shows the best cycle PSF (a) and the worst cycle PSF (b). Both are divided by the maximum of the best cycle PSF. The bottom row illustrates the Qϕ model (normalized to 1) given in Fig. 6 (c) convolved with the best PSF (d) and the worst PSF (j).
Current usage metrics show cumulative count of Article Views (full-text article views including HTML views, PDF and ePub downloads, according to the available data) and Abstracts Views on Vision4Press platform.
Data correspond to usage on the plateform after 2015. The current usage metrics is available 48-96 hours after online publication and is updated daily on week days.
Initial download of the metrics may take a while.