| Issue |
A&A
Volume 651, July 2021
|
|
|---|---|---|
| Article Number | A117 | |
| Number of page(s) | 21 | |
| Section | Extragalactic astronomy | |
| DOI | https://doi.org/10.1051/0004-6361/202140483 | |
| Published online | 29 July 2021 | |
A systematic study of silicate absorption features in heavily obscured AGNs observed by Spitzer/IRS
1
Graduate School of Science, Nagoya University, Furo-cho, Chikusa-ku, Nagoya, Aichi 464-8602, Japan
e-mail: This email address is being protected from spambots. You need JavaScript enabled to view it.
2
Institute of Liberal Arts and Sciences, Tokushima University, 1-1 Minami-Jyosanjima, Tokushima-shi, Tokushima 770-8502, Japan
3
Institute of Space and Astronautical Science, Japan Aerospace Exploration Agency, 3-1-1 Yoshinodai, Chuo-ku, Sagamihara, Kanagawa 252-5210, Japan
4
Department of Astronomy, Kyoto University, Kitashirakawa-Oiwake-cho, Sakyo-ku, Kyoto 606-8502, Japan
5
Academia Sinica Institute of Astronomy and Astrophysics, 11F of Astronomy-Mathematics Building, AS/NTU, No.1, Section 4, Roosevelt Road, Taipei 10617, Taiwan
6
Research Center for Space and Cosmic Evolution, Ehime University, 2-5 Bunkyo-cho, Matsuyama, Ehime 790-8577, Japan
Received:
3
February
2021
Accepted:
7
May
2021
Abstract
Context. Heavily obscured active galactic nuclei (AGNs) are known to show deep silicate absorption features in the mid-infrared (mid-IR) wavelength range of 10–20 μm. The detailed profiles of the features reflect the properties of silicate dust, which are likely to include information on AGN activities obscured by large amounts of dust.
Aims. We reveal AGN activities obscured by large amounts of dust through the silicate dust properties obtained from the mid-IR spectral bands.
Methods. We selected 115 mid-IR spectra of heavily obscured AGNs observed by Spitzer/IRS and systematically analyzed the composition of silicate dust by spectral fitting using the 10 μm amorphous and 23 μm crystalline bands.
Results. We find that the main component of the silicate dust obscuring AGNs is amorphous olivine, the median mass column density of which is one order of magnitude higher than those of the minor components of amorphous pyroxene and crystalline forsterite. The median mass fraction of the amorphous pyroxene, ∼2%, is significantly lower than that of the diffuse interstellar medium (ISM) dust in our Galaxy, while the median mass fraction of the crystalline forsterite, ∼6%, is higher than that of the diffuse ISM dust. We also find that the mass fractions of the amorphous pyroxene and the crystalline forsterite positively correlate with each other.
Conclusions. The low mass fraction of the amorphous pyroxene suggests that the obscuring silicate dust is newly formed, originating from starburst activities. The relatively high mass fraction of crystalline forsterite implies that the silicate dust is processed in the high temperature environment close to the nucleus and transported to outer cooler regions by molecular outflows. The positive correlation between the mass fractions can be naturally explained considering that amorphous pyroxene is transformed from crystalline forsterite by ion bombardments. We also find that spectra with high ratios of the H2O ice absorption to silicate mass column density tend to indicate low mass fractions of amorphous pyroxene and crystalline forsterite, which is consistent with the scenario of the thermal dust processing close to the nucleus.
Key words: dust, extinction / infrared: galaxies / galaxies: nuclei
© ESO 2021
1. Introduction
The central engine of an active galactic nucleus (AGN) is considered to be surrounded by thick gas and dust, which have a toroidal structure predicted by the classical unified model (Antonucci 1993; Urry & Padovani 1995). Near-infrared to mid-infrared (mid-IR) and hard X-ray observations over the last two decades have revealed the existence of several galaxies harboring AGNs despite no optical signatures of AGN (e.g., Imanishi & Dudley 2000; Risaliti et al. 2000). The hidden AGNs are heavily obscured by such dense gas and dust from which ionizing photons cannot escape in the nuclear region, and thus the narrow line region (NLR), which is an ionized polar region emitting optical lines, is not considered to be developed (e.g., Imanishi et al. 2006). The standard supermassive black hole (SMBH) and galaxy co-evolutionary scenario predicts that heavily obscured AGNs are in an early phase of SMBH growth (Hopkins et al. 2008). Therefore, in order to understand the AGN evolution, it is important to study the nature of the heavily obscured AGN activities and the obscuring material.
Amorphous silicate is a major component of the interstellar dust (Mathis et al. 1977), the band features of which peak at the mid-IR wavelengths of ∼10 and ∼18 μm in Si-O stretching and O-Si-O bending modes, respectively. These bands with the absolute value of the silicate strength > 1 are seen in 97 out of 196 mid-IR spectra of nearby AGNs and ultra-luminous IR galaxies (ULIRGs; Hao et al. 2007). In particular, owing to the large samples observed by Spitzer/IRS (Houck et al. 2004), mid-IR properties of low-redshift AGNs (z < 1) have been studied well (e.g., Weedman et al. 2005; Hao et al. 2007; Imanishi et al. 2007; Spoon et al. 2007). In these studies, the strengths of the silicate features at the peak wavelengths were often analyzed, from which it was found that the silicate features in QSOs or type-1 AGNs are observed in emission or weak absorption, while those in type-2 AGNs are only observed in absorption (e.g., Hao et al. 2007; Spoon et al. 2007; Hatziminaoglou et al. 2015). The silicate features in heavily obscured AGNs tend to show deep absorption, the optical depths of which are greater than 2 (e.g., Hao et al. 2007; Imanishi et al. 2007). In general, the strengths of the silicate features depend on the geometrical structure of obscuring clouds along the line of sight, while their profile shapes reflect the dust properties, such as chemical composition and crystallinity (Henning 2010). For example, the peaks of the 10 μm silicate emission features in the spectra of QSOs and type-1 AGNs are known to shift toward longer wavelengths than that of typical amorphous silicate, which is explained by higher porosity (Li et al. 2008), a larger size of dust (Smith et al. 2010), or other dust components (Markwick-Kemper et al. 2007; Srinivasan et al. 2017).
In the Circinus galaxy, a famous type-2 AGN, crystalline silicate is detected with ground-based telescopes, showing that the crystallinity is similar to that of the diffuse interstellar medium (ISM) silicate in our Galaxy (Duy & Lawson 2019). On the other hand, Spoon et al. (2006) find that 12 ULIRGs with deep silicate absorption features in the mid-IR spectra have silicate dust with a higher crystallinity than the diffuse ISM silicate dust in our Galaxy. Spoon et al. (2006) suggest that the high crystallinity originates from starburst activities, while Kemper et al. (2011) predict that the high crystallinity nature needs an additional source producing a crystalline silicate other than starburst activities.
Tsuchikawa et al. (2019) investigate the profile shapes of the 10 μm silicate features in 39 heavily obscured AGNs observed by AKARI/IRC and Spizter/IRS, and they find that the profile shapes are notably similar as a whole. Nevertheless, they also find that the profile shapes are different in the wing on the shorter wavelength side, which indicates the variation in the mineralogical composition of silicate dust from galaxy to galaxy. In this paper, we systematically quantify the detailed differences in the silicate features in heavily obscured AGNs and determine the dust properties for each galaxy. Using the dust properties thus obtained, we aim to reveal obscured AGN activities and the surrounding environments.
2. Sample selection
We use mid-IR spectra observed by the Infrared Spectrograph (IRS; Houck et al. 2004) aboard the Spitzer Space Telescope (Werner et al. 2004). IRS low-resolution (LR) spectra were observed using two spectroscopic modules (Short-Low; SL, Long-Low; LL), covering the wavelength ranges of 5.2–14.5 and 14.0–38.0 μm, and therefore we can study both the silicate 10 and 18 μm features for low-redshift galaxies. The spectroscopic data were retrieved from the Cornell AtlaS of Spitzer/IRS Sources (CASSIS; Lebouteiller et al. 2011, 2015) version LR7 which contains more than 10 000 LR spectra. The CASSIS provides the spectra reduced by the two spectral extraction techniques which are the optimal extraction for point-like sources and the tapered column extraction for partially-extended sources. We selected either of the two spectral extraction methods for each spectrum according to the pipeline message based on the source spatial extent. Most of the spectra retrieved from CASSIS show discontinuity in the flux density between the SL and LL spectra, which is mainly caused by a difference in the extraction aperture and slit width between the SL and LL modules, and thus we performed a spectral stitching by scaling the SL spectra.
Among the spectra of extragalactic sources in CASSIS, which we searched for according to the science category of the approved Spitzer programs, we retrieved those with apparently deep silicate absorption features. We selected 115 obscured AGNs using the following three selection criteria from the sample retrieved from CASSIS: (1) the apparent peak optical depth of the 10 μm silicate feature is larger than 1.5. The apparent peak optical depth is defined by −ln(fobs(10 μm)/fcont(10 μm)), where fobs(10 μm) and fcont(10 μm) are an observed flux density and absorption-free continuum flux density, respectively, both at the peak wavelength of the 10 μm silicate feature (Spoon et al. 2007). The absorption-free continuum is assumed to be the power-law function determined from the flux densities at 7.1 and 14.2 μm, following the method defined by Imanishi et al. (2007), for example. Since some spectra showed low signal-to-noise ratios (S/N) at the bottom of the 10 μm silicate feature, we performed spectral binning so that S/N at 10 μm exceeded 5, and then we calculated the apparent optical depth of the 10 μm silicate feature at the peak wavelength. (2) The equivalent width of the polycyclic aromatic hydrocarbon (PAH) 6.2 μm feature is smaller than 270 nm, by which we can select AGN-dominated galaxies (Stierwalt et al. 2013). We calculated the equivalent width by integrating the flux densities above the power-law local continuum determined from the flux densities at 6.0 and 6.45 μm (e.g., Imanishi et al. 2007). By this criterion, we analyzed the silicate features robustly with less contamination of the PAH emission. Fifty-one sources which meet criteria (1) and (3) were removed out of 166 based on criterion (2). (3) The redshift z is lower than 0.35. The spectra of low-redshift galaxies selected by the criterion cover both silicate 10 and 18 μm features. Table 1 summarizes the general properties of the 115 obscured AGNs selected by the above three criteria. Although IRAS 13454−2956N, WISEA 142500.11+325949.9, and WISEA J231813.00−004125.9 meet all the three selection criteria, we excluded them from our sample because the spectral data of one of the orders in the LR module are not available. IRAS 16255+2801 is confused with a planetary nebula in our Galaxy, and hence it is also excluded from our sample.
General properties of our sample.
3. Spectral decomposition of the 10 μm silicate feature
3.1. Mid-IR spectral modeling
In order to investigate the dust properties, we decomposed the 10 μm silicate feature in our sample by spectral fitting in the wavelength range of 5.3–12 μm, where we assumed the screen geometry for simplicity. The fitting function, Fν, can be described as
 (1)
(1)
where Fhot, AGN, FPAH, Fline, and Fhot, unobs are the absorption-free continuum emission due to the hot dust heated by AGN, PAH, and line emissions and an additional continuum emission due to unobscured hot dust, respectively. Furthermore, τsil and τice + HAC are the optical depths of silicate dust and water ice plus hydrogenated amorphous carbon (HAC).
In the spectral fitting, we had to accurately determine Fhot, AGN in order to extract the properties of silicate dust. Tsuchikawa et al. (2019) reproduced the 2.5–12.5 μm spectrum of the heavily obscured AGN LEDA 1712304 well by a single-temperature blackbody emission as an absorption-free continuum, while the spectra in our sample are expected to be poorly fitted by the same model used in Tsuchikawa et al. (2019) due to the variety of the spectra. Spoon et al. (2006) adopted the spline continuum using the pivot points anchored at the wavelengths of 5.6, 7.1 μm, and the longer wavelength end of the spectra, and, for feature-less spectra, they replaced the anchor point at 7.1 μm by the continuum at 7.9–8.0 μm. The method can be considered as good estimates for feature-less spectra, as shown in Fig. 1 of Spoon et al. (2006), while it does not match the spectra with other prominent spectral features such as those due to PAHs and ices in the wavelength range of 5–8 μm. Nardini et al. (2010) report that the 5–8 μm spectra of 164 ULIRGs, covering 68 spectra in our sample, are reproduced well using a power-law function as an absorption-free continuum. Therefore we reproduced the absorption-free continuum using a power-law function at 5.3–8 μm and a spline curve smoothly connected to the longer wavelength end of the spectrum. The spline curve was determined by using the pivot points anchored at 7.1 and 7.5 μm on the power-law continuum and 30 and 31 μm on the observed spectrum. The dashed lines in the left panel of Fig. 1 show three examples of the absorption-free continua obtained by the 5.3–12 μm spectral fitting. The sample objects whose redshifts are larger than 0.3 are not observed at the rest wavelength range longer than 30 μm, and thus the pivot points at 30 and 31 μm were extrapolated from the observed spectra assuming a power-law function.
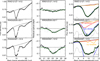 |
Fig. 1. Examples of the 5.3–12 μm spectral fitting. Left panels: retrieved mid-IR spectra and the estimated absorption-free continua. Middle panels: Gaussian fits to the 23 μm features. Results of the 5.3–12 μm spectral fitting are shown in the right panels in which the green solid lines show the best-fit models, the absorption components of which are composed of amorphous pyroxene (red lines; Fhot, AGN exp(−τpyr) in Eq. (1)), amorphous olivine (blue lines; Fhot, AGN exp(−τol)), and crystalline forsterite (orange lines; Fhot, AGN exp(−τcry)). Also, the black dashed, dotted, and gray solid lines represent the absorption-free continuum (Fhot, AGN), the unobscured continuum (Fhot, unobs), and the PAH and line emission (FPAH + Fline) components, respectively. We note that the unobscured continuum component falls below the plotted area for IRAS 12127−1412 and IRAS 02530+0211. |
The optical depth of the 10 μm silicate feature, τsil, is composed of three dust species using the following equation:
 (2)
(2)
where Ni and κi are the mass column density and the mass absorption coefficient (MAC) of each silicate dust component, respectively. We reproduced the absorption features due to water ice at 6 μm and hydrogenated amorphous carbon (HAC) at 6.85 and 7.25 μm considering a screen geometry that the hot dust in the nuclear region is covered with colder dust clouds with water ice and HAC. For water ice and HAC opacity models, we used the template derived from the spectrum of the deeply obscured ULIRG IRAS F00183−7111 in Marshall et al. (2007) and a Gaussian function, respectively. However, the water ice template cannot reproduce some of the spectra in our sample well, as is also pointed out in Nardini et al. (2008). For example, the spectrum of IRAS 12127−1412 shows a broader absorption feature, which extends to ∼7.5 μm, than that of IRAS F00183−7111. The difference in the absorption feature is likely to be caused by complex compositions of processed ices including other organic species (Boogert et al. 2015). Thus we added other templates of water ice as additional absorption components derived from the spectra of IRAS 12127−1412 and NGC 4418, which show little PAH emission similar to that of IRAS F00183−7111, by spline interpolation to estimate an absorption-free continuum. For the HAC absorptions, we fixed the full width at half-maxima (FWHMs) at 0.17 μm and the central wavelengths at 6.85 and 7.25 μm. We applied the Draine & Li (2007) model to the PAH emission, FPAH, assuming the typical size distribution of the diffuse ISM of star-forming galaxies. The ionization fraction of PAHs was set to be free considering different radiation fields in the circumnuclear environments, as mentioned in Kaneda et al. (2008) for elliptical galaxies. We find an emission feature at 10.68 μm that is stronger than those predicted by the Draine & Li (2007) model, which is suggested to originate from dehydrogenated PAHs (Mackie et al. 2015). Hence we considered an additional emission component using a Drude function, both the FWHM and central wavelength were fixed according to the resonance parameter shown in Draine & Li (2007). We also considered the interstellar extinction on the PAH emission assuming the well-mixed geometry, where we adopted the extinction curve described in Chiar & Tielens (2006). A Gaussian function was assumed for the profiles of atomic and molecular line emission components, Fline, both widths and central wavelengths of which were fixed at the typical parameters described in Marshall et al. (2007). Tsuchikawa et al. (2019) also suggest that the sharpness of the 10 μm silicate feature of heavily obscured AGNs is variable from galaxy to galaxy, which is likely to be attributed to the saturation by an unobscured emission component. Therefore, we added a continuum emission component of unobscured hot dust, Fhot, unobs, using the spectral profile of Fhot, AGN in order to explain the difference in the sharpness1.
3.2. Dust properties
We decomposed τsil to three dust components, amorphous olivine (Mg2xFe2(1−x)SiO4), amorphous pyroxene (MgxFe1-xSiO3), and crystalline forsterite (Mg2SiO4). Amorphous olivine, the main component of the diffuse ISM in our Galaxy (Draine 2003), is reported to reproduce the 10 μm feature of heavily obscured AGNs well (Spoon et al. 2006; Tsuchikawa et al. 2019). Crystalline forsterite is also known to compose the silicate dust in heavily obscured AGNs on the basis of detections of absorption features at 11, 16, 19, and 23 μm (Spoon et al. 2006; Stierwalt et al. 2014). Tsuchikawa et al. (2019) report that the wings of the 10 μm silicate absorption features shown in the spectra of the heavily obscured AGNs significantly vary from galaxy to galaxy, especially on the shorter wavelength side. In other words, the central wavelengths of the 10 μm features are variable among the heavily obscured AGNs. The difference is likely to be caused by a mineralogical composition ratio of amorphous olivine and pyroxene since the absorption efficiencies of amorphous olivine and pyroxene have different peak wavelengths of ∼9.8 and ∼9.3 μm, respectively (Dorschner et al. 1995). Accordingly, we also consider an amorphous pyroxene component in the spectral fitting.
The MACs of amorphous olivine and amorphous pyroxene, κol and κpyr, are represented by 3Qabs, ol/4aρol and 3Qabs, pyr/4aρpyr, respectively, assuming a spherical homogeneous dust grain. The dust size, a, was fixed at 0.1 μm, and the absorption coefficients, Qabs, ol and Qabs, pyr, were calculated from the optical constants of amorphous olivine (MgFeSiO4) and amorphous pyroxene (Mg0.5Fe0.5SiO3) obtained by the laboratory measurement of Dorschner et al. (1995) according to the Mie theory (Bohren & Huffman 1998). The mass densities of amorphous olivine and pyroxene, ρol and ρpyr, are 3.71 and 3.20 g cm−3, respectively (Dorschner et al. 1995). We used κcry of free-flying crystalline forsterite in aerosol measured by Tamanai et al. (2006), the peak wavelengths of which are known to be consistent with the crystalline forsterite features observed in our Galaxy (Wright et al. 2016). The measurements using the aerosol technique are not quantitative, and hence we normalized κcry measured by Tamanai et al. (2006) assuming κcry(23 μm) = 3.7 × 103 cm2 g−1 (Fabian et al. 2001).
The 11 μm crystalline feature is easily affected by the PAH emission feature at 11.3 μm, and hence it is hard to derive the crystallinity robustly by decomposing the 11 μm crystalline feature from the 10 μm amorphous feature. On the other hand, we clearly detected the 23 μm crystalline feature without being affected by the PAH emission, which is also pointed out in Stierwalt et al. (2014). Therefore we fixed Ncry in the spectral fitting using the information on the 23 μm crystalline feature, which was determined by spectral fitting of the 23 μm feature with a Gaussian function (see the middle panel of Fig. 1). The absorption-free continuum for the 23 μm feature was assumed using a spline curve, the pivot points of which were anchored at 20, 21, 25.5, and 30 μm. The central wavelength was restricted to the wavelength range of 23.0–23.5 μm. In addition, as seen in the 16, 19, and 23 μm crystalline features in Fig. 5 of Spoon et al. (2006), the crystalline features at longer wavelengths tend to show smaller apparent optical depths in the spectra of ULIRGs contrary to the laboratory measurements of κcry, which is probably caused by the radiative transfer effects or the dilution by continuum emission from cold dust. Hence we estimated Ncry for all the objects in our sample by calculating CFI08572 × τcry(23 μm)/κcry(11 μm), where CFI08572 is defined as τcry, I08572(11 μm)/τcry, I08572(23 μm) and obtained from the spectral decomposition of the 10 μm silicate feature of IRAS 08572+3915 which shows little PAH emission.
It is difficult to obtain the uncertainty of the correction by CFI08572 because the crystalline features at ∼9.8 and ∼11.1 μm are diluted in almost all the sample spectra. On the other hand, the crystalline feature at ∼16 μm is not diluted much, and thus we investigated τ(16 μm)/τ(23 μm), instead of τ(11 μm)/τ(23 μm), for 12 sources shown in Spoon et al. (2006). From Fig. 4 in Spoon et al. (2006), the mean and standard deviation of the τ(16 μm)/τ(23 μm) are found to be 1.71 and 0.46, respectively, and the value of τ(16 μm)/τ(23 μm) for IRAS 08572+3915 is 1.46. We investigated the effect of the difference between 1.71 and 1.46 on the 5.3–12 μm spectral fitting, assuming Ncry 1.71/1.46 times larger. As a result, the results of the fits for all the sample did not change significantly with a significance level of 5% by the F-test. Therefore we conclude that the uncertainty of the correction by CFI08572 does not affect the results of the 5.3–12 μm spectral fitting significantly.
3.3. Fitting procedure
We performed the spectral fitting in the following four steps, in which we used the Levenberg–Marquardt algorithm (Levenberg 1944); marquardt for the χ2 minimization: (1) we determined the amplitudes of line emissions by spectral fitting for a narrow wavelength range assuming a quadratic function as a local continuum, and then we fixed those parameters in the subsequent procedure. (2) We tentatively fit the spectrum of the wavelength range of 5.3–7.8 μm to obtain initial parameters for the following fitting processes. As for the fitting function, we assumed Eq. (1) setting τsil and Fhot, unobs to zero as the silicate feature is out of the wavelength range. Using the initial parameters thus obtained, we fit the spectrum of the wavelength range of 5.3–12 μm. (3) We obtained CFI08572 (defined in the previous subsection) by fitting the 5.3–12 μm spectrum of IRAS 08572+3915 with Eq. (1) where free parameters are the mass column density of crystalline forsterite, Ncry, as well as the parameters in Table 2. (4) We derived the properties of dust through the 5.3–12 μm spectral fitting to all the sample spectra. The free parameters are the same as in step (3), except that Ncry was fixed at CFI08572 × τcry(23 μm)/κcry(11 μm).
Free parameters in the 5.3–12 μm spectral fitting to all the sample spectra.
The right panel of Fig. 1 shows examples of the results of the spectral decomposition (see Appendix B for all the sample galaxies). Although 20% of the fits to the spectra, which have a high signal-to-noise ratio, are not acceptable on the basis of the χ2 statistics with a significance level of 0.05, which is possibly mainly caused by neglecting the uncertainties of the absorption efficiency and the PAH model, the model is overall fitted to the spectra in our sample well enough to characterize the mineralogical composition and crystallinity. The uncertainties of the fitting parameters were obtained by the Monte Carlo method of fitting 100 spectra with Gaussian noises.
We consider whether a good fit can be achieved with significantly different sets of parameters in terms of parameter degeneracies. The spectral profile of the silicate absorption feature was determined by the mass ratio of amorphous olivine to pyroxene, fol/pyr = Nol/Npyr, and the ratio of the unobscured to absorption-free continua, funobs = Ahot, unobs/Ahot, AGN. We investigated the Δχ2 distribution within the parameter ranges of fol/pyr = [0, ∞] and funobs = [0, 1]. In this analysis, free parameters are the total mass column density of silicate dust and the normalization of the continuum emission. On the other hand, we fixed the parameters of the power-law index of the continuum emission; the mass column density of crystalline forsterite; the amplitudes of the ice and HAC absorption templates; and all the parameters associated with the PAH emission since they are determined, almost uniquely, based on the information outside the wavelength range of 8–12 μm and on the narrow PAH emission feature at 11.3 μm. From the Δχ2 distribution thus obtained, we confirm that the different sets of the parameters do not produce a significant fit in the spectral fitting for all the sample spectra.
4. Results
In Fig. 2, we show the histograms of the mass column densities of amorphous olivine, Nol, amorphous pyroxene, Npyr, and crystalline forsterite, Ncry, obtained by the spectral fitting. We summarize the median values and the 25th and 75th percentiles in Table 3 (see Appendix B for all the sample galaxies). The histogram of Nol in our sample shows a relatively symmetric distribution centered around 1.7 × 10⁻³ g cm−2, which corresponds to the peak optical depth of 5.5 for the 10 μm feature. On the other hand, the histograms of Npyr and Ncry show asymmetric distributions with tails at larger column densities. Furthermore, we find that the sample galaxies have Nol more than one order of magnitude higher than Npyr and Ncry on average, and hence amorphous olivine is likely to be the main component of the silicate dust obscuring AGNs.
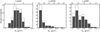 |
Fig. 2. Histograms of the mass column densities of amorphous olivine (Nol; left), amorphous pyroxene (Npyr; center), and crystalline forsterite (Ncry; right). The optical depths at the peak wavelengths corresponding to the mass column densities are shown in the upper x-axes. The peak wavelengths used for calculating the optical depths of amorphous olivine, amorphous pyroxene, and crystalline forsterite are 9.8, 9.2, and 11.0 μm, respectively. Black and white bars indicate the sources whose 5.3–12 μm spectral fits are accepted and those rejected, respectively, on the basis of the χ2 statistics with a significance level of 0.05. |
General properties of the silicate dust in our sample AGNs.
We derived the abundances of the minor components by calculating the mass fractions Npyr/Nall and Ncry/Nall, where Nall = Nol + Npyr + Ncry. In Fig. 3, we show the histograms of the resultant Npyr/Nall and Ncry/Nall and summarize their median fractions and 25th and 75th percentiles in Table 3. We find that more than half of our sample have Npyr/Nall < 5%, while 10% of our sample have relatively high values of Npyr/Nall > 15%. The histogram of Ncry/Nall shows a relatively uniform distribution from 0 to 13%. Figure 3 also shows the presence of a significant relationship between Ncry/Nall and Npyr/Nall, which indicates that the mass fractions of the minor components positively correlate to each other. On the other hand, Npyr/Nall and Ncry/Nall do not correlate to the equivalent width of the PAH feature at 6.2 μm nor the total optical depth of silicates with a significance level of 0.01.
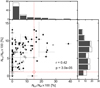 |
Fig. 3. Correlation plot between Ncry/Nall and Npyr/Nall and their histograms. Filled and open black squares show the objects whose 5.3–12 μm spectral fits are accepted and those rejected on the basis of the χ2 statistics with a significance level of 0.05, respectively. Black and white bars in the histograms also indicate the sources in which the spectral fits are accepted and rejected, respectively. The correlation coefficient and the p-value for the accepted sample are shown at the bottom right corner of the correlation plot. Red diamond and dotted lines show the silicate dust properties obtained from the Sgr A* spectrum, a typical spectrum of the diffuse ISM in our Galaxy (Kemper et al. 2004). |
5. Discussion
5.1. Properties of silicate dust in heavily obscured AGNs compared with those in our Galaxy
The mineralogical composition in our Galaxy is observationally known to be variable depending on the environments where silicate dust exists. Demyk et al. (2001) suggest the evolution of amorphous silicate from newly formed amorphous olivine around evolved stars to amorphous pyroxene around young stars. Indeed, the 10 μm features of newly formed dust observed around evolved stars are fitted well with amorphous silicate with olivine-type stoichiometry (e.g., Demyk et al. 2000; Do-Duy et al. 2020), while a typical spectrum of the diffuse ISM requires a small mass fraction of amorphous pyroxene (olivine:pyroxene = 85:15 for the Sgr A* spectrum; Kemper et al. 2004). Furthermore, it is suggested that the pyroxene mass fractions in molecular clouds and circumstellar regions of young stellar objects (YSOs) are higher than those of the diffuse ISM dust (e.g., Demyk et al. 1999; Van Breemen et al. 2011; Do-Duy et al. 2020). Amorphous pyroxene is reported to be transformed from crystalline forsterite by ion irradiation (Demyk et al. 2001; Rietmeijer 2009), and thus the ion bombardments can explain the evolution of amorphous silicate. Pyroxene-type equilibrated dust is also formed from the ISM dust by vaporization and recondensation in dense and hot environments of circumsteller disks of YSOs (Gail 2004). We show the pyroxene mass fraction of silicate dust toward Sgr A* as a red vertical dotted line in the histogram of Fig. 3, indicating an overall lower mass fraction of the amorphous pyroxene in the heavily obscured AGNs than that in the typical diffuse ISM in our Galaxy. Accordingly, the silicate dust obscuring AGNs is likely to consist of newly formed dust originated from circumnuclear starburst activities.
In general, the crystallinity is known to be high in winds from evolved stars (10–15%; e.g., Kemper et al. 2001; Molster et al. 2002) and circumstellar regions surrounding YSOs (∼15%; e.g., van Boekel et al. 2005; Sargent et al. 2009). On the other hand, crystalline silicate dust is almost absent in the diffuse ISM and molecular clouds (∼1–2%; e.g., Kemper et al. 2004; Van Breemen et al. 2011; Do-Duy et al. 2020), and hence it is suggested that amorphization by the ion bombardments is important (e.g., Demyk et al. 2001; Kemper et al. 2004). The high crystallinity of the silicate dust surrounding YSOs is considered to be caused by thermal annealing in the hot environment close to the central star (e.g., van Boekel et al. 2005; Sargent et al. 2009). The average crystallinity of ∼6% in the heavily obscured AGNs in Table 3 and Fig. 3 is closer to those of newly formed dust around the evolved stars rather than the diffuse ISM dust in our Galaxy. It is possible that the overall high crystallinity of the silicate dust obscuring AGNs originates from evolved massive stars in the starburst environments, as also mentioned in Spoon et al. (2006). The crystallinity is determined by the balance of dust production, amorphization, and destruction rates. Kemper et al. (2011) simulated whether starburst activities alone can explain the crystallinities of 6.5–13% suggested in Spoon et al. (2006), and they show that such a high crystallinity cannot be explained unless extreme input parameters are assumed for the star formation rate and the initial crystallinity in the stellar ejecta, for example. If a top heavy initial mass function (IMF; Zhang et al. 2018) is assumed instead of the IMF in, for example, Kroupa (2001), high crystallinity may be achieved temporarily because the starburst activity produces large amounts of dust on a shorter timescale than that for amorphization. We do not consider this possibility in the following discussion. Accordingly, in order to explain the overall trend of high crystallinity, we considered the recrystallization of amorphous silicate or the production of crystalline silicate other than starburst activities.
Although crystallization occurs in high-temperature environments at ∼1000 K, the crystalline silicate in heavily obscured AGNs is considered to be located in relatively outer cooler regions because we only detected the crystalline features in the absorption at the wavelength of 23 μm. For a recrystallization mechanism of amorphous silicate in cooler regions in heavily obscured AGNs, we considered a possibility of a localized crystallization due to a transient heating by shock waves (Harker & Desch 2002), driven by supernovae in the circumnuclear starburst and/or outflow if the shocks can anneal silicate dust up to ∼1000 K. Because the chemical equilibrium cannot be achieved by a short annealing time typical of the shock heating, crystalline enstatite, the Mg end member of pyroxene is unlikely to be formed (Gail 2004), which is consistent with the spectral characteristics of our sample spectra. Ions accelerated in shock wave propagation and cosmic rays, which are considered to be accelerated in the shock front (e.g., Bell 1978), can destroy the crystalline structure of silicate dust (Demyk et al. 2001), which negatively acts for the enrichment of the crystalline silicate. Therefore we consider that the localized crystallization due to a transient heating by shock waves has a hard time causing high crystallinity.
Another possibility is that the crystalline silicate is produced or processed in the high temperature environments close to the nucleus and transported to an outer cooler region by radial mixing or outflow. Indeed, Markwick-Kemper et al. (2007) report the emission feature due to crystalline forsterite in a quasar wind spectrum. However, Spoon et al. (2006) conclude that this possibility is unlikely because of the following two reasons. The first being that a crystalline feature is not detected in the central 2 pc of NGC 1068 in the mid-IR interferometric observation in Jaffe et al. (2004). Raban et al. (2009) report the follow-up observation of NGC 1068 with a different position angle and longer baseline length than those in Jaffe et al. (2004). We find that the 11 μm crystalline feature is significantly detected in the mid-IR spectra shown in Raban et al. (2009), although Raban et al. (2009) do not mention the crystalline feature. Hence the crystallinity of the central region of NGC1068 rather supports the picture that a crystalline silicate originates from AGNs. The other reason is that we have to newly introduce a large-scale transportation mechanism itself. Recent dynamical views of an AGN torus (e.g., Wada 2012) are likely to explain large-scale transportation. Indeed, molecular outflows have been observed in nearby obscured AGNs, including several objects in our sample in recent years (e.g., Aalto et al. 2012; Veilleux et al. 2013; Lutz et al. 2020). For example, NGC 1377 in our sample is known to have a 150 pc-scale molecular outflow. The large mass outflow rate suggests the presence of a feedback loop of cyclic outflow (e.g., Aalto et al. 2020). The projected size of the 800 μm nuclear dust continuum of NGC 1377 is observed to be ∼4 pc (Aalto et al. 2020). The timescale for amorphization due to the cosmic-ray bombardment is estimated to be 70 Myr (Bringa et al. 2007). Thus the dust radial velocity needs to be faster than 0.05 km s−1, which is considerably slower compared to the outflow velocity of the molecular wind, 90 km s−1, measured by Aalto et al. (2020). Kozasa & Sogawa (1999) report that it takes only 30 days of processing into crystalline forsterite at the dust temperature of 1000 K, which is negligibly short. Thus it is possible that crystalline silicate processed around the nucleus is transported to outer regions by the feedback loop of outflow.
5.2. Origin of the difference in the silicate dust properties
In Fig. 3, we find the positive correlation between Ncry/Nall and Npyr/Nall, indicating that heavily obscured AGNs with a relatively higher mass fraction of the amorphous pyroxene, which deviate from the overall trend, show a higher mass fraction of the crystalline forsterite. According to the above discussion, the amorphous olivine, the main component of silicate obscuring AGNs, is crystallized by the thermal annealing close to the nucleus and transported to the outer region. The mass fraction of the crystalline forsterite is likely to vary depending on the degree of the thermal processing or the radial transportation of silicate dust among the heavily obscured AGNs. Therefore, heavily obscured AGNs with high mass fractions for the crystalline forsterite naturally have high mass fractions of amorphous pyroxene, considering that crystalline forsterite is partially transformed to amorphous pyroxene by ion bombardments in and after the radial transportation to the outer cooler region as the main formation mechanism of amorphous pyroxene. For another formation mechanism, we considered that crystalline enstatite, which is likely to be formed from the ISM dust by vaporization and recondensation (Gail 2004) in the dense and hot nuclear environment, is processed to amorphous pyroxene by cosmic-ray bombardments. However, the spectral features of crystalline enstatite are not detected in the spectra of our sample and, therefore, we excluded this possibility. We also find that five out of 15 sources with a mass fraction of > 10% crystalline forsterite, which do not have a significant fraction of amorphous pyroxene, deviate from the trend of the positive correlation. Since the timescale for amorphization is considerably longer than that for the dust radial transportation as discussed in Sect. 5.1, crystalline forsterite is likely to amorphize mainly after the transportation. Hence, if we observe the sources just after the radial transportation started, the mass fraction of crystalline forsterite is likely to be high without producing a significant fraction of amorphous pyroxene. Accordingly, the difference in the silicate dust properties among the heavily obscured AGNs mainly originates from the difference in the degree of the AGN activities, that is, the thermal processing or the radial transportation.
We focused on the temperature of the circumnuclear region to confirm that the difference in Ncry/Nall and Npyr/Nall mainly originates from the difference in the degree of the thermal processing. In general, H2O ice, the sublimation temperature of which is 90 K (Tielens 2005), is assumed to exist in the mantle of dust in dense cold molecular clouds. Hence, for heavily obscured AGNs with deep ice absorptions at 3.0 and 6.0 μm, silicate dust in dense cold circumnuclear regions is likely to dominate the total silicate absorption along the line of sight. Icy dust is expected to exist in the relatively warm environment since the CO2 ice absorption feature at 15.0 μm, the sublimation temperature of which is 50 K (Tielens 2005), is not detected for most of the ULIRGs by Lahuis et al. (2007), in contrast to the detection of the 6 μm H2O ice feature. In our Galaxy, deep CO2 ice absorption features are observed in dense molecular clouds (Gibb et al. 2000), and thus we conclude that dense molecular clouds in the host galaxies do not contribute to the total column density of H2O ice. We calculated the ratio of the 6 μm optical depth of H2O ice to the total mass column density of silicate dust, τice(6 μm)/Nall, which likely depends on the average temperature of obscuring dust. In Fig. 4, we compare the silicate properties shown in Fig. 3 with τice(6 μm)/Nall, which indicates that the obscuring silicate dust in galaxies with high τice(6 μm)/Nall tends to be of low mass fractions of amorphous pyroxene and crystalline forsterite. Hence silicate dust obscuring AGNs with a high τice(6 μm)/Nall, which has a relatively low temperature, is considered to be processed less heavily. Assuming the nucleus as the heating source, cooler dust is located further from the nucleus, and therefore it is harder to be transported from the nucleus. This is consistent with the above discussion, and thus dust processing likely originates from the AGN activity.
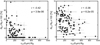 |
Fig. 4. Anticorrelations of τice(6 μm)/Nall with Ncry/Nall (left) and Npyr/Nall (right). The correlation coefficients and the p-values for the sample are shown in the top right corners. |
6. Conclusions
We investigate AGN activities obscured by large amounts of dust through a systematic study of silicate dust properties. We selected 115 mid-IR spectra of the heavily obscured AGNs observed by Spitzer/IRS, and characterized the silicate features by spectral fitting focusing on the mineralogical composition and crystallinity. As a result, we fit the spectra well using three dust components of amorphous olivine, amorphous pyroxene, and crystalline forsterite. We find that the main component of silicate dust obscuring AGNs is amorphous olivine, the average mass column density of which is one order of magnitude higher than those of amorphous pyroxene and crystalline forsterite. We also find that the mass fractions of amorphous pyroxene and crystalline forsterite significantly correlate to each other.
The overall dust properties of heavily obscured AGNs tend to be of a lower mass fraction of the amorphous pyroxene and of a higher mass fraction of the crystalline forsterite than those of the diffuse ISM in our Galaxy. The overall trend of the low mass fraction of the amorphous pyroxene suggests that silicate dust that newly formed in starburst activities is abundant for the obscuring silicate dust. The overall trend of high crystallinity and the fact that crystalline features are seen only in the absorption suggest that amorphous silicate is thermally processed close to the nucleus and radially transported to an outer cooler region. Considering that amorphous pyroxene can be transformed from crystalline forsterite by ion bombardments, we can explain the positive correlation between the amorphous pyroxene and crystalline forsterite mass fractions. Therefore the difference in the dust properties among the heavily obscured AGNs originates mainly from the difference in the degree of the thermal processing or the radial transportation. We also find that heavily obscured AGNs with high ratios of the H2O ice absorption to silicate mass column density tend to have silicate dust with lower mass fractions of amorphous pyroxene and crystalline forsterite, which is consistent with the scenario of the thermal dust processing close to the nucleus.
We verify the validity of the continuum emission component of unobscured hot dust in Appendix A.
Acknowledgments
We thank the anonymous referee for carefully reading our manuscript and giving us valuable comments. This work is based on observations with the Spitzer Space Telescope, which is operated by the Jet Propulsion Laboratory, California Institute of Technology under a contract with NASA, using the Combined Atlas of Sources with Spitzer IRS Spectra (CASSIS). CASSIS is a product of the IRS instrument team, supported by NASA and JPL. This work was supported by Grant-in-Aid for JSPS Fellows No. 21J14438.
References
- Aalto, S., Muller, S., Sakamoto, K., et al. 2012, A&A, 546, A68 [NASA ADS] [CrossRef] [EDP Sciences] [Google Scholar]
- Aalto, S., Falstad, N., Muller, S., et al. 2020, A&A, 640, A104 [EDP Sciences] [Google Scholar]
- Antonucci, R. 1993, ARA&A, 31, 473 [Google Scholar]
- Bell, A. R. 1978, MNRAS, 182, 147 [NASA ADS] [CrossRef] [Google Scholar]
- Bohren, C. F., & Huffman, D. R. 1998, Absorption and Scattering of Light by Small Particles (Wiley-VCH) [CrossRef] [Google Scholar]
- Boogert, A. C. A., Gerakines, P. A., & Whittet, D. C. B. 2015, ARA&A, 53, 541 [Google Scholar]
- Bringa, E. M., Kucheyev, S. O., Loeffler, M. J., et al. 2007, ApJ, 662, 372 [NASA ADS] [CrossRef] [Google Scholar]
- Chiar, J. E., & Tielens, A. G. G. M. 2006, ApJ, 637, 774 [NASA ADS] [CrossRef] [Google Scholar]
- Demyk, K., Jones, A. P., Dartois, E., Cox, P., & D’Hendecourt, L. 1999, A&A, 349, 267 [NASA ADS] [Google Scholar]
- Demyk, K., Dartois, E., Wiesemeyer, H., Jones, A. P., & d’Hendecourt, L. 2000, A&A, 364, 170 [Google Scholar]
- Demyk, K., Carrez, P., Leroux, H., et al. 2001, A&A, 368, L38 [NASA ADS] [CrossRef] [EDP Sciences] [Google Scholar]
- Do-Duy, T., Wright, C. M., Fujiyoshi, T., et al. 2020, MNRAS, 493, 4463 [Google Scholar]
- Dorschner, J., Begemann, B., Henning, T., Jaeger, C., & Mutschke, H. 1995, A&A, 300, 503 [Google Scholar]
- Draine, B. T. 2003, ARA&A, 41, 241 [NASA ADS] [CrossRef] [Google Scholar]
- Draine, B. T., & Li, A. 2007, ApJ, 657, 810 [Google Scholar]
- Duy, T. D., & Lawson, W. A. 2019, MNRAS, 488, L75 [CrossRef] [Google Scholar]
- Fabian, D., Henning, T., Jäger, C., et al. 2001, A&A, 378, 228 [NASA ADS] [CrossRef] [EDP Sciences] [MathSciNet] [Google Scholar]
- Gail, H. P. 2004, A&A, 413, 571 [NASA ADS] [CrossRef] [EDP Sciences] [Google Scholar]
- Gibb, E. L., Whittet, D. C. B., Schutte, W. A., et al. 2000, ApJ, 536, 347 [Google Scholar]
- Hao, L., Weedman, D. W., Spoon, H. W. W., et al. 2007, ApJ, 655, L77 [NASA ADS] [CrossRef] [Google Scholar]
- Harker, D. E., & Desch, S. J. 2002, ApJ, 565, L109 [NASA ADS] [CrossRef] [Google Scholar]
- Hatziminaoglou, E., Hernán-Caballero, A., Feltre, A., & Piñol Ferrer, N. 2015, ApJ, 803, 110 [NASA ADS] [CrossRef] [Google Scholar]
- Henning, T. 2010, ARA&A, 48, 21 [NASA ADS] [CrossRef] [Google Scholar]
- Hopkins, P. F., Hernquist, L., Cox, T. J., & Kereš, D. 2008, ApJS, 175, 356 [NASA ADS] [CrossRef] [Google Scholar]
- Houck, J. R., Roellig, T. L., van Cleve, J., et al. 2004, ApJS, 154, 18 [NASA ADS] [CrossRef] [Google Scholar]
- Imanishi, M., & Dudley, C. C. 2000, ApJ, 545, 701 [NASA ADS] [CrossRef] [Google Scholar]
- Imanishi, M., Dudley, C. C., & Maloney, P. R. 2006, ApJ, 637, 114 [NASA ADS] [CrossRef] [Google Scholar]
- Imanishi, M., Dudley, C. C., Maiolino, R., et al. 2007, ApJS, 171, 72 [NASA ADS] [CrossRef] [Google Scholar]
- Jaffe, W., Meisenheimer, K., Röttgering, H. J. A., et al. 2004, Nature, 429, 47 [NASA ADS] [CrossRef] [PubMed] [Google Scholar]
- Kaneda, H., Onaka, T., Sakon, I., et al. 2008, ApJ, 684, 270 [NASA ADS] [CrossRef] [MathSciNet] [Google Scholar]
- Kemper, F., Waters, L. B. F. M., de Koter, A., & Tielens, A. G. G. M. 2001, A&A, 369, 132 [NASA ADS] [CrossRef] [EDP Sciences] [Google Scholar]
- Kemper, F., Vriend, W. J., & Tielens, A. G. G. M. 2004, ApJ, 609, 826 [Google Scholar]
- Kemper, F., Markwick, A. J., & Woods, P. M. 2011, MNRAS, 413, 1192 [Google Scholar]
- Kozasa, T., & Sogawa, H. 1999, in Asymptotic Giant Branch Stars, eds. T. Le Bertre, A. Lebre, & C. Waelkens, 191, 239 [Google Scholar]
- Kroupa, P. 2001, MNRAS, 322, 231 [NASA ADS] [CrossRef] [Google Scholar]
- Lahuis, F., Spoon, H. W. W., Tielens, A. G. G. M., et al. 2007, ApJ, 659, 296 [NASA ADS] [CrossRef] [Google Scholar]
- Lebouteiller, V., Barry, D. J., Spoon, H. W. W., et al. 2011, ApJS, 196, 8 [NASA ADS] [CrossRef] [Google Scholar]
- Lebouteiller, V., Barry, D. J., Goes, C., et al. 2015, ApJS, 218, 21 [NASA ADS] [CrossRef] [Google Scholar]
- Levenberg, K. 1944, Q. Appl. Math., 2, 164 [Google Scholar]
- Li, M. P., Shi, Q. J., & Li, A. 2008, MNRAS, 391, L49 [Google Scholar]
- Lutz, D., Sturm, E., Janssen, A., et al. 2020, A&A, 633, A134 [NASA ADS] [CrossRef] [EDP Sciences] [Google Scholar]
- Mackie, C. J., Peeters, E., Bauschlicher, C. W. J., & Cami, J. 2015, ApJ, 799, 131 [Google Scholar]
- Markwick-Kemper, F., Gallagher, S. C., Hines, D. C., & Bouwman, J. 2007, ApJ, 668, L107 [Google Scholar]
- Marquardt, D. W. 1963, J. Soc. Ind. Appl. Math., 11, 431 [Google Scholar]
- Marshall, J. A., Herter, T. L., Armus, L., et al. 2007, ApJ, 670, 129 [Google Scholar]
- Marshall, J. A., Elitzur, M., Armus, L., Diaz-Santos, T., & Charmandaris, V. 2018, ApJ, 858, 59 [Google Scholar]
- Mathis, J. S., Rumpl, W., & Nordsieck, K. H. 1977, ApJ, 217, 425 [NASA ADS] [CrossRef] [Google Scholar]
- Molster, F. J., Waters, L. B. F. M., & Tielens, A. G. G. M. 2002, A&A, 382, 222 [NASA ADS] [CrossRef] [EDP Sciences] [Google Scholar]
- Nardini, E., Risaliti, G., Salvati, M., et al. 2008, MNRAS, 385, L130 [NASA ADS] [Google Scholar]
- Nardini, E., Risaliti, G., Watabe, Y., Salvati, M., & Sani, E. 2010, MNRAS, 405, 2505 [NASA ADS] [Google Scholar]
- Olofsson, J., Augereau, J. C., van Dishoeck, E. F., et al. 2009, A&A, 507, 327 [NASA ADS] [CrossRef] [EDP Sciences] [Google Scholar]
- Raban, D., Jaffe, W., Röttgering, H., Meisenheimer, K., & Tristram, K. R. W. 2009, MNRAS, 394, 1325 [Google Scholar]
- Rietmeijer, F. J. M. 2009, ApJ, 705, 791 [Google Scholar]
- Risaliti, G., Gilli, R., Maiolino, R., & Salvati, M. 2000, A&A, 357, 13 [NASA ADS] [Google Scholar]
- Sargent, B. A., Forrest, W. J., Tayrien, C., et al. 2009, ApJS, 182, 477 [Google Scholar]
- Smith, H. A., Li, A., Li, M. P., et al. 2010, ApJ, 716, 490 [Google Scholar]
- Spoon, H. W. W., Tielens, A. G. G. M., Armus, L., et al. 2006, ApJ, 638, 759 [Google Scholar]
- Spoon, H. W. W., Marshall, J. A., Houck, J. R., et al. 2007, ApJ, 654, L49 [NASA ADS] [CrossRef] [Google Scholar]
- Srinivasan, S., Kemper, F., Zhou, Y., et al. 2017, Planet. Space Sci., 149, 56 [Google Scholar]
- Stierwalt, S., Armus, L., Surace, J. A., et al. 2013, ApJS, 206, 1 [NASA ADS] [CrossRef] [Google Scholar]
- Stierwalt, S., Armus, L., Charmandaris, V., et al. 2014, ApJ, 790, 124 [NASA ADS] [CrossRef] [Google Scholar]
- Tamanai, A., Mutschke, H., Blum, J., & Meeus, G. 2006, ApJ, 648, L147 [Google Scholar]
- Tielens, A. G. G. M. 2005, The Physics and Chemistry of the Interstellar Medium (Cambridge, UK: Cambridge University Press) [CrossRef] [Google Scholar]
- Tsuchikawa, T., Kaneda, H., Oyabu, S., et al. 2019, A&A, 626, A130 [EDP Sciences] [Google Scholar]
- Urry, C. M., & Padovani, P. 1995, PASP, 107, 803 [Google Scholar]
- van Boekel, R., Min, M., Waters, L. B. F. M., et al. 2005, A&A, 437, 189 [NASA ADS] [CrossRef] [EDP Sciences] [Google Scholar]
- Van Breemen, J. M., Min, M., Chiar, J. E., et al. 2011, A&A, 526, A152 [NASA ADS] [CrossRef] [EDP Sciences] [Google Scholar]
- Veilleux, S., Meléndez, M., Sturm, E., et al. 2013, ApJ, 776, 27 [NASA ADS] [CrossRef] [Google Scholar]
- Wada, K. 2012, ApJ, 758, 66 [NASA ADS] [CrossRef] [Google Scholar]
- Weedman, D. W., Hao, L., Higdon, S. J. U., et al. 2005, ApJ, 633, 706 [Google Scholar]
- Werner, M. W., Roellig, T. L., Low, F. J., et al. 2004, ApJS, 154, 1 [NASA ADS] [CrossRef] [Google Scholar]
- Wright, C. M., Do Duy, T., & Lawson, W. 2016, MNRAS, 457, 1593 [Google Scholar]
- Xie, Y., Li, A., & Hao, L. 2017, ApJS, 228, 6 [Google Scholar]
- Zhang, Z.-Y., Romano, D., Ivison, R. J., Papadopoulos, P. P., & Matteucci, F. 2018, Nature, 558, 260 [Google Scholar]
Appendix A: Sharpness of the 10 μm silicate feature
We consider a possibility that dust properties can help to explain the difference in the sharpness of the 10 μm silicate feature instead of that of the saturation due to the unobscured emission component. Broad 10 μm emission features seen in the spectra of type-1 AGNs are explained by larger-size or higher-porosity dust than typical 0.1 μm-sized homogeneous dust (e.g., Xie et al. 2017; Li et al. 2008), while those seen in the spectra of circumstellar disks are explained by, for instance, the combination of silica (SiO2) at 8.6 μm, crystalline enstatite (MgSiO3), forsterite, and amorphous features (e.g., van Boekel et al. 2005; Olofsson et al. 2009). In order to identify the causes of the difference in the sharpness, we calculated the two apparent optical depth ratios  and
and  , using the optical depths
  determined by the absorption-free continuum of Fhot, AGN. Both smaller
  and
and  indicate a sharper 10 μm feature if the central wavelength of the feature is at around 10 μm. Figure A.1 shows the relationship between
  and
and  , which clearly shows a tight positive correlation. If the size or porosity of dust caused the difference in the sharpness, a negative correlation between the ratios should be observed because the central wavelength of the 10 μm feature shifts toward longer wavelengths due to larger-sized or higher-porosity amorphous silicate. Therefore it is unlikely that the difference in the sharpness is caused by the size or porosity of dust.
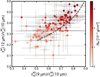 |
Fig. A.1. Relation between |


We simulated the saturation effects due to the unobscured hot dust emission using the absorption efficiency of amorphous olivine, Qabs, ol, which is the main component of the silicate dust in our sample, by changing the contribution levels of the unobscured component. We assumed the mass column density of the silicate dust of 1.7 × 10⁻³ g cm−2, the mean mass column density of amorphous olivine in our sample obtained by the spectral fitting, for the simulation. The relationship between  and
and  (the dashed line in Fig. A.1) traces the trend of the data points well, although there is a slight offset presumably due to the presence of PAH or line features. Figure A.1 is color-coded according to the mass column density of silicate dust, Nall, obtained by the 5.3–12 μm spectral fitting. We find that the spectra with deeper absorptions show flatter profiles at the bottom of the feature. When the saturation causes the difference in the sharpness, the trend is reasonable considering that the ratio of the unobscured hot dust emission to absorption-free continuum emission does not change much. Therefore we conclude that the unobscured emission component is likely to cause the difference in the sharpness.
In the 5.3–12 μm spectral fitting, we assume the spectral profile of the absorption-free continuum emission due to the hot dust heated by AGN, not the extended star-formation component responsible for the PAH emission. We verified the validity of this assumption. We investigated the relationship between the equivalent width of the PAH feature at 6.2 μm and the ratio of Ahot, unobs to Ahot, AGN, which is expected to correlate positively if the weak continuum filling in the 9.7 μm feature is attributed to the extended star-formation component. The correlation coefficient and the p-value are 0.08 and 0.37, respectively, which do not indicate a significant correlation. Moreover, we also compared the results of the spectral fittings using the unobscured hot dust continua due to the starburst and AGN activities. We used the spectral profile of the dust continuum model obtained from NGC 7714 by Marshall et al. (2018) for the former continuum profile. As a result, for 91/115 sources, the latter model is fitted better than the former, and, for 8/115 sources, the reduced χ2 value improves significantly with a significance level of 5% by the F-test. Hence we conclude that the unobscured AGN component fills the 9.7 μm feature.
Appendix B: Summary of the analyses of the silicate features
The properties of silicate dust in our sample are summarized in Table B.1. Figure B.1 shows all the results of the spectral decomposition.
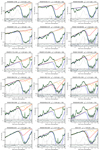 |
Fig. B.1. Results of the 5.3–12 μm spectral fitting for all spectra in our sample. The line colors and styles are the same as in the right panel of Fig. 1. It is important to note that some of the components, mainly the unobscured continuum component, fall below the plotted area. |
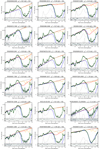 |
Fig. B.1. continued. |
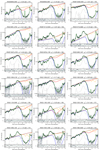 |
Fig. B.1. continued. |
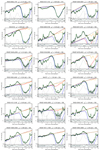 |
Fig. B.1. continued. |
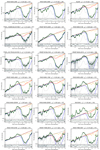 |
Fig. B.1. continued. |
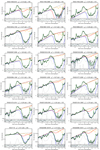 |
Fig. B.1. continued. |
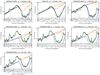 |
Fig. B.1. continued. |
Summary of the spectral fittings.
All Tables
All Figures
|
Fig. 1. Examples of the 5.3–12 μm spectral fitting. Left panels: retrieved mid-IR spectra and the estimated absorption-free continua. Middle panels: Gaussian fits to the 23 μm features. Results of the 5.3–12 μm spectral fitting are shown in the right panels in which the green solid lines show the best-fit models, the absorption components of which are composed of amorphous pyroxene (red lines; Fhot, AGN exp(−τpyr) in Eq. (1)), amorphous olivine (blue lines; Fhot, AGN exp(−τol)), and crystalline forsterite (orange lines; Fhot, AGN exp(−τcry)). Also, the black dashed, dotted, and gray solid lines represent the absorption-free continuum (Fhot, AGN), the unobscured continuum (Fhot, unobs), and the PAH and line emission (FPAH + Fline) components, respectively. We note that the unobscured continuum component falls below the plotted area for IRAS 12127−1412 and IRAS 02530+0211. |
| In the text | |
|
Fig. 2. Histograms of the mass column densities of amorphous olivine (Nol; left), amorphous pyroxene (Npyr; center), and crystalline forsterite (Ncry; right). The optical depths at the peak wavelengths corresponding to the mass column densities are shown in the upper x-axes. The peak wavelengths used for calculating the optical depths of amorphous olivine, amorphous pyroxene, and crystalline forsterite are 9.8, 9.2, and 11.0 μm, respectively. Black and white bars indicate the sources whose 5.3–12 μm spectral fits are accepted and those rejected, respectively, on the basis of the χ2 statistics with a significance level of 0.05. |
| In the text | |
|
Fig. 3. Correlation plot between Ncry/Nall and Npyr/Nall and their histograms. Filled and open black squares show the objects whose 5.3–12 μm spectral fits are accepted and those rejected on the basis of the χ2 statistics with a significance level of 0.05, respectively. Black and white bars in the histograms also indicate the sources in which the spectral fits are accepted and rejected, respectively. The correlation coefficient and the p-value for the accepted sample are shown at the bottom right corner of the correlation plot. Red diamond and dotted lines show the silicate dust properties obtained from the Sgr A* spectrum, a typical spectrum of the diffuse ISM in our Galaxy (Kemper et al. 2004). |
| In the text | |
|
Fig. 4. Anticorrelations of τice(6 μm)/Nall with Ncry/Nall (left) and Npyr/Nall (right). The correlation coefficients and the p-values for the sample are shown in the top right corners. |
| In the text | |
|
Fig. A.1. Relation between |
| In the text | |
|
Fig. B.1. Results of the 5.3–12 μm spectral fitting for all spectra in our sample. The line colors and styles are the same as in the right panel of Fig. 1. It is important to note that some of the components, mainly the unobscured continuum component, fall below the plotted area. |
| In the text | |
|
Fig. B.1. continued. |
| In the text | |
|
Fig. B.1. continued. |
| In the text | |
|
Fig. B.1. continued. |
| In the text | |
|
Fig. B.1. continued. |
| In the text | |
|
Fig. B.1. continued. |
| In the text | |
|
Fig. B.1. continued. |
| In the text | |
Current usage metrics show cumulative count of Article Views (full-text article views including HTML views, PDF and ePub downloads, according to the available data) and Abstracts Views on Vision4Press platform.
Data correspond to usage on the plateform after 2015. The current usage metrics is available 48-96 hours after online publication and is updated daily on week days.
Initial download of the metrics may take a while.