Fig. 3.
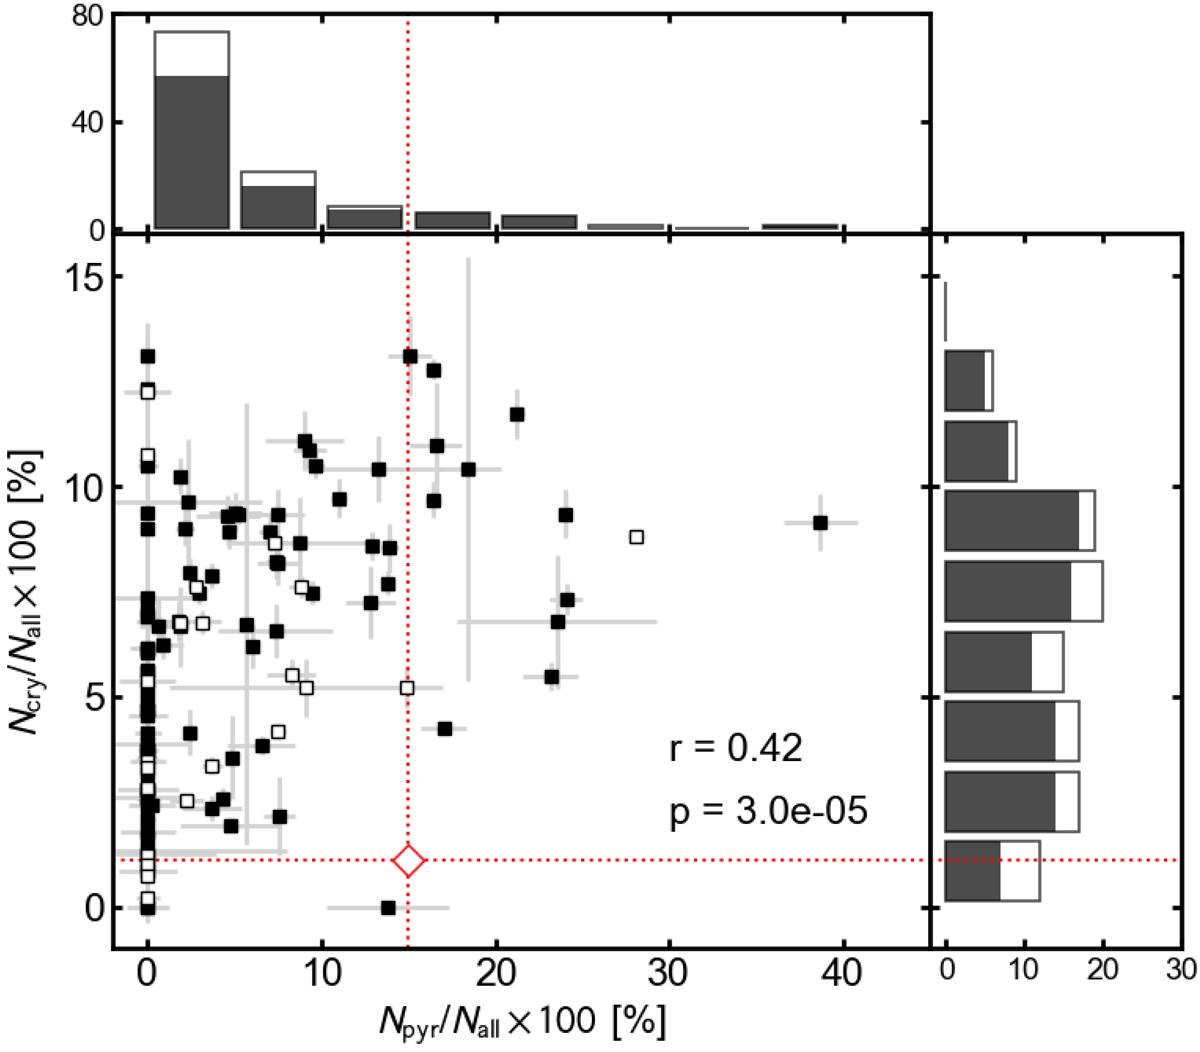
Correlation plot between Ncry/Nall and Npyr/Nall and their histograms. Filled and open black squares show the objects whose 5.3–12 μm spectral fits are accepted and those rejected on the basis of the χ2 statistics with a significance level of 0.05, respectively. Black and white bars in the histograms also indicate the sources in which the spectral fits are accepted and rejected, respectively. The correlation coefficient and the p-value for the accepted sample are shown at the bottom right corner of the correlation plot. Red diamond and dotted lines show the silicate dust properties obtained from the Sgr A* spectrum, a typical spectrum of the diffuse ISM in our Galaxy (Kemper et al. 2004).
Current usage metrics show cumulative count of Article Views (full-text article views including HTML views, PDF and ePub downloads, according to the available data) and Abstracts Views on Vision4Press platform.
Data correspond to usage on the plateform after 2015. The current usage metrics is available 48-96 hours after online publication and is updated daily on week days.
Initial download of the metrics may take a while.