Fig. 2.
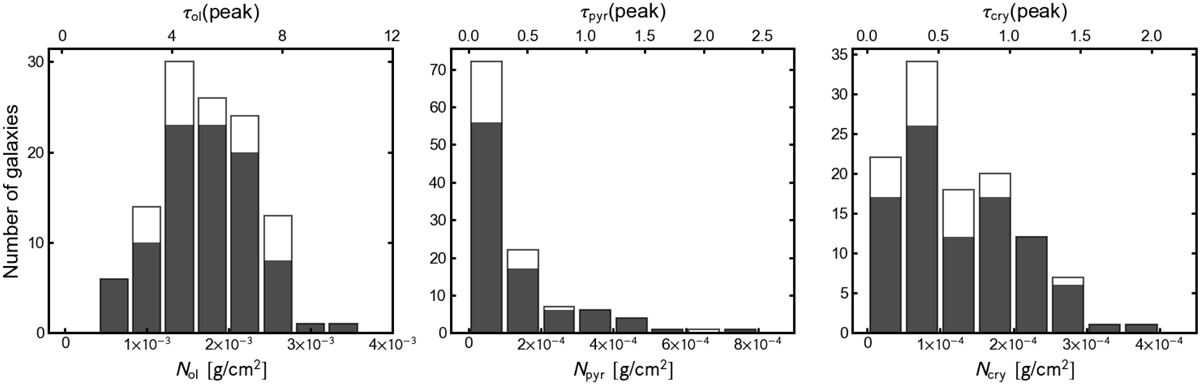
Histograms of the mass column densities of amorphous olivine (Nol; left), amorphous pyroxene (Npyr; center), and crystalline forsterite (Ncry; right). The optical depths at the peak wavelengths corresponding to the mass column densities are shown in the upper x-axes. The peak wavelengths used for calculating the optical depths of amorphous olivine, amorphous pyroxene, and crystalline forsterite are 9.8, 9.2, and 11.0 μm, respectively. Black and white bars indicate the sources whose 5.3–12 μm spectral fits are accepted and those rejected, respectively, on the basis of the χ2 statistics with a significance level of 0.05.
Current usage metrics show cumulative count of Article Views (full-text article views including HTML views, PDF and ePub downloads, according to the available data) and Abstracts Views on Vision4Press platform.
Data correspond to usage on the plateform after 2015. The current usage metrics is available 48-96 hours after online publication and is updated daily on week days.
Initial download of the metrics may take a while.