Fig. 1.
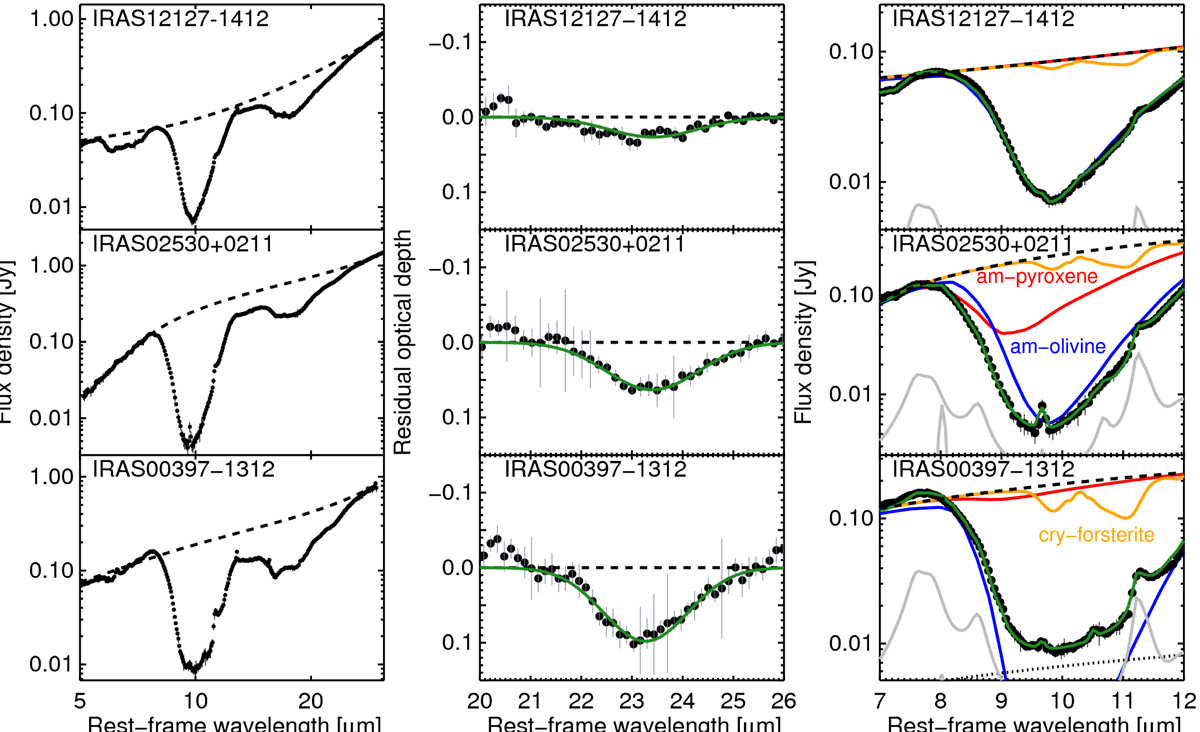
Examples of the 5.3–12 μm spectral fitting. Left panels: retrieved mid-IR spectra and the estimated absorption-free continua. Middle panels: Gaussian fits to the 23 μm features. Results of the 5.3–12 μm spectral fitting are shown in the right panels in which the green solid lines show the best-fit models, the absorption components of which are composed of amorphous pyroxene (red lines; Fhot, AGN exp(−τpyr) in Eq. (1)), amorphous olivine (blue lines; Fhot, AGN exp(−τol)), and crystalline forsterite (orange lines; Fhot, AGN exp(−τcry)). Also, the black dashed, dotted, and gray solid lines represent the absorption-free continuum (Fhot, AGN), the unobscured continuum (Fhot, unobs), and the PAH and line emission (FPAH + Fline) components, respectively. We note that the unobscured continuum component falls below the plotted area for IRAS 12127−1412 and IRAS 02530+0211.
Current usage metrics show cumulative count of Article Views (full-text article views including HTML views, PDF and ePub downloads, according to the available data) and Abstracts Views on Vision4Press platform.
Data correspond to usage on the plateform after 2015. The current usage metrics is available 48-96 hours after online publication and is updated daily on week days.
Initial download of the metrics may take a while.