Free Access
Fig. B.1.
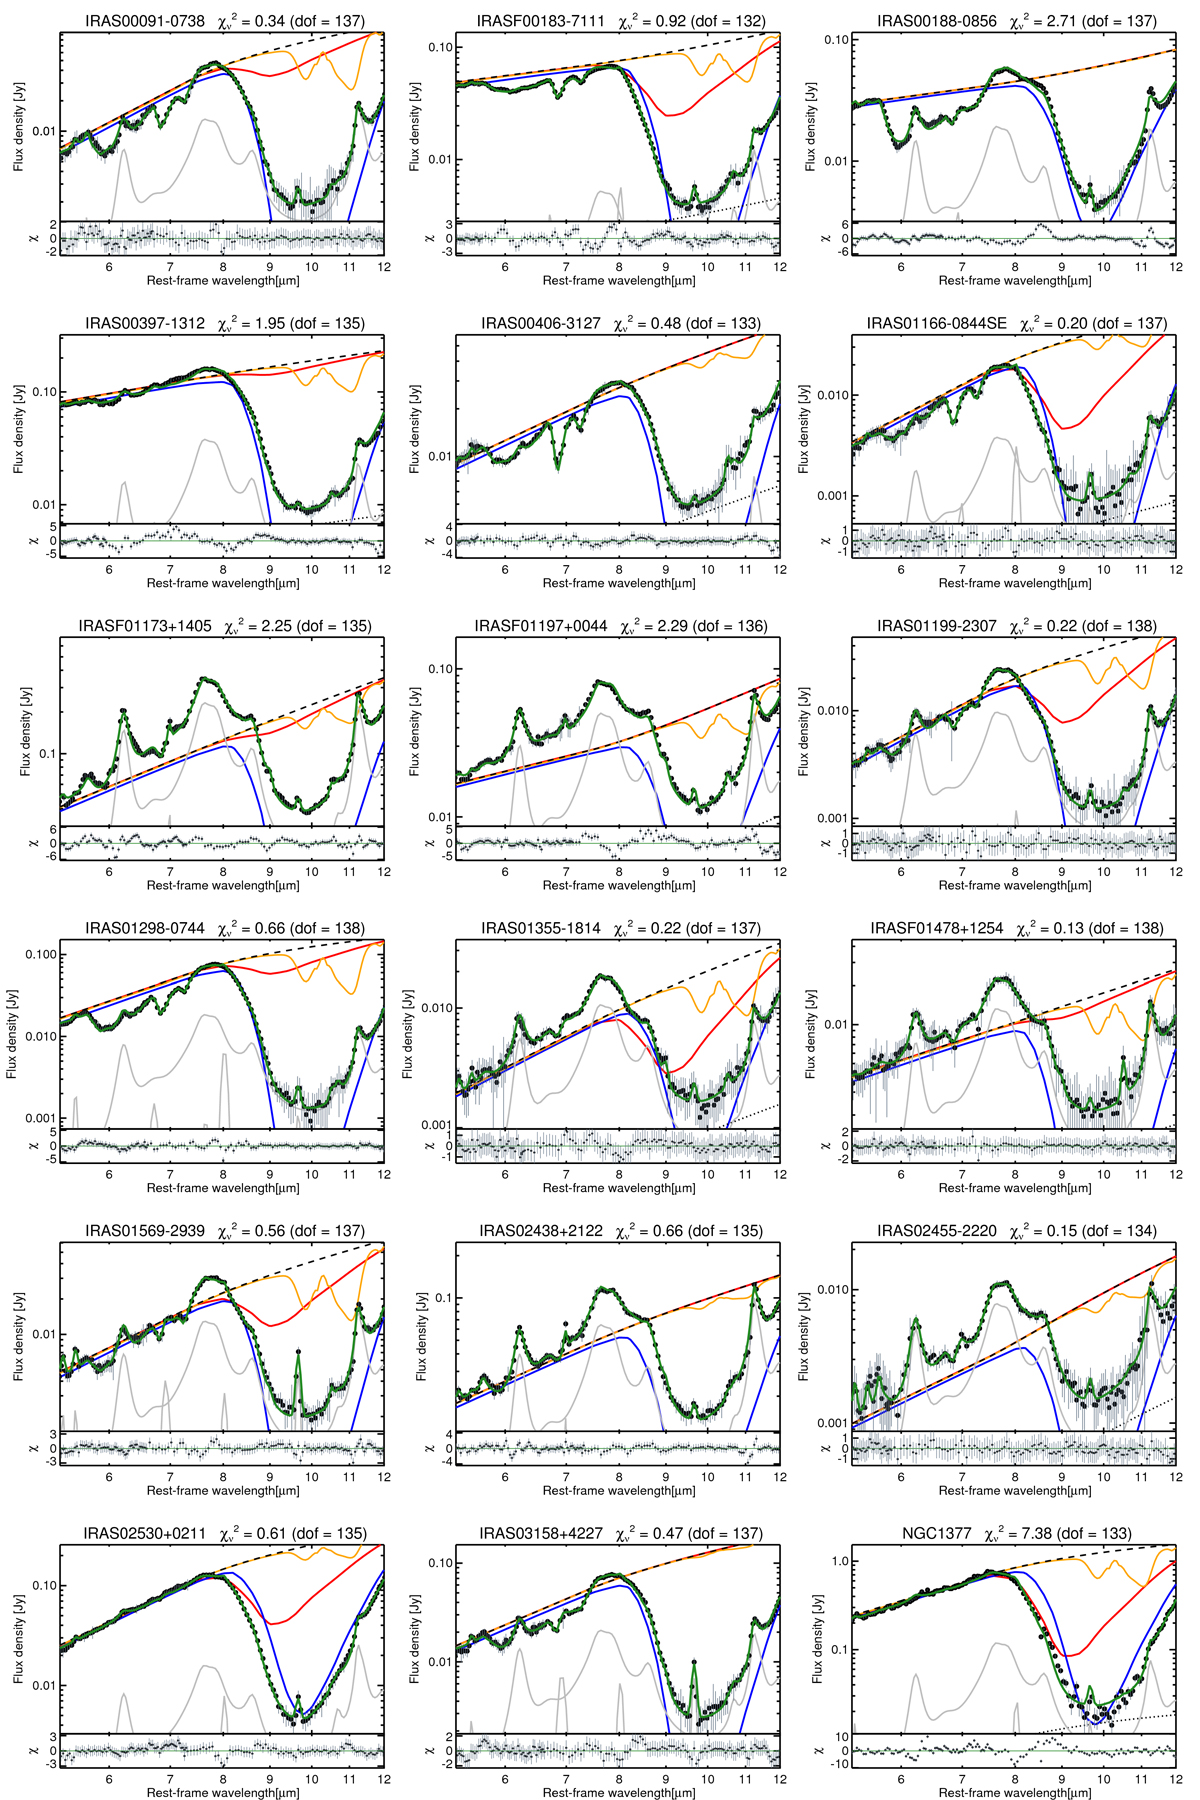
Results of the 5.3–12 μm spectral fitting for all spectra in our sample. The line colors and styles are the same as in the right panel of Fig. 1. It is important to note that some of the components, mainly the unobscured continuum component, fall below the plotted area.
Current usage metrics show cumulative count of Article Views (full-text article views including HTML views, PDF and ePub downloads, according to the available data) and Abstracts Views on Vision4Press platform.
Data correspond to usage on the plateform after 2015. The current usage metrics is available 48-96 hours after online publication and is updated daily on week days.
Initial download of the metrics may take a while.