| Issue |
A&A
Volume 650, June 2021
|
|
|---|---|---|
| Article Number | A120 | |
| Number of page(s) | 13 | |
| Section | Planets and planetary systems | |
| DOI | https://doi.org/10.1051/0004-6361/202039728 | |
| Published online | 16 June 2021 | |
Evidence for limited compositional and particle size variation on asteroid (101955) Bennu from thermal infrared spectroscopy
1
Southwest Research Institute,
Boulder,
CO,
USA
e-mail: This email address is being protected from spambots. You need JavaScript enabled to view it.
2
Arizona State University,
Tempe,
AZ,
USA
3
NASA Goddard Space Flight Center,
Greenbelt,
MD,
USA
4
Stony Brook University,
Stony Brook,
NY,
USA
5
Lunar and Planetary Institute,
Houston,
TX,
USA
6
Smithsonian Institution, National Museum of Natural History,
Washington,
DC,
USA
7
Institut d’Astrophysique Spatiale, CNRS/Université Paris Sud,
Orsay,
France
8
University of Texas,
Austin,
TX,
USA
9
INAF-Astrophysical Observatory of Arcetri,
Firenze,
Italy
10
Ithaca College,
Ithaca,
NY,
USA
11
Lunar and Planetary Laboratory, University of Arizona,
Tucson,
AZ,
USA
Received:
20
October
2020
Accepted:
31
March
2021
Abstract
Context. Asteroid (101955) Bennu is the target of NASA’s Origins, Spectral Interpretation, Resource Identification, and Security–Regolith Explorer (OSIRIS-REx) mission. The spacecraft’s instruments have characterized Bennu at global and local scales to select a sampling site and provide context for the sample that will be returned to Earth. These observations include thermal infrared spectral characterization by the OSIRIS-REx Thermal Emission Spectrometer (OTES).
Aims. To understand the degree of compositional and particle size variation on Bennu, and thereby predict the nature of the returned sample, we studied OTES spectra, which are diagnostic of these properties.
Methods. We created and mapped spectral indices and compared them with the distribution of geomorphic features. Comparison to laboratory spectra of aqueously altered carbonaceous chondrites constrains the amount of compositional variability that is observable.
Results. The OTES spectra exhibit two end-member shapes (or types), and compositional variability appears limited at the spatial resolution of the observations. The global distribution of these spectral types corresponds with the locations of regions composed of (i) large, dark, relatively rough boulders and (ii) relatively smooth regions lacking large boulders.
Conclusions. The two spectral types appear to be diagnostic primarily of particle size variations, with contributions from other properties. The spectra resemble experimental data of solid substrates with very thin accumulations (a few to tens of microns) of fine particles (<~65–100 μm). The dustier surfaces commonly correspond with rougher rocks that may produce and/or act as traps for the particles. Anhydrous silicates are limited in abundance, and the bulk mineralogy is consistent with the most aqueously altered carbonaceous chondrites. We expect the returned samples to include these physical and mineralogical characteristics.
Key words: minor planets, asteroids: individual: (101955) Bennu / methods: data analysis / techniques: spectroscopic
© ESO 2021
1 Introduction
The primary objective of NASA’s Origins, Spectral Interpretation, Resource Identification, and Security–Regolith Explorer (OSIRIS-REx) mission is to return a sample of pristine carbonaceous regolith from the asteroid (101955) Bennu for study on Earth. Bennu is a small (~490 m diameter) B-type asteroid, meaning that its visible-to-near-infrared spectral properties correspond to those of CI and CM carbonaceous chondrite (CC) meteorites (Clark et al. 2011). These meteorites bear water and organics and may have delivered such materials to Earth early in Solar System history. Studying samples of CC-like material that has not been exposed to Earth’s atmosphere, hydrosphere, or biosphere will provide the best opportunity to understand these materials in their pristine state.
For the characterization of the asteroid and the selection of a sampling site, the spacecraft carries multiple cameras (the OSIRIS-REx Camera Suite [OCAMS]), a laser altimeter (the OSIRIS-REx Laser Altimeter [OLA]), two spectrometers (the OSIRIS-REx Visible and InfraRed Spectrometer [OVIRS] and the OSIRIS-REx Thermal Emission Spectrometer [OTES]) and a student-led X-ray spectrometer (the Regolith X-ray Imaging Spectrometer [REXIS]; Lauretta et al. 2017). Instrument descriptions and initial observations of Bennu’s physical properties, geology, composition, and geophysical characteristics are summarized by Lauretta et al. (2019) and references therein. As a whole, Bennu is low in normal albedo (4.4%), rough, and dominated by two populations of boulders that differ in morphology, albedo, and size, with very few ponds of fine materials (DellaGiustina et al. 2019, 2020). Bennu’s mean thermal inertia (300 ± 30 J m−2 K−1 s−1/2) reflects the average value for these two populations of boulders, both of which exhibit relatively high porosity as compared to CC meteorites (Rozitis et al. 2020). Spectral data acquired by OVIRS and OTES during the preliminary survey phase indicate that the surface of Bennu is largely composed of coarse particulate (and/or solid) materials consisting of hydrated (phyllo-)silicates with magnetite, analogous to aqueously altered CC compositions of petrologic types (Van Schmus & Wood 1967) 1 and 2 (Hamilton et al. 2019), as well as organics and carbonate minerals (Kaplan et al. 2020; Simon et al. 2020).
Here, we present results obtained from OTES data collected at higher spatial resolution during the detailed survey (DS) phase of the mission. The objectives of this investigation are to understand the surface properties of Bennu, particularly compositional and particlesize variations, and make predictions about the sample that is planned for Earth return in 2023. These data represent: the first spatially resolved, thermal infrared (TIR) spectra of a CC asteroid at 40 m spatial scales; the first determination of the extent of spectral variability on Bennu; the first identification of two TIR spectral types on Bennu; the first TIR identification of dust and its distribution on Bennu at particle sizes below the image resolution limit; and the first quantitative constraints on the abundances of hydrous and anhydrous silicates.
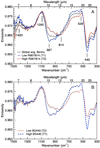 |
Fig. 1 OTES spectra demonstrating key spectral variations. (A) OTES global average spectrum and spectral types T1 (blue) and T2 (red), with the two types defined by averages of the 100 spectra that have the lowest and highest 987/814 cm−1 ratio values (R987/814), respectively. The colors of the spectra are correlated with the colors in the maps in Figs. 2A and 2C. Features described in the text are annotated. Data were acquired at the EQ3 (12:30 pm) DS station when maximum brightness temperatures ranged from 304 to 338 K. (B) EQ3 spectral averages representing minimum (red, Type 2) and maximum (blue, Type 1) BD440 values. (Colors are inverted from those shownin Fig. 2B so as to correlate with spectral type rather than index value.) |
2 Data analysis
2.1 OTES data
The OTES instrument is a hyperspectral point spectrometer that measures emitted radiance from 1750 to 100 cm−1 (5.71–100 μm) with an 8 mrad field of view. Instrument performance and data calibration and processing are described by Christensen et al. (2018; 2019a) and Hamilton et al. (2019). The data we show from the DS were collected at 12:30 pm (Equatorial Station [EQ] 3; 9 May 2019) and 8:40 pm (EQ6; 30 May 2019) local solar time (LST). The nominal nadir spatial resolution is 40 m/spectrum. Details of the selection of OTES data for this analysis are described in Appendix A.1.
2.2 Spectral indices
To compare and investigate the distributions of spectral features observed by visual inspection (Sect. 3.1), we devised spectral indices that use the emissivity values at two or more spectral locations to identify the presence, strength, and orientation of a feature of interest. The effects of point-to-point noise on the calculated value are reduced by averaging several channels at each location. Spectral indices necessarily exclude detailed spectral information and are subject to potentially decreased accuracy relative to methods that analyze the entire spectrum; as such, they are best used as a guide to identifying extremes of the data, which should then be investigated at full spectral resolution. The details of our spectral index calculations and the associated uncertainties are described in detail in Appendix A.2.
2.3 Linear least squares modeling
In most situations, the mixing of spectral components is linear in the TIR (e.g., Thomson & Salisbury 1993). Linear least squares fitting models provide a means of taking the spectrum of a mixture and extracting the compositions of the components and their abundances using a library of likely component spectra to fit the measured spectrum (Ramsey & Christensen 1998). We used a non-negative linear least squares (NNLS) model (Rogers & Aharonson 2008) to determine the abundances of data-derived end-member spectra in each spectrum from the EQ3 data set and verify that there are no unidentified spectral shapes (Sect. 3.2). This model and our application of it to OTES data is further described in Appendix A.3.
3 Results
3.1 Observed spectral features and spectral types
The global average spectrum of Bennu from EQ3 (Fig. 1A) is consistent with the hemispheric average spectrum from the preliminary survey phase (Hamilton et al. 2019). Major features are: a peak at ~1420 cm−1, the Christiansen feature (CF; ~1090 cm−1), the silicate stretching feature (~1090–650 cm−1), a peak at ~528 cm−1, a band minimum at~440 cm−1 dominantly attributed to silicate bending modes, and minima attributed by Hamilton et al. (2019) to magnetite at ~555 and ~340 cm−1. Visual inspection of individual EQ3 spectra revealed two common variations, one being the slope of the low wavenumber side of the silicate stretching feature between 987 and 814 cm−1 and the other the depth of the band minimum at 440 cm−1 (Fig. 1). We developed two spectral indices (Sect. 2.2 and Appendix A.2) to characterize these variations. The first is the ratio of the emissivity at 987 cm−1 to that at 814 cm−1 (R987/814), and the second is theband depth at 440 cm−1 (BD440). We averaged the 100 spectra that had the lowest and highest values of the R987/814 index to define two end-member spectral types, T1 and T2, respectively.
Both T1 and T2 (Fig. 1A) exhibit overall positive slopes (slightly shallower in T1) between 1500 and 1090 cm−1 with a peak near 1420 cm−1. The region of the silicate stretching feature in T1 is asymmetric with a band minimum on the high wavenumber side (~987 cm−1), whereas T2 has a more symmetric shape with aminimum at ~814 cm−1 and is shallower overall. The T1 and T2 features between ~520 and 300 cm−1 exhibit virtually identical shapes, with the T2 spectrum differing only in that it is shallower.
3.2 Distribution of spectral types
Maps of the index values are shown in Fig. 2A and B (error maps are shown in Fig. A.1). R987/814 values tend to be higher in areas identified as rugged with large, dark boulders and relatively low thermal inertia, and they tend to be lower in relatively smooth areas with smaller, brighter boulders and relatively high thermal inertia (Jawin et al. 2021; DellaGiustina et al. 2020; Rozitis et al. 2020). The BD440 map resembles the inverse of this trend. However, the R987/814 and BD440 parameters are only weakly inversely correlated (R2 = 0.37; Fig. A.2), the significance of which is discussed below.
In addition to mapping the index values, we map results obtained from using the NNLS model with the T1 and T2 spectral shapes. This approach accomplishes two things. First, the NNLS model allows us to determine the abundances of each component in any given location, which is not possible using the spectral indices alone. Second, the model demonstrates that T1 and T2 spectra are sufficient to model the global OTES data set. The NNLS-modeled distributions of T1 and T2 (shown for T2 in Fig. 2C) are, not surprisingly, similar to the R987/814 map. The uncertainties in the modeled values (Fig. A.3) indicate that there are no major regions of misfit that would indicate the presence of another spectral shape that was not identified by the spectral indices.
The majority of spectra (2193 of 2395) are modeled as mixtures of T1 and T2. T1-like spectra (low R987/814 values) are concentrated near the equator and low northern latitudes (Fig. 3A) in relatively smooth-looking terrains. Spectra dominated (>50%) by T2 shapes (high R987/814 values) are commonly observed in regions where large,rough, low-albedo, low thermal inertia boulders occur (Fig. 3B), dominantly at southern latitudes (DellaGiustina et al. 2020; Rozitis et al. 2020). Spectra at the Nightingale sampling site (56°N, 43°E) are dominantly T2.
4 Discussion
Based on the observed spectral shapes in the OTES data, we consider two primary causes of the T1–T2 spectral variation: composition and particle size.
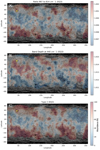 |
Fig. 2 Distribution maps of the OTES spectral types. (A) Ratio of 987/814 cm−1; blue is OTES T1 and red is OTES T2. (B) Band depth at 440 cm−1, modestly inversely correlated with R987/814 (see text for details). (C) Linear least squares modeled abundance distribution of T2 (where 0% = T1). The minimum and maximum scale bar values of (A) and (B) are ±2 standard deviations from the mean. All maps in this and subsequent figures are overlaid on the base map of Bennett et al. (2020); the yellow star denotes the Nightingale site. |
4.1 Constraints on composition
We compared the Bennu spectra to those of aqueously altered CC meteorites to place constraints on mineralogy (Fig. 4, Table 1, Appendix A.4). (These meteorite analog spectra represent coarse particulate to solid surfaces, not powders, based on the conclusion of Hamilton et al. 2019 that there is no evidence for abundant fine particulates; this conclusion is revisited below.) The key features of Bennu spectra (taking point-to-point noise and the 8.66 cm−1 spectral sampling of the data into account) are: (i) The position of Bennu’s CF exhibits minimal difference between T1 and T2 (~1090 cm−1), which is a higher wavenumber than in Orgueil (CI) but is similar to that of most CMs; (ii) the Bennu T1 silicate stretching band shape and minimum position are closest to that of a CC fragment (91A_1, C1-ung) from Almahata Sitta (AhS); (iii) there is no obvious meteorite analog to the shape and band minimum of the T2 silicate stretching feature; (iv) there is no strong Mg-OH band between ~700 and 530 cm−1 in either T1 or T2; (v) the peakat 528 cm−1 is common to T1 and T2 and is most similar to those of Orgueil and Allan Hills (ALH) 83100 (CM1/2); and (vi) the position of the silicate bending feature minimum (~440 cm−1) does not differ between T1 and T2.
No single CC meteorite (or class of meteorites) provides a perfect match to either Bennu spectrum, although several are similar. Of the meteorites investigated, T1 is most similar to AhS 91A_1, Orgueil, and ALH 83100. AhS 91A_1 is dominated by fine-grained phyllosilicates enclosing a few ureilitic clasts of olivine, pigeonite, orthopyroxene, and plagioclase (Goodrich et al. 2019). A small area of this clast (~10%) exhibits spectral evidence of heating, with matrix olivine having features of small crystallites (Hamilton et al. 2020), which is characteristic of olivine produced by the dehydration of phyllosilicates (e.g., Hanna et al. 2020, and references therein). Orgueil and ALH 83100 contain >79–84 vol% phyllosilicate (King et al. 2015; Howard et al. 2015; Donaldson Hanna et al. 2019). The low wavenumber (silicate bending) features of these meteorites are all quite similar to those in T1 and T2, differing primarily in their greater depth relative to the silicate stretching band. All three meteorites contain magnetite (Table 1 and Goodrich et al. 2019), consistent with their aqueous alteration histories (Appendix A.5) and the observation of magnetite spectral features in the OTES data (Hamilton et al. 2019).
An Mg–OH band is common to the most aqueously altered CI and CM meteorites but is weaker in less-altered or heated CMs (e.g., Salisbury et al. 1991a; Hanna et al. 2020) and is not resolved in T1 or T2. Its absence may be attributable to heating and/or a physical effect that results in the apparent shallowing of this feature, such as scattering or sidewelling radiance. In CC meteorite spectra, this band’s strength and width change with the shape and strength of the spectral peak or shoulder at 528 cm−1. The 528 cm−1 feature is diagnosticof bulk phyllosilicate abundance; it weakens in CMs with less than 87–89 vol% phyllosilicate and is replaced by a peak at 580 cm−1 in meteorites that have <78 vol% phyllosilicate and >10 vol% olivine and pyroxene (Howard et al. 2015) (Fig. 4). This shift occurs because anhydrous silicates broaden the silicate bending feature; increasing abundances of anhydrous minerals also add a shoulder or peak at ~493 cm−1 (e.g., Murray, Murchison) that is not observed in the Bennu spectra.
The peak at 1420 cm−1 (Figs. 1 and A.4 and Appendix A.6) is not expected in coarse particulate to solid silicates, carbonates, or most oxides, but it is visible in spectra of coarse particulate to solid pyrrhotite (sulfide) and spinel. Peaks in this region are more commonly associated with strong absorbers in fine particulates (e.g., Salisbury & Walter 1989; Bandfield et al. 2003) and are present in spectra of fine-particulate CM meteorites (e.g., Salisbury et al. 1991a; Donaldson Hanna et al. 2019), where they are attributable to carbonate or water (in cronstedtite; Fig. A.4). Carbonates have been identified in OVIRS data (Kaplan et al. 2020), but not all expected carbonate features have been identified in OTES data. It is possible that the 1420 cm−1 feature is due to one or more of these minerals. Organics also exhibit features in this region, although they are weak and usually not readily observed in emission or reflectance measurements (Salisbury et al. 1991a).
The T2 spectrum is rather enigmatic because we have not identified a CC meteorite that has a similar spectral shape, R987/814 slope, or band minimum in the silicate stretching region (~1090–650 cm−1), yet the silicate bending region (~528–300 cm−1) is as well matched as T1 by the most altered of the CC meteorites. Mixtures of the meteorites shown in Fig. 4 cannot replicate T2, which makes sense if we consider the nature of silicate spectral features as a function of structure and composition. Christiansen features and stretching band minima in silicate minerals shift to lower wavenumbers with decreasing polymerization of the silicate anion (e.g., Lyon 1965; Salisbury & Walter 1989; Salisbury et al. 1991b) and exhibit smaller shifts with solid solution composition (Hamilton 2010). In a linear mixture, the CF and band minimum(-a) will shift as the proportions of various silicates change. If we consider the T2 silicate stretching region shape in this context, it suggests a mineralogy with a relatively large proportion of less-polymerized minerals than T1. The dominant silicates in CI and CM meteorites are phyllosilicates (most polymerized), pyroxene (less polymerized), and olivine (least polymerized). If the shape change and shift in the stretching band minimum from 987 cm−1 (T1) to 814 cm−1 (T2) are indicative of a compositional change, they would require the addition of greater quantities of pyroxene and olivine to produce the T2 shape. We might also expect to observe a shift in the position of the CF, which we do not see. We demonstrated above that the spectra of CM meteorites that have more than ~10 vol% anhydrous silicates (e.g., Cold Bokkeveld, Murray, Murchison) do not match Bennu in terms of either the stretching band minimum position or the shape of the bending features and associated maximum near 528 cm−1. As a result, we conclude that compositional variation capable of explaining the stretching band differences between T1 and T2 would produce changes at lower wavenumbers, which are not observed. In Sect. 4.2, we explore another explanation for these characteristics of the T2 spectrum that relates to the presence of fine particulates.
In summary, Bennu’s bulk mineralogy at 40 m per spot scales (~1255 m2) is most consistent with aqueously altered CCs having more than about 90% of the silicate minerals as phyllosilicates and less than about 10 vol% as anhydrous silicates. The three to four meteorites that meet these criteria in this work are an ungrouped C1, a CI, and one or two CMs that exhibit subtle compositional and spectral variations; it is therefore plausible that Bennu could host comparable variation, which must be sufficiently well mixed across the surface of Bennu such that we do not detect it at these scales. Additionally, completely different materials, such as the ~1–2 m diameter pyroxene-rich boulders described by DellaGiustina et al. (2021), can be present at areal abundances of much less than one percent of the OTES-measured areas in this work, which makes them undetectable.
By analogy with the most aqueously altered CC meteorites, the phyllosilicates on Bennu are most likely Mg-rich and may be intergrowths of serpentine and saponite. (Known compositional trends in CI and CM meteorites make it reasonable to infer that the phyllosilicates are likely Mg-rich; the lack of a clear Mg–OH feature in OTES spectra does not preclude this interpretation as its absence may result from scattering, sidewelling radiance, or another physical effect.) Bennu is not composed of extensively heated CI or CM material. Heating to >500°C results in an increase in the abundance of olivine and pyroxene as those phases replace phyllosilicate (Hanna et al. 2020; Lindgren et al. 2020). Our results limit the total abundance of those anhydrous silicates to ≤ 10 vol% (Fig. 4, Table 1), constraining the amount of heated material that could be present globally. The presence of magnetite supports the idea that there has not been extensive thermal metamorphism of a CI or CM lithology, as it likely would have been destroyed by that process, but it does not rule out mild heating (<400 °C; Appendix A.5).
Some portion of the OTES R987/814 spectral variability may be attributable to space weathering (e.g., Brunetto et al. 2020). However, the full range of T1–T2 variability is greater than that shown in space weathering experiments. Experimental space weathering does not obscure the Mg–OH band.
The lack of substantial compositional variety at 40 m scales on Bennu is perhaps not surprising given Bennu’s nature as a rubble-pile asteroid. Ongoing analysis of data acquired in subsequent mission phases at higher spatial resolutions, including during the sampling event, may enable us to tease out evidence of compositional variability, if it exists.
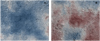 |
Fig. 3 Examples of T1- and T2-bearing terrains; images are colorized following the spectra in Fig. 1A, with blue representing T1 and red representing T2. Individual OTES spots are overlaid on the base map of Bennett et al. (2020) using the open source J-Asteroid GIS software package (documented as JMARS by Christensen et al. 2009). (A) Relatively boulder-free region near Aellopus Saxum (image centered near 25.5°N, 336°E) with some of the strongest T1 signatures. (B) Large boulder at Roc Saxum (image centered near −23°N, 23°E) with some of the strongest T2 signatures. Grids are 10° of latitude and longitude, or roughly 43 m; OTES spots are approximately 38 m in diameter at these latitudes. |
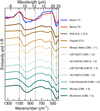 |
Fig. 4 Comparison of T1 and T2 spectra with laboratory spectra of aqueously altered CC meteorites at OTES spectral resolution. Samples are polished thin sections. Dotted vertical lines denote features of interest in the Bennu spectra at 1095, 987, 814, 528, and 440 cm−1. MeteoriticalBulletin classifications are given for all (except AhS 91A_1, which is given by Goodrich et al. 2019), followed by the proposed classification of Howard et al. (2015) for CM chondrites. See Appendix A.4 for more information. |
4.2 Evidence for thin deposits of fine particulates
Because thefeatures of T1 and T2 spectra are inconsistent with compositional differences, we considered whether they could be a result of the presence of fine particles (generally less than 65–100 μm) in T2 that cause volume scattering and the appearance of transparency features and overall shallowing in silicate fundamental bands (e.g., Aronson & Emslie 1973; Salisbury & Eastes 1985; Salisbury & Walter 1989; Moersch & Christensen 1995; Mustard & Hayes 1997; Ramsey & Christensen 1998). We can eliminate deposits that are volumetrically dominated by fine-particulate CC materials like those observed on larger, more slowly rotating asteroids such as Itokawa and Eros. Such deposits would exhibit distinctive features across the spectrum (Fig. A.5), including a CF shifted to higher wavenumbers (relative to a coarse particulate or solid sample) and the appearance of strong transparency features (Salisbury et al. 1991a), with the latter modestly enhanced by thermal gradients onan airless body (Donaldson Hanna et al. 2019). Such strong characteristics are not observed in Bennu spectra.
The T1–T2 spectral variations are consistent with differing degrees of a weak volume scattering effect produced by relatively thin deposits of fine particles on coarse particulate and rocky surfaces. T2 spectra are consistent with experimental data measured from thin coatings (<~15 μm) on coarse-particulate (>125 μm) to solid surfaces (Johnson et al. 2002; Graff 2003; Rivera-Hernandez et al. 2015) (Fig. A.6) that do not produce strong transparency features or substantial thermal gradients. (See Appendix A.7 for a complete discussion on the experimental data and caveats.) However, even T1-dominated spectra appear to include a very small (unquantified) proportion of fine particulates within the field of view, based on the presence of a spectral slope at >1090 cm−1 and possibly the peak at 1420 cm−1. We note that there are models that seek to reproduce scattering effects observed experimentally (e.g., Moersch & Christensen 1995), but such models involve assumptions, do not fully replicate what is observed experimentally, and cannot quantitatively predict size fractions or abundances in a regolith. As such, they are not any more definitive than experimental data, perhaps even less so.
Because spectral radiance is a function of surface temperature and spectral emissivity, materials with low thermal inertia, such as dust, exhibit warmer temperatures (greater radiances) relative to higher thermal inertia materials during daytime hours. At night, the low thermal inertia materials are cooler than the higher thermal inertia materials (e.g., Putzig & Mellon 2007, and references therein) and exhibit relatively reduced radiances. For a mixture of materials with different thermal inertias, the radiative contribution of the high thermal inertia component is expected to increase as the lower thermal inertia component cools, effectively enabling greater isolation of the high thermal inertia component spectrum at night. Therefore, to further test the thin dust deposit hypothesis, we examined OTES data collected at night (8:40 pm LST, EQ6) because these spectra should have a much smaller contribution from any fine-particulate component that might be present.
In fact, the nighttime OTES spectra do not display the same wide variation in R987/814 values that is seen in daytime data (Figs. 5, 6, and A.7), indicating that T2 spectra are not as prevalent, likely because they represent surfaces with fine particulates that do not emit strongly at night. Nighttime and daytime BD440 spectra and maps are similar (Figs. 5, 6, and A.7), indicating that some, but not all, of the change in this parameter is attributable to fine particle abundance. The modest (rather than strong) correlation between R987/814 and BD440 may be explained by additional factors such as variability in: signal to noise, sidewelling radiance, the inherent emissivities of solid and coarse-particulate surfaces (Ruff 1998; Hamilton & Christensen 2000), and the number of wavelength-comparable surface roughness elements, cavities, and fractures (e.g., Ramsey & Fink 1999; Osterloo et al. 2012).
In summary, we find that OTES spectral variations are attributable primarily to differences in the areal (lateral) abundance of deposits of fine particulates on the order of 5–10 μm thickness. Such modest dust deposits are consistent with thermal inertia results that limit any dust coatings to <50 μm in thickness,regardless of whether or not the coating is laterally continuous (Rozitis et al. 2020). There are no spectra in the EQ3 data set that appear to observe surfaces that are 100% free of dust, suggesting that at the spatial scales considered here (~1255 m2), the dust is ubiquitous. However, whether the dust is present as a global layer that varies slightly in thickness or is present on some surfaces but not others within the area of a measurement is not discernible at these spatial scales. The association of T2 spectra with areas dominated by rough, dark boulders that have relatively low thermal inertia and inferred density and strength (Rozitis et al. 2020) leads us to hypothesize that these boulders (or the characteristics of the terrain) are producing and/or trapping the relatively few fine particulates that are present on Bennu.
4.3 Significance of limited compositional and particle size variability
Prior to the arrival of OSIRIS-REx at Bennu and Hayabusa2 at Ryugu, no asteroid visited by a spacecraft had shown such a rocky surface with a dearth of surface exhibiting smooth ponds composed primarily of dust. Because Hayabusa2 does not carry a hyperspectral TIR spectrometer, OTES spectra are the only such observations we have of a rocky, carbonaceous asteroid. The identification of dust and the constraints we have placed on particle size and distribution are important for improving models of thermophysical properties on unresolved small bodies (where inferences about Bennu’s surface from telescopic data turned out to be different from what is observed with OSIRIS-REx; DellaGiustina et al. 2019) and for the characterization of a carbonaceous, rubble-pile asteroid that will be highly relevant to models of the formation and evolution of similar objects. The presence or absence of fine particulate dust also influences the near surface environment and thus has implicationsfor the design and activity of future exploration and resource recovery operations of carbonaceous asteroids.
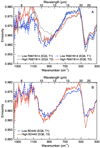 |
Fig. 5 Comparison of daytime and nighttime OTES spectra. (A) OTES nighttime spectra (EQ6, 8:40 pm) that have the lowest and highest R987/814 values (T1 and T2, respectively) in comparison with EQ3 (daytime) data from Fig. 1. Temperatures at this local time range from 229–287 K; because the signal-to-noise ratio (S/N) is a function of temperature, averages of 300 nighttime spectra are shown to increase the S/N. Standard errors are shown asvertical lines at each point in the spectrum; errors at wavenumbers lower than about 1100 cm−1 are close to the line width in many cases. An area of systematic noise in these very low temperature data is excluded. (B) Average (N = 300) nighttime spectra that have the lowest and highest BD440 values. There is little variability in silicate stretching features in nighttime data, suggesting that variations in daytime data are largely attributable to particle size effects. BD440 shows that spectral contrast variations persist across the spectrum at night; these likely represent rocks (deeper) and coarse particulates (shallower). |
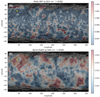 |
Fig. 6 Spectral indices R987/814 (A) and BD440 for EQ6 (B; 8:40 pm), with color maps scaled to the ranges in Fig. 2. There is much less diversity in R987/814 than in the EQ3 data (Figs. 2 and 3). High inertia (coarser) materials emit most strongly at night and little geographic correlation is visible, suggesting that variation in this parameter in the daytime data is due primarily to differences in the relative abundance of fine particulates. BD440 shows geographic trends comparable to those in EQ3 (Figs. 2 and 3), revealing that this band depth is partially decoupled from the characteristics that lead to variation in R987/814. See Fig. A.7 for error maps. |
5 Conclusions
Based on spatially resolved OTES spectra, we can make predictions about the sample that will be returned from Bennu. Equatorial Station 3 spectra at the OSIRIS-REx mission’s sampling site (Nightingale, 56°N, 43°E) are most like T2. The contact pads of the Touch-and-Go Sample Acquisition Mechanism (TAGSAM; Bierhaus et al. 2018) should collect fine particles of less than ~100 microns in size, with the main sampling head containing particles up to the maximum ingestible size of 2–3 cm (Lauretta & the OSIRIS-REx TAG Team 2021). Based on similarities to highly aqueously altered ungrouped C1, CI, and CM meteorites, we predict that the bulk mineralogy will likely be dominated by Mg-phyllosilicates, with some magnetite and less than ~10 vol% anhydrous silicates. Carbonates and sulfide may also be present by analogy with CC meteorites. There does not appear to be evidence for significant post-aqueous alteration heating of the bulk sample, but localized areas of heating may be present. Based on the lack of an exact match to known meteorites, we speculate that Bennu’s bulk composition may not fall into an existing CC group or may represent one or more lithologies within an existing group that is poorly sampled in our collections. Alternatively, or in addition, the presence of even minor amounts of dust may partially obscure or modify the silicate stretching spectral features. The properties of some individual particles may vary, potentially greatly, from these compositional characteristics, providing even more insight into the history of this near-Earth asteroid.
Acknowledgements
The entire OSIRIS-REx team worked tirelessly to enable the collection of these data, for which we thank them sincerely. We appreciate a review of and comments on an early version of this manuscript by OSIRIS-REx team member B. Rozitis. This material is based on work supported by NASA under Contract NNM10AA11C issued through the New Frontiers Program. R.D.H. was supported by the OSIRIS-REx Participating Scientist Program under grant 80NSSC18K0229. This is LPI contribution 2613: LPI is operated by USRA under a cooperative agreement with the Science Mission Directorate of the National Aeronautics and Space Administration. OTES data are available via the Planetary Data System (PDS) (Christensen et al. 2019b). Data are delivered to the PDS according to the OSIRIS-REx Data Management Plan (Crombie & Selznick 2019).
Appendix A Supplemental material
A.1 OTES instrument description and data selection
The OTES instrument (Christensen et al. 2018) is a Michelson interferometer with heritage from the Mars Exploration Rovers Mini-Thermal Emission Spectrometer and Mars Global Surveyor Thermal Emission Spectrometer (Christensen et al. 2001, 2003). The field of view is 8 mrad, and the spectral sampling is 8.66 cm−1 across the entire spectrum for a resolution of ~17 cm−1. Instrument requirements and performance are described by Christensen et al. (2018). OTES-specific data quality fields and other details of the calibration are documented with the calibrated radiance data archived with the Planetary Data System (Christensen et al. 2019b) and in a more limited fashion in Hamilton et al. (2019).
The DS equatorial observation sequences consisted of positioning the spacecraft over the equator at a distance of ~4.8 km and nodding the spacecraft along a roughly north-south line; asteroid rotation built up global coverage, and there was overlap in the along- and across-track directions that varied with latitude. For OTES, the nominal (nadir) spatial resolution of these data is 40 m per spectrum (~1255 m2, not including smear due to spacecraft motion). Elongation of the footprint occurred at increasing emission angles (higher latitudes), resulting in measurements of larger surface areas. Daytime data acquired at greater mean emission angles (MEAs) tend to observe increasingly anisothermal surfaces, which can lead to very small increases in emissivity from 1000 to 900 cm−1, small reductions in emissivity from ~675–500 cm−1, and the addition of positive slopes at <400 cm−1, including a shallowing of the band at ~350 cm−1 (not shown). The EQ3 data were collected at MEAs of ~7–69° at a local time of ~12:30 pm, which offers the hottest surface temperatures – the best signal-to-noise ratio (S/N) – and the least amount of shadowing at the equator. To avoid anisothermality effects attributable to instrument pointing, we restricted our analysis to spectra acquired with MEAs <55°. (The potential effects of an MEA on spectral indices are described below.) Spectra were selected to be fully on-body and have an OTES quality of 0–2 (Christensen et al. 2019b) for the best calibrated data. The total number of spectra meeting these criteria is 2395, which excludes repeat observations over a small longitude range at the end of the observing sequence. The EQ6 data were measured at a local time of ~8:40 pm; we applied the same quality and MEA constraints and required the spectral footprints to be fully on-body, for a total of 2328 spectra. These data do not exhibit the spectral effects with increasing emission angle that are observed in daytime data.
A.2 OTES spectral indices
The OTES R987/814 index is the average emissivity of OTES channels 113-115 (~996–978 cm−1) divided by the average of channels 93–95 (~823–805 cm−1). BD440 is the average emissivity of channels 60–62 (~537–520 cm−1) plus the average emissivity of channels 43-45 (~390–372 cm−1) divided by two, divided by the average emissivity in channels 50–51 (~442–433 cm−1). Error valueswere calculated for each index value by taking the standard error at each spectral average location (e.g., channels 113–115 and93–95 for the R987/814 index) and propagating them according to the math of the spectral index. The error for each index value was propagated again for global mapping, which uses weighted averages of the values for all footprints falling on a given facet of the Bennu shape model (i.e., weighted by the percentage of the facet that is covered by the footprint). The error maps for each index are shown in Fig. A.1, and the correlation between R987/814 and BD440 is shown in Fig. A.2.
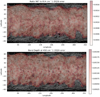 |
Fig. A.1 Error maps for OTES EQ3 spectral indices. Maps are stretched to values ± 2σ around the mean. In these and subsequent maps, errors are propagated from single OTES spots to shape model facets during mapping; facets at the edge of the mapped data or containing fewer overlapping spots may appear to exhibit greater errors. |
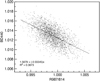 |
Fig. A.2 Scatterplot of R987/814 and BD440 spectral index values, showing linear regression. The R2 value indicates that although these parameters are modestly related, there are one or more other factors influencing the calculated values. |
Spectral indices can be affected by characteristics of the data that may not be related to the spectral feature of interest. Forexample, as described above, anisothermality (e.g., at the highest MEA) can lead to subtle changes in spectral shape. We observe no correlation between any of the index values and the MEA for any value of the MEA (~7°–69°). Nonetheless, we examined the two index values calculated for the average of all spectra with MEAs <15° and for the average of all spectra withMEAs of 45–50° (the highest MEA in our data set); the differences in the index values calculated for these two averages are: 0.0013 (R987/814) and 0.0004 (BD440). Therefore, any differences greater than these values (incorporating uncertainties) are not attributable to the MEA. Finally, variability in index values may also occur as a function of the S/N among the individual spectra, but they are detectable through higher error values. Maps of the spectral indices were made using the v20 shape model of Barnouin et al. (2019), with the data combined on facets as weighted averages (Ferrone et al. 2021).
A.3 Non-negative linear least squares model
Here we used the NNLS implementation of Rogers & Aharonson (2008). The inputs to the model were the measured OTES Bennu spectra, a library of spectra to be used in the fitting (in this case, the T1 and T2 end-member spectra described in Sect. 3.1, which are 100-spectrum averages from the EQ3 data set), and a wavenumber region over which the fit should be made (here, 1300–300 cm−1). A blackbody spectrum was also included as a library spectrum to account for differences in spectral contrast (Hamilton et al. 1997) between the T1 and T2 end-member spectra and the individual OTES spectra to be modeled. The outputs of the model are, for each measured OTES spectrum, the fractional abundance of each library component (T1 and T2), the best fit spectrum, and the RMS error. The abundances of the spectral end members were normalized to exclude the featureless blackbody component. We caution that RMS error values are dependent on the overall contrast of the spectrum being fit and are only rigorously comparable between fits to different spectra if the total contrast of those spectra is the same. Although we do observe some contrast differences, the OTES Bennu spectra are generally relatively uniform in their contrast, 2%, and therefore we compared their RMS errors for the purposes of searching for gross misfits.
There is a linear correlation between the modeled T1 abundance (as well as that of T2 because there are only two end members) and R987/814 (R2 = 0.71, not shown); the correlation between the T1 abundance and BD440 is weaker (R2 = 0.42, not shown), as expected based on the fact that the end members are defined by R987/814, not BD440. There is no correlation between the model RMS errors and R987/814, BD440, or the T1 abundance, indicating there are no systematic errors in the model fits. As described in the main text and above, R987/814 is a distillation of spectral information down to a single value and is the basis for defining T1 and T2. We know from the lack of a strong correlation with BD440 that factors such as spectral contrast also vary independently of R987/814 (and the T1 abundance), so a perfect correlation is not expected. We note, however, that additional factors such as variability in the S/N (i.e., as a function of surface temperature) can increase the RMS error for what would otherwise subjectively be considered equivalently good fits. Maps of the modeled abundance were created using the same method as described above for OTES indices, and the RMS error map is shown in Fig. A.3.
A.4 Laboratory spectra
All laboratory spectra were resampled to the OTES spectral resolution. Table A.1 lists all the laboratory spectra shown in this paper along with the physical form of the physical sample, the sample source, measurement type, and reference(s) describing data acquisition and calibration methods. All samples were measured under ambient conditions; this is acceptable because Bennu spectra do not contain evidence of volumetrically abundant fine particulates that exhibit significant thermal gradients (Hamilton et al. 2019, this work). In addition, measurements of powdered, low-albedo, hydrated CCs in a simulated asteroid environment by Donaldson Hanna et al. (2019) indicate that these materials exhibit negligible thermal gradients, further validating the utility of ambient spectra for comparison to Bennu.
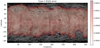 |
Fig. A.3 RMS error map for OTES EQ3 linear least squares model fits. Values are fractional percentage emissivity (e.g., 0.0014 = 0.14%). |
A.5 Magnetite in CC meteorites
In chondrites, magnetite (ideally Fe3 O4) forms by aqueous alteration of Fe,Ni metal (e.g., Brearley 2006; Davidson et al. 2014; Rubin & Li 2019). Magnetite is present in numerous CC groups at varying abundances, but at abundances below 11 vol%: 2–8 vol% in CO chondrites (Rubin & Li 2019), 0–5 vol% in CY chondrites (King et al. 2019), 1.2–8.1 vol% in CK chondrites (Geiger & Bischoff 1995), 0.3–6.1 vol% in CV chondrites (Howard et al. 2010; Donaldson Hanna et al. 2019), 0.6–8.4 vol% in CM chondrites (Howard et al. 2015; Donaldson Hanna et al. 2019), 2–10 vol% in CI chondrites (King et al. 2015), and typically between 0 and 0.9 vol%, but up to 10.9 vol%, in CR chondrites (King et al. 2019; Donaldson Hanna et al. 2019). In CCs, magnetite istypically present as spherulites, framboids, plaquettes, and platelets in the matrix, but it is also present in chondrules in more altered samples (e.g., Brearley 2006; Davidson et al. 2014; Rubin & Li 2019). Although magnetite forms via parent asteroid aqueous alteration, its absence in most thermally altered chondrites (type ≥ 3.2) indicates that it is destroyed during thermal metamorphism (Rubin & Li 2019). However, magnetite is present in CK3 to CK6 chondrites that were heated up to ~740 °C (Schrader et al. 2016). Magnetite in CK chondrites is unique among chondrites as it is Cr-rich (e.g., Davidson et al. 2014; Rubin & Li 2019), which led Rubin & Li (2019) to propose that the high Cr content of CK chondrite magnetite made it stable during thermal metamorphism. Magnetite can also form during mild heating (<400 °C) in CM chondrites at the expense of tochilinite (Tonui et al. 2014; Lee et al. 2016; Lindgren et al. 2020). Magnetite is observed in three of the six heated (>500°C) CY chondrites described by King et al. (2015, 2019) at up to 5 vol%. These CYs contain only 8–11 vol% secondary olivine, which could be consistent with the OTES spectra, but their phyllosilicates (67–71 vol%) have been dehydrated, which is notconsistent with the spectral observations of Bennu at near-infrared wavelengths reported by Hamilton et al. (2019).
Laboratory samples and measurements shown in this work.
A.6 Identification of the phase responsible for the 1420 cm−1 peak in OTES data
Bennu surface temperatures during EQ3 are generally a bit lower (average 316 K) than the 325 K temperatures for which OTES performance is optimized (in terms of the S/N); overall, the OTES S/N falls off at the highest and lowest wavenumbers of the measured spectral region (Christensen et al. 2018). As such, the spectral region >1300 cm−1 has a considerably lower S/N than the 1300–200 cm−1 region. To obtain an improved S/N for the analysis of the higher wavenumber region, we used the T1 and T2 OTES spectra from Fig. 1 (100-spectrum averages).
In CCs, the spectral region >1100 cm−1 is a region oftransparency (no spectral features) for most solid or coarse particulate silicate and oxide minerals. Carbonates exhibit a wide fundamental absorption (ν3) with a minimum that varies in position with composition from ~1480–1575 cm−1 (e.g., Lane & Christensen 1997), whereas the minerals pyrrhotite (an iron sulfide) and spinel exhibit peaks near 1425 and 1435 cm−1 in the data we collected. Water bound in minerals has an absorption in this region (a bending mode at ~1630 cm−1), but it is not typically observed in coarse or solid samples. If sufficiently fine particulates are present, however, volume scattering results in decreased emissivity in silicates (Moersch & Christensen 1995, and references therein), and strong absorbers (e.g., carbonate, water) can become peaks in the emissivity spectrum, even in very small quantities (a few percent; Bandfield et al. 2003; Ruff 2004). This is because the absorption bands remain (nearly) saturated as particle size is reduced and the emissivity in the band wings decreases due to increased scattering, causing the absorption bands to appear as peaks.
To identify phases that could be responsible for the peak at 1420 cm−1 in the Bennu data, we compared the T1 and T2 spectra with fine and coarse particulate meteorite and mineral spectra thathave a peak in this spectral region (Fig. A.4). Next, we searched for spectral features at <1300 cm−1 that would be expected to be seen if a given phase were present. Unfortunately, we did not see unambiguous evidence for the presence of any particular phase(s). Because the unknown phase may be present at as a little as a few percent abundance or less, detection of any spectral features at <1300 cm−1 could be challenging because they would produce only a negligible contribution to spectral regions that also include silicate and oxide features and already have low (2%) contrast.
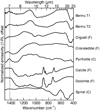 |
Fig. A.4 Comparison of Bennu T1 and T2 spectra to the Orgueil CI meteorite (same as in Fig. A.5) and minerals known in CC meteorites that have peaks of varying strength and width near 1420 cm−1 (dotted line). Spectra represent fine (F) to coarse (C) particulates and have been normalized to a common contrast for comparison. |
A.7 Evidence for thin dust deposits on solid substrates
Dust occurs on planetary surfaces in both optically thick (in the TIR) and thin physical configurations (e.g., Johnson et al. 2002; Graff 2003; Hamilton & Ruff 2012; Rivera-Hernandez et al. 2015). Optically thick dust absorbs or scatters the radiance from the underlying substrate, and the resulting spectrum is that of the dust alone for a laterally uniform layer; signatures of optically thick CC meteorite analog powders (e.g., Fig. A.5), whether measured under ambient or vacuum conditions (Donaldson Hanna et al. 2019), have not been observed on Bennu to date (Hamilton et al. 2019). Optically thin or patchy dust does not completely absorb or scatter the radiance of the underlying substrate, and spectral features of both the dust and the substrate may be observed. In situations where the dust and substrate are at different temperatures (a few degrees), particularly where optically thin dust is at a temperature warmer than that of the substrate, unusual spectral features may be observed as the warm dust adds additional radiance that in turn leads to an increase in apparent emissivity (e.g., Hamilton & Ruff 2012), as described by the physical model of Rivera-Hernandez et al. (2015). The OTES data do not appear to exhibit spectral evidence of optically thin dust that has a temperature notably hotter than that of the substrate, as observed by Ruff & Bandfield (2010) and Hamilton & Ruff (2012), or to comprise so-called fairy-castle structures (e.g., Hapke & van Horn 1963; Salisbury & Wald 1992), so we focused on the case where dust coatings are thin, may be laterally continuous or discontinuous, and are at a temperature comparable to that of the substrate.
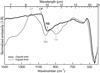 |
Fig. A.5 Spectra of solid (thin section) and fine-particulate Orgueil (CI). The fine particulates are dominated (67 wt%) by particles of <~40 μm (Donaldson Hanna et al. 2019). Spectra are normalized for comparison, and the fine particulate spectrum has had a small LOESS (generalized Savitsky-Golay) filter (0.15 width) applied to reduce the appearance of noise in the normalized spectrum. Bennu T1 and T2 spectra (Fig. 4) are not consistent with a volumetrically dominant fine-particulate component, which exhibits a considerable shift in the CF to higher wavenumbers, a shift in the silicate stretching the Reststrahlen band (RB) to higher wavenumbers, and a strong transparency feature (TF) at 895 cm−1. |
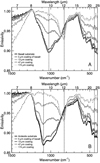 |
Fig. A.6 Basaltic dust coatings of variable thickness on solid basalt (A) and andesite(B) substrates (from Graff 2003). Characteristics of spectra with thin coatings of 5–13 μm are more similar to those observed in Bennu T2 spectra. Coatings ≥47 μm result in transparency features that are stronger than the features observed in the Bennu spectra. |
We are unaware of any published laboratory TIR measurements of dust coatings that utilize CC materials, so we refer to the work of Johnson et al. (2002) and Graff (2003), which used igneous materials (e.g., unaltered basaltic dust). Rivera-Hernandez et al. (2015) considered phyllosilicates in their modeling of dust coatings and identified similar behavior, so we accept the behavior observed experimentally as reasonably analogous to what should be expected for aqueously altered (i.e., phyllosilicate-rich) CC, and there is no reason to believe that the physics of scattering in silicates in CC meteorites is somehow fundamentally different than that of silicates in igneous rocks. The Johnson et al. (2002) and Graff (2003) studies showed that the deposition of dust on rock substrates reduces the spectral contrast of the substrate at coating thicknesses of as little as 5–20 μm, and that thicker coatings (on the order of 35–50 μm or more) can obscure characteristics of the substrate in favor of those of the dust, including by exhibiting transparency features. In Fig. A.6 we show spectra from the work of Graff (2003), who deposited layers of basaltic dust (with a particle size distribution of 17 wt% 2–5 μm, 13 wt% <2 μm, 68 wt% 5–50 μm, and 1.8 wt% >50 μm) on solid basalt and andesitesubstrates. These spectra do not display typical transparency features in TIR spectra unless the thickness of the dust layer is on the order of >~10 μm. These physical conditions can be described by a “checkerboard” mixing model where the dust and rock radiateindependently in proportion to their fractional abundance. At dust thicknesses of 5 ± 2μm or 13 ± 2μm, the spectral features are dominated by those of the substrate. A 5 μm thick layer reduces the depth of the minimum on the high wavenumber side of the silicate stretching feature and reduces the overall contrast of the silicate bending feature without substantially changing its shape. At a thickness of 13 μm, the silicate stretching minimum is further reduced in contrast and an incipient transparency feature effectively broadens the shape of the band; subtle changes to the silicate bending mode are visible along with a further reduction in spectral contrast. A parameter similar to R987/814 applied to these dust-coated rocks would exhibit a similar trend as that seen in Bennu’s T1 and T2 OTES spectra. These data suggest that only a very thin layer of dust, on the order of 10 μm thick and dominated by particles <50 μm, on Bennu’s rocks can explain the observed OTES spectral variations with the dust being at a temperature comparable to that of the substrate rocks. The most relevant characteristics to the physics are the thickness of the dust coating and the temperature differential (if any) between the dust and the substrate. If for some reason the nature of CC materials changes the thicknesses at which these spectral trends are observed, then our estimates may need to be revised, although the thermal inertia data place independent limits on the thickness of any dust that is present.
As described in the main text, nighttime spectral shapes are dominated by the highest thermal inertia component in the scene. The error maps for the EQ6 R987/814 and BD440 spectral indices described in Sect. 4.2 are shown in Fig. A.7.
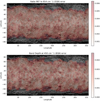 |
Fig. A.7 Error maps for OTES EQ6 spectral indices. Maps are stretched to values ±2 sigma around the mean. |
References
- Aronson, J. R., & Emslie, A. G. 1973, Appl. Opt., 12, 2573 [Google Scholar]
- Bandfield, J., Glotch, T., & Christensen, P. 2003, Science, 301, 1084 [Google Scholar]
- Barnouin, O. S., Daly, M. G., Palmer, E. E., et al. 2019, Nat. Geosci., 12, 247 [NASA ADS] [CrossRef] [Google Scholar]
- Bennett, C., DellaGiustina, D., Becker, K., et al. 2020, Icarus, 113690 [CrossRef] [Google Scholar]
- Bierhaus, E. B., Clark, B. C., Harris, J., et al. 2018, Space Sci. Rev., 214, 107 [Google Scholar]
- Brearley, A. J. 2006, The Action of Water (University of Arizona Press) [Google Scholar]
- Brunetto, R., Lantz, C., Nakamura, T., et al. 2020, Icarus, 345, 113722 [Google Scholar]
- Christensen, P. R., Bandfield, J. L., Hamilton, V. E., et al. 2001, J. Geophys. Res., 106, 23823 [NASA ADS] [CrossRef] [Google Scholar]
- Christensen, P. R., Mehall, G. L., Silverman, S. H., et al. 2003, J. Geophys. Res., 108, 8064 [Google Scholar]
- Christensen, P. R., Engle, E., Anwar, S., et al. 2009, in Eos Trans. Am. Geophys. Union, Fall Meet. Suppl., IN22A-06 [Google Scholar]
- Christensen, P. R., Hamilton, V. E., Mehall, G. L., et al. 2018, Space Sci. Rev., 214 [Google Scholar]
- Christensen, P. R., Hamilton, V. E., Anwar, S., Mehall, G., & Lauretta, D. S. 2019a, Origins, Spectral Interpretation, Resource Identification, Security, Regolith Explorer (OSIRIS-REx): OSIRIS-REx Thermal Emission Spectrometer Bundle, NASA Planetary Data System [Google Scholar]
- Christensen, P. R., Hamilton, V. E., Anwar, S., Mehall, G., & Lauretta, D. S. 2019b, NASA Planetary Data System [Google Scholar]
- Clark, B. E., Binzel, R. P., Howell, E. S., et al. 2011, Icarus, 216, 462 [Google Scholar]
- Crombie, M. K., & Selznick, S. H. 2019, Origins, Spectral Interpretation, Resource Identification, Security, Regolith Explorer (OSIRIS-REx): Mission Bundle, NASA Planetary Data System [Google Scholar]
- Davidson, J., Krot, A. N., Nagashima, K., Hellebrand, E., & Lauretta, D. S. 2014, Meteor. Planet. Sci., 49, 1456 [Google Scholar]
- DellaGiustina, D. N., Emery, J. P., Golish, D. R., et al. 2019, Nat. Astron., 3, 341 [Google Scholar]
- DellaGiustina, D. N., Burke, K. N., Walsh, K. J., et al. 2020, Science, 370, eabc3660 [Google Scholar]
- DellaGiustina, D. N., Kaplan, H. H., Simon, A. A., et al. 2021, Nat. Astron., 5, 31 [Google Scholar]
- Donaldson Hanna, K. L., Schrader, D. L., Cloutis, E. A., et al. 2019, Icarus, 319, 701 [Google Scholar]
- Ferrone, S. M., Clark, B. E., Hawley, C. L., et al. 2021, Earth Space Sci., 8, e00613 [Google Scholar]
- Geiger, T., & Bischoff, A. 1995, Planet. Space Sci., 43, 485 [Google Scholar]
- Goodrich, C. A., Zolensky, M., Fioretti, A. M., et al. 2019, Meteor. Planet. Sci., 54, 2769 [Google Scholar]
- Graff, T. G. 2003, Master’s thesis, Arizona State University, USA [Google Scholar]
- Hamilton, V. E. 2010, Chem. Erde, 70, 7 [Google Scholar]
- Hamilton, V. E. 2018, 49th Lunar Planet. Sci. Conf., 19-23 March, 2018, held at The Woodlands, Texas LPI Contribution No. 2083, 1759 [Google Scholar]
- Hamilton, V. E., & Christensen, P. R. 2000, J. Geophys. Res., 105, 9717 [Google Scholar]
- Hamilton, V. E., & Lucey, P. G. 2005, 36th Annual Lunar Planet. Sci. Conf., March 14-18, 2005, in League City, Texas, 1272 [Google Scholar]
- Hamilton, V. E., & Ruff, S. W. 2012, Icarus, 218, 917 [CrossRef] [Google Scholar]
- Hamilton, V. E., Christensen, P. R., & McSween, H. Y. J. 1997, J. Geophys. Res., 102, 25593 [CrossRef] [Google Scholar]
- Hamilton, V. E., Simon, A. A., Christensen, P. R., et al. 2019, Nat. Astron., 3, 332 [Google Scholar]
- Hamilton, V. E., Haberle, C. W., & Mayerhöfer, T. G. 2020, Am. Min., 105, 1756 [CrossRef] [Google Scholar]
- Hanna, R. D., Hamilton, V. E., Haberle, C. W., et al. 2020, Icarus, 346, 113760 [CrossRef] [Google Scholar]
- Hapke, B., & van Horn, H. 1963, J. Geophys. Res., 68, 4545 [NASA ADS] [CrossRef] [Google Scholar]
- Howard, K. T., Benedix, G. K., Bland, P. A., & Cressey, G. 2010, Geochim. Cosmochim. Acta, 74, 5084 [Google Scholar]
- Howard, K. T., Benedix, G. K., Bland, P. A., & Cressey, G. 2011, Geochim. Cosmochim. Acta, 75, 2735 [NASA ADS] [CrossRef] [Google Scholar]
- Howard, K. T., Alexander, C. M. O., Schrader, D. L., & Dyl, K. A. 2015, Geochim. Cosmochim. Acta, 149, 206 [Google Scholar]
- Jawin, E. R., McCoy, T. J., Walsh, K. J., et al. 2021, 52nd Lunar Planet. Sci. Conf., held virtually, 15-19 March, 2021, LPI Contribution No. 2548, 2022 [Google Scholar]
- Johnson, J. R., Christensen, P. R., & Lucey, P. G. 2002, J. Geophys. Res., 107, 5035 [Google Scholar]
- Kaplan, H., Lauretta, D. S., Simon, A. A., et al. 2020, Science, 370, eabc3557 [CrossRef] [Google Scholar]
- King, A. J., Schofield, P. F., Howard, K. T., & Russell, S. S. 2015, Geochim. Cosmochim. Acta, 165, 148 [NASA ADS] [CrossRef] [Google Scholar]
- King, A. J., Bates, H. C., Krietsch, D., et al. 2019, Geochemistry, 79, 125531 [Google Scholar]
- Lane, M. D., & Christensen, P. R. 1997, J. Geophys. Res., 102, 25, 581 [Google Scholar]
- Lauretta, D. S., & the OSIRIS-REx TAG Team 2021, 52nd Lunar Planet. Sci. Conf., held virtually, 15-19 March, 2021, LPI Contribution No. 2548, 2097 [Google Scholar]
- Lauretta, D. S., Balram-Knutson, S. S., Beshore, E., et al. 2017, Space Sci. Rev., 212, 925 [Google Scholar]
- Lauretta, D. S., DellaGiustina, D. N., Bennett, C. A., et al. 2019, Nature, 568, 55 [NASA ADS] [CrossRef] [PubMed] [Google Scholar]
- Lee, M. R., Lindgren, P., King, A. J., et al. 2016, Geochim. Cosmochim. Acta, 187, 237 [Google Scholar]
- Lindgren, P., Lee, M. R., Sparkes, R., et al. 2020, Geochim. Cosmochim. Acta, 289, 69 [Google Scholar]
- Lyon, R. J. P. 1965, Econ. Geol., 60, 715 [Google Scholar]
- Moersch, J. E., & Christensen, P. R. 1995, J. Geophys. Res., 100, 465 [Google Scholar]
- Mustard, J. F., & Hayes, J. E. 1997, Icarus, 125, 146 [Google Scholar]
- Osterloo, M. O., Hamilton, V. E., & Anderson, F. S. 2012, Icarus, 220, 404 [Google Scholar]
- Putzig, N. E., & Mellon, M. T. 2007, Icarus, 191, 68 [NASA ADS] [CrossRef] [Google Scholar]
- Ramsey, M. S., & Christensen, P. R. 1998, J. Geophys. Res., 103, 577 [NASA ADS] [CrossRef] [Google Scholar]
- Ramsey, M. S., & Fink, J. H. 1999, Bull. Volc., 61, 32 [Google Scholar]
- Rivera-Hernandez, F., Bandfield, J., Ruff, S., & Wolff, M. 2015, Icarus, 262, 173 [Google Scholar]
- Rogers, A. D., & Aharonson, O. 2008, J. Geophys. Res., 113, E06S14 [Google Scholar]
- Rozitis, B., Ryan, A., Emery, J., et al. 2020, Sci. Adv., 6, eabc3699 [Google Scholar]
- Rubin, A. E., & Li, Y. 2019, Meteor. Planet. Sci., 79, 125528 [Google Scholar]
- Ruff, S. W. 1998, PhD dissertation, Arizona State University, USA [Google Scholar]
- Ruff, S. W. 2004, Icarus, 168, 131 [Google Scholar]
- Ruff, S. W., & Bandfield, J. L. 2010, 41st Lunar Planet. Sci. Conf., held March 1-5, 2010 in The Woodlands, Texas, LPI Contribution No. 1533, 2411 [Google Scholar]
- Salisbury, J. W., & Eastes, J. W. 1985, Icarus, 64, 586 [NASA ADS] [CrossRef] [Google Scholar]
- Salisbury, J. W., & Walter, L. S. 1989, J. Geophys. Res., 94, 9192 [NASA ADS] [CrossRef] [Google Scholar]
- Salisbury, J. W., & Wald, A. 1992, Icarus, 96, 121 [Google Scholar]
- Salisbury, J. W., D’Aria, D. M., & Jarosewich, E. 1991a, Icarus, 92, 280 [NASA ADS] [CrossRef] [Google Scholar]
- Salisbury, J. W., Walter, L. S., Vergo, N., & D’Aria, D. M. 1991b, Infrared (2.1–25 μm) Spectra of Minerals (The Johns Hopkins University Press) [Google Scholar]
- Schrader, D. L., Davidson, J., & McCoy, T. J. 2016, Geochim. Cosmochim. Acta, 189, 359 [Google Scholar]
- Shirley, K., & Glotch, T. 2019, J. Geophys. Res., 124, 970 [Google Scholar]
- Simon, A. A., Kaplan, H. H., Hamilton, V. E., et al. 2020, Science, 370, eabc3522 [Google Scholar]
- Thomson, J. L., & Salisbury, J. W. 1993, Remote Sens. Environ., 45, 1 [Google Scholar]
- Tonui, E., Zolensky, M., Hiroi, T., et al. 2014, Geochim. Cosmochim. Acta, 126, 284 [NASA ADS] [CrossRef] [Google Scholar]
- Van Schmus, W., & Wood, J. 1967, Geochim. Cosmochim. Acta, 31, 747 [NASA ADS] [CrossRef] [Google Scholar]
All Tables
All Figures
|
Fig. 1 OTES spectra demonstrating key spectral variations. (A) OTES global average spectrum and spectral types T1 (blue) and T2 (red), with the two types defined by averages of the 100 spectra that have the lowest and highest 987/814 cm−1 ratio values (R987/814), respectively. The colors of the spectra are correlated with the colors in the maps in Figs. 2A and 2C. Features described in the text are annotated. Data were acquired at the EQ3 (12:30 pm) DS station when maximum brightness temperatures ranged from 304 to 338 K. (B) EQ3 spectral averages representing minimum (red, Type 2) and maximum (blue, Type 1) BD440 values. (Colors are inverted from those shownin Fig. 2B so as to correlate with spectral type rather than index value.) |
| In the text | |
|
Fig. 2 Distribution maps of the OTES spectral types. (A) Ratio of 987/814 cm−1; blue is OTES T1 and red is OTES T2. (B) Band depth at 440 cm−1, modestly inversely correlated with R987/814 (see text for details). (C) Linear least squares modeled abundance distribution of T2 (where 0% = T1). The minimum and maximum scale bar values of (A) and (B) are ±2 standard deviations from the mean. All maps in this and subsequent figures are overlaid on the base map of Bennett et al. (2020); the yellow star denotes the Nightingale site. |
| In the text | |
|
Fig. 3 Examples of T1- and T2-bearing terrains; images are colorized following the spectra in Fig. 1A, with blue representing T1 and red representing T2. Individual OTES spots are overlaid on the base map of Bennett et al. (2020) using the open source J-Asteroid GIS software package (documented as JMARS by Christensen et al. 2009). (A) Relatively boulder-free region near Aellopus Saxum (image centered near 25.5°N, 336°E) with some of the strongest T1 signatures. (B) Large boulder at Roc Saxum (image centered near −23°N, 23°E) with some of the strongest T2 signatures. Grids are 10° of latitude and longitude, or roughly 43 m; OTES spots are approximately 38 m in diameter at these latitudes. |
| In the text | |
|
Fig. 4 Comparison of T1 and T2 spectra with laboratory spectra of aqueously altered CC meteorites at OTES spectral resolution. Samples are polished thin sections. Dotted vertical lines denote features of interest in the Bennu spectra at 1095, 987, 814, 528, and 440 cm−1. MeteoriticalBulletin classifications are given for all (except AhS 91A_1, which is given by Goodrich et al. 2019), followed by the proposed classification of Howard et al. (2015) for CM chondrites. See Appendix A.4 for more information. |
| In the text | |
|
Fig. 5 Comparison of daytime and nighttime OTES spectra. (A) OTES nighttime spectra (EQ6, 8:40 pm) that have the lowest and highest R987/814 values (T1 and T2, respectively) in comparison with EQ3 (daytime) data from Fig. 1. Temperatures at this local time range from 229–287 K; because the signal-to-noise ratio (S/N) is a function of temperature, averages of 300 nighttime spectra are shown to increase the S/N. Standard errors are shown asvertical lines at each point in the spectrum; errors at wavenumbers lower than about 1100 cm−1 are close to the line width in many cases. An area of systematic noise in these very low temperature data is excluded. (B) Average (N = 300) nighttime spectra that have the lowest and highest BD440 values. There is little variability in silicate stretching features in nighttime data, suggesting that variations in daytime data are largely attributable to particle size effects. BD440 shows that spectral contrast variations persist across the spectrum at night; these likely represent rocks (deeper) and coarse particulates (shallower). |
| In the text | |
|
Fig. 6 Spectral indices R987/814 (A) and BD440 for EQ6 (B; 8:40 pm), with color maps scaled to the ranges in Fig. 2. There is much less diversity in R987/814 than in the EQ3 data (Figs. 2 and 3). High inertia (coarser) materials emit most strongly at night and little geographic correlation is visible, suggesting that variation in this parameter in the daytime data is due primarily to differences in the relative abundance of fine particulates. BD440 shows geographic trends comparable to those in EQ3 (Figs. 2 and 3), revealing that this band depth is partially decoupled from the characteristics that lead to variation in R987/814. See Fig. A.7 for error maps. |
| In the text | |
|
Fig. A.1 Error maps for OTES EQ3 spectral indices. Maps are stretched to values ± 2σ around the mean. In these and subsequent maps, errors are propagated from single OTES spots to shape model facets during mapping; facets at the edge of the mapped data or containing fewer overlapping spots may appear to exhibit greater errors. |
| In the text | |
|
Fig. A.2 Scatterplot of R987/814 and BD440 spectral index values, showing linear regression. The R2 value indicates that although these parameters are modestly related, there are one or more other factors influencing the calculated values. |
| In the text | |
|
Fig. A.3 RMS error map for OTES EQ3 linear least squares model fits. Values are fractional percentage emissivity (e.g., 0.0014 = 0.14%). |
| In the text | |
|
Fig. A.4 Comparison of Bennu T1 and T2 spectra to the Orgueil CI meteorite (same as in Fig. A.5) and minerals known in CC meteorites that have peaks of varying strength and width near 1420 cm−1 (dotted line). Spectra represent fine (F) to coarse (C) particulates and have been normalized to a common contrast for comparison. |
| In the text | |
|
Fig. A.5 Spectra of solid (thin section) and fine-particulate Orgueil (CI). The fine particulates are dominated (67 wt%) by particles of <~40 μm (Donaldson Hanna et al. 2019). Spectra are normalized for comparison, and the fine particulate spectrum has had a small LOESS (generalized Savitsky-Golay) filter (0.15 width) applied to reduce the appearance of noise in the normalized spectrum. Bennu T1 and T2 spectra (Fig. 4) are not consistent with a volumetrically dominant fine-particulate component, which exhibits a considerable shift in the CF to higher wavenumbers, a shift in the silicate stretching the Reststrahlen band (RB) to higher wavenumbers, and a strong transparency feature (TF) at 895 cm−1. |
| In the text | |
|
Fig. A.6 Basaltic dust coatings of variable thickness on solid basalt (A) and andesite(B) substrates (from Graff 2003). Characteristics of spectra with thin coatings of 5–13 μm are more similar to those observed in Bennu T2 spectra. Coatings ≥47 μm result in transparency features that are stronger than the features observed in the Bennu spectra. |
| In the text | |
|
Fig. A.7 Error maps for OTES EQ6 spectral indices. Maps are stretched to values ±2 sigma around the mean. |
| In the text | |
Current usage metrics show cumulative count of Article Views (full-text article views including HTML views, PDF and ePub downloads, according to the available data) and Abstracts Views on Vision4Press platform.
Data correspond to usage on the plateform after 2015. The current usage metrics is available 48-96 hours after online publication and is updated daily on week days.
Initial download of the metrics may take a while.