Fig. 1
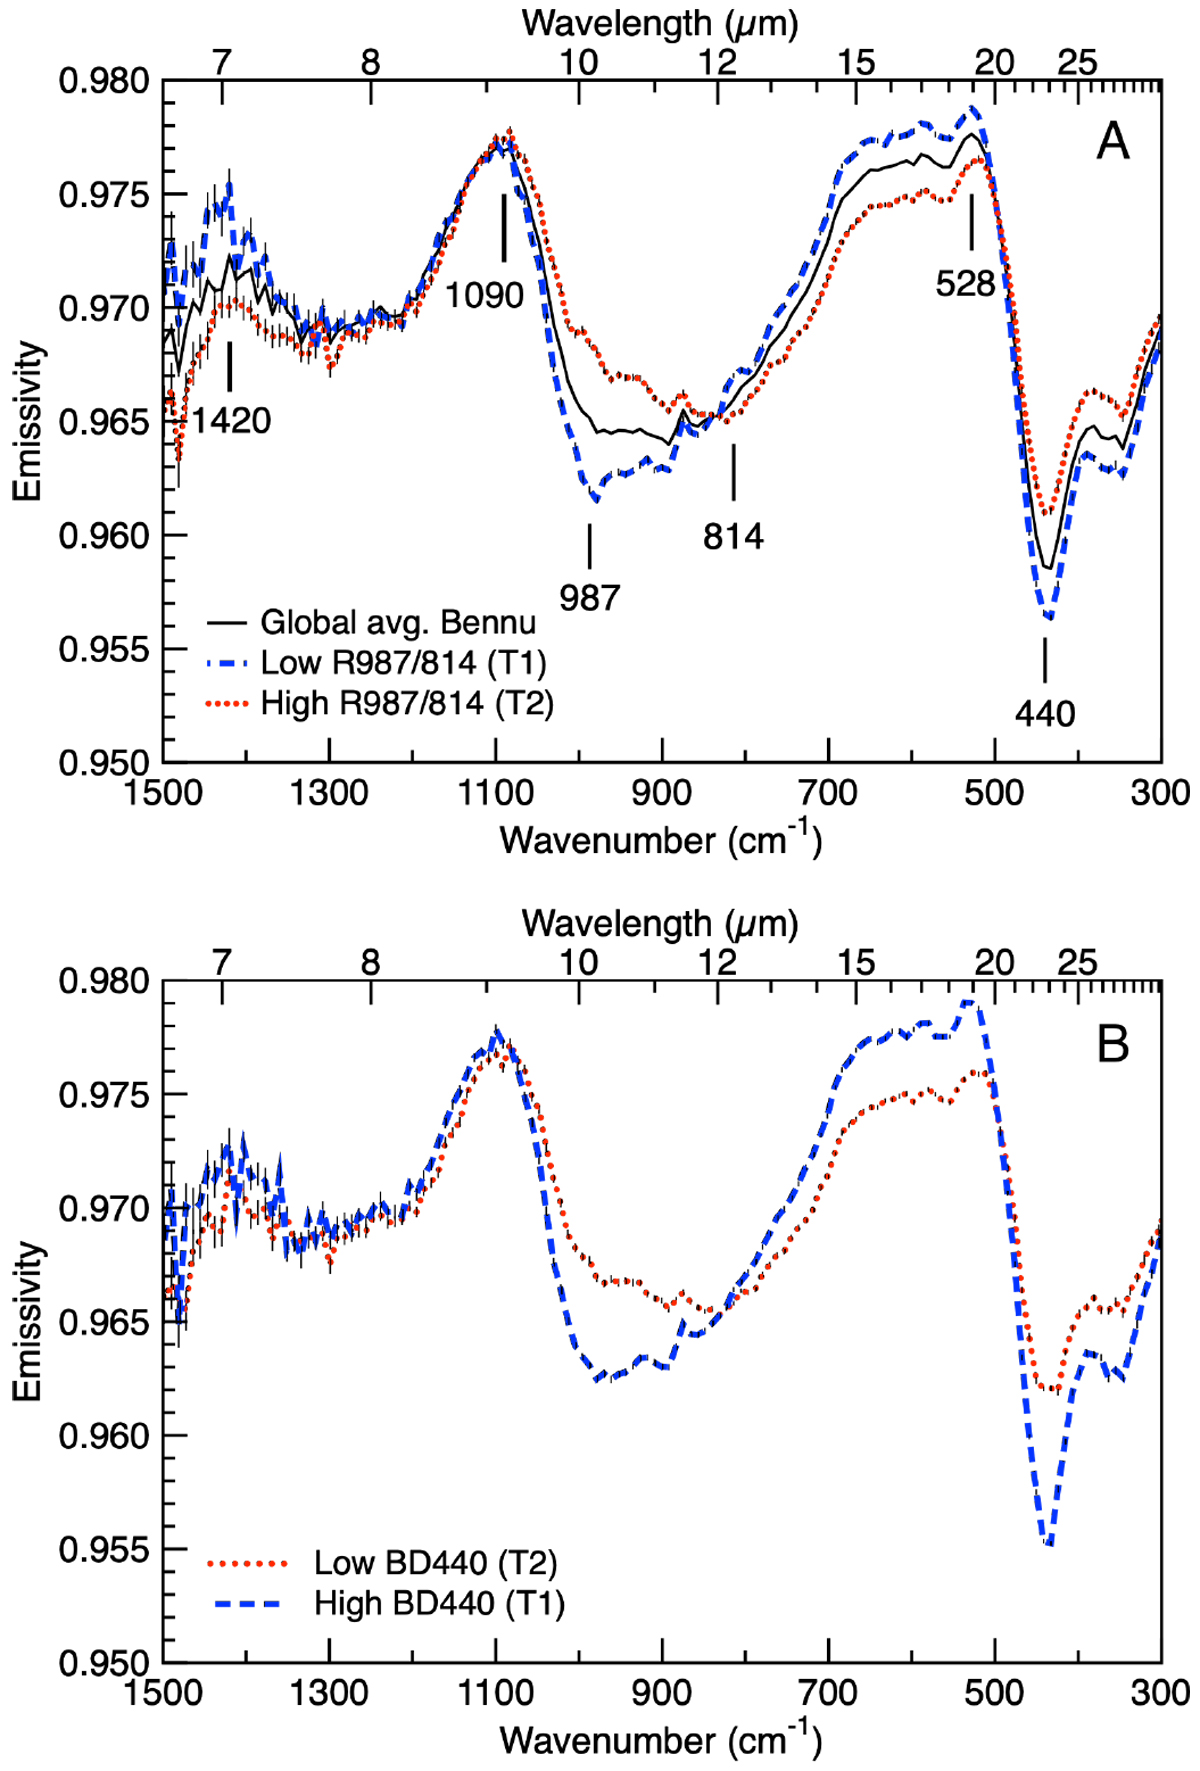
OTES spectra demonstrating key spectral variations. (A) OTES global average spectrum and spectral types T1 (blue) and T2 (red), with the two types defined by averages of the 100 spectra that have the lowest and highest 987/814 cm−1 ratio values (R987/814), respectively. The colors of the spectra are correlated with the colors in the maps in Figs. 2A and 2C. Features described in the text are annotated. Data were acquired at the EQ3 (12:30 pm) DS station when maximum brightness temperatures ranged from 304 to 338 K. (B) EQ3 spectral averages representing minimum (red, Type 2) and maximum (blue, Type 1) BD440 values. (Colors are inverted from those shownin Fig. 2B so as to correlate with spectral type rather than index value.)
Current usage metrics show cumulative count of Article Views (full-text article views including HTML views, PDF and ePub downloads, according to the available data) and Abstracts Views on Vision4Press platform.
Data correspond to usage on the plateform after 2015. The current usage metrics is available 48-96 hours after online publication and is updated daily on week days.
Initial download of the metrics may take a while.