Free Access
Fig. A.1
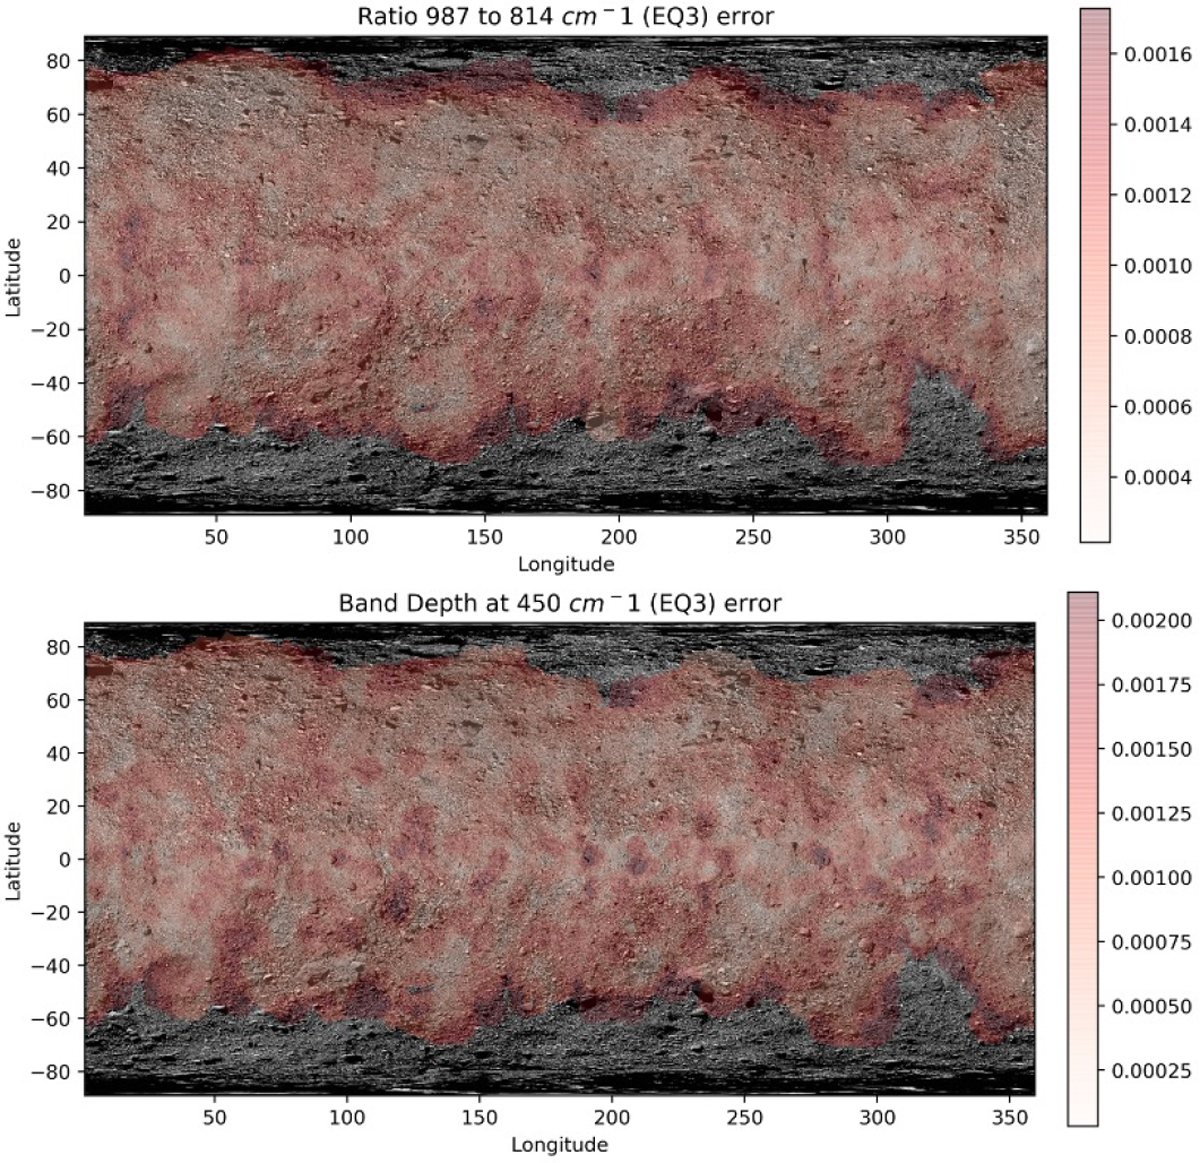
Error maps for OTES EQ3 spectral indices. Maps are stretched to values ± 2σ around the mean. In these and subsequent maps, errors are propagated from single OTES spots to shape model facets during mapping; facets at the edge of the mapped data or containing fewer overlapping spots may appear to exhibit greater errors.
Current usage metrics show cumulative count of Article Views (full-text article views including HTML views, PDF and ePub downloads, according to the available data) and Abstracts Views on Vision4Press platform.
Data correspond to usage on the plateform after 2015. The current usage metrics is available 48-96 hours after online publication and is updated daily on week days.
Initial download of the metrics may take a while.