Fig. 6
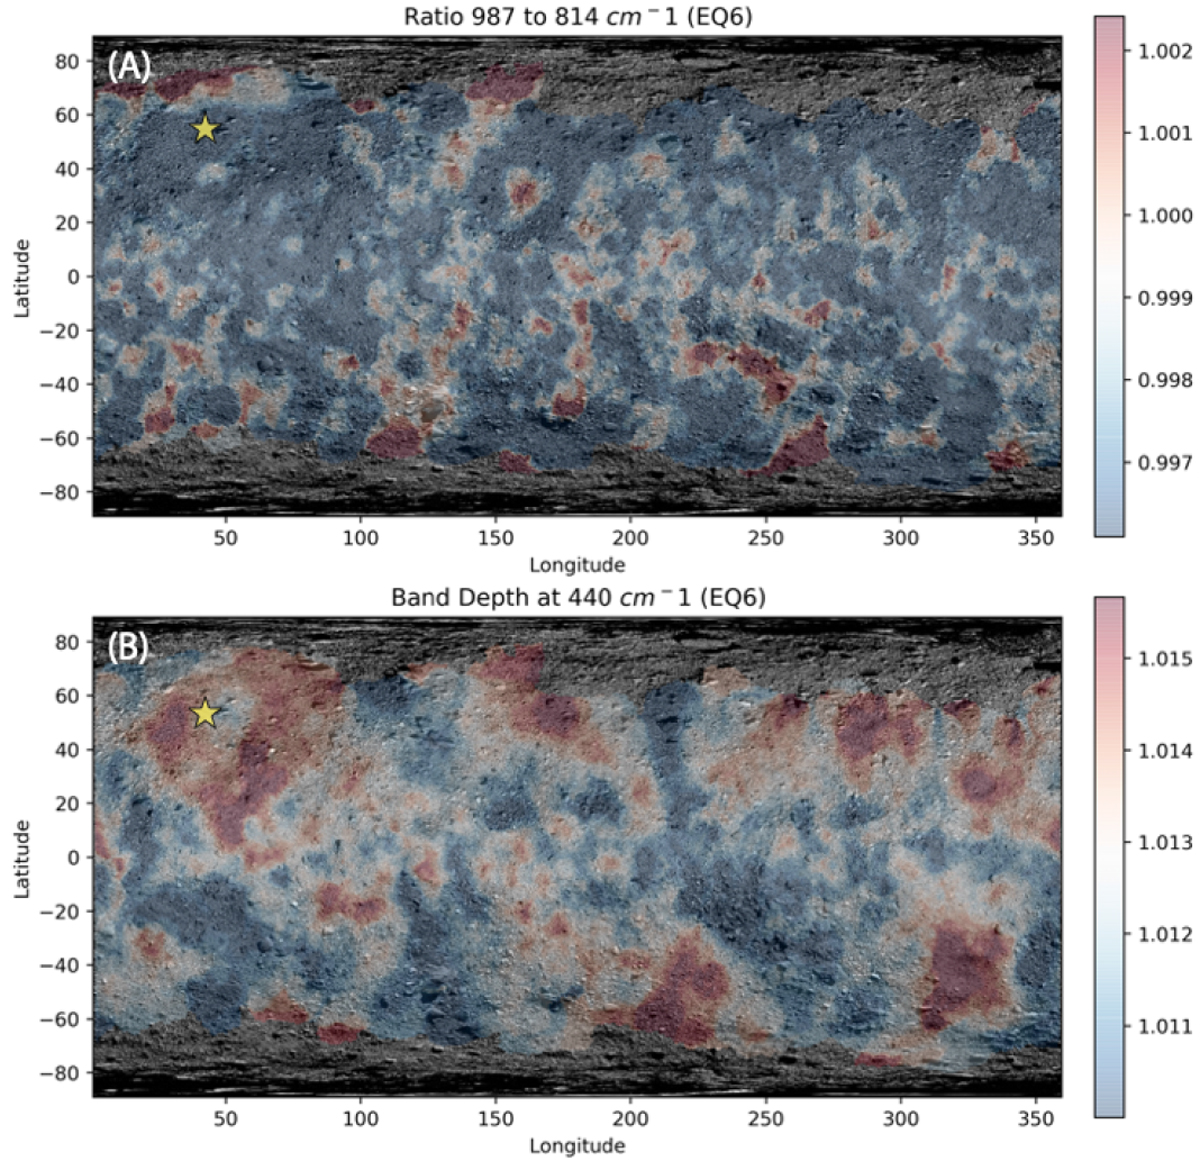
Spectral indices R987/814 (A) and BD440 for EQ6 (B; 8:40 pm), with color maps scaled to the ranges in Fig. 2. There is much less diversity in R987/814 than in the EQ3 data (Figs. 2 and 3). High inertia (coarser) materials emit most strongly at night and little geographic correlation is visible, suggesting that variation in this parameter in the daytime data is due primarily to differences in the relative abundance of fine particulates. BD440 shows geographic trends comparable to those in EQ3 (Figs. 2 and 3), revealing that this band depth is partially decoupled from the characteristics that lead to variation in R987/814. See Fig. A.7 for error maps.
Current usage metrics show cumulative count of Article Views (full-text article views including HTML views, PDF and ePub downloads, according to the available data) and Abstracts Views on Vision4Press platform.
Data correspond to usage on the plateform after 2015. The current usage metrics is available 48-96 hours after online publication and is updated daily on week days.
Initial download of the metrics may take a while.