Fig. 2
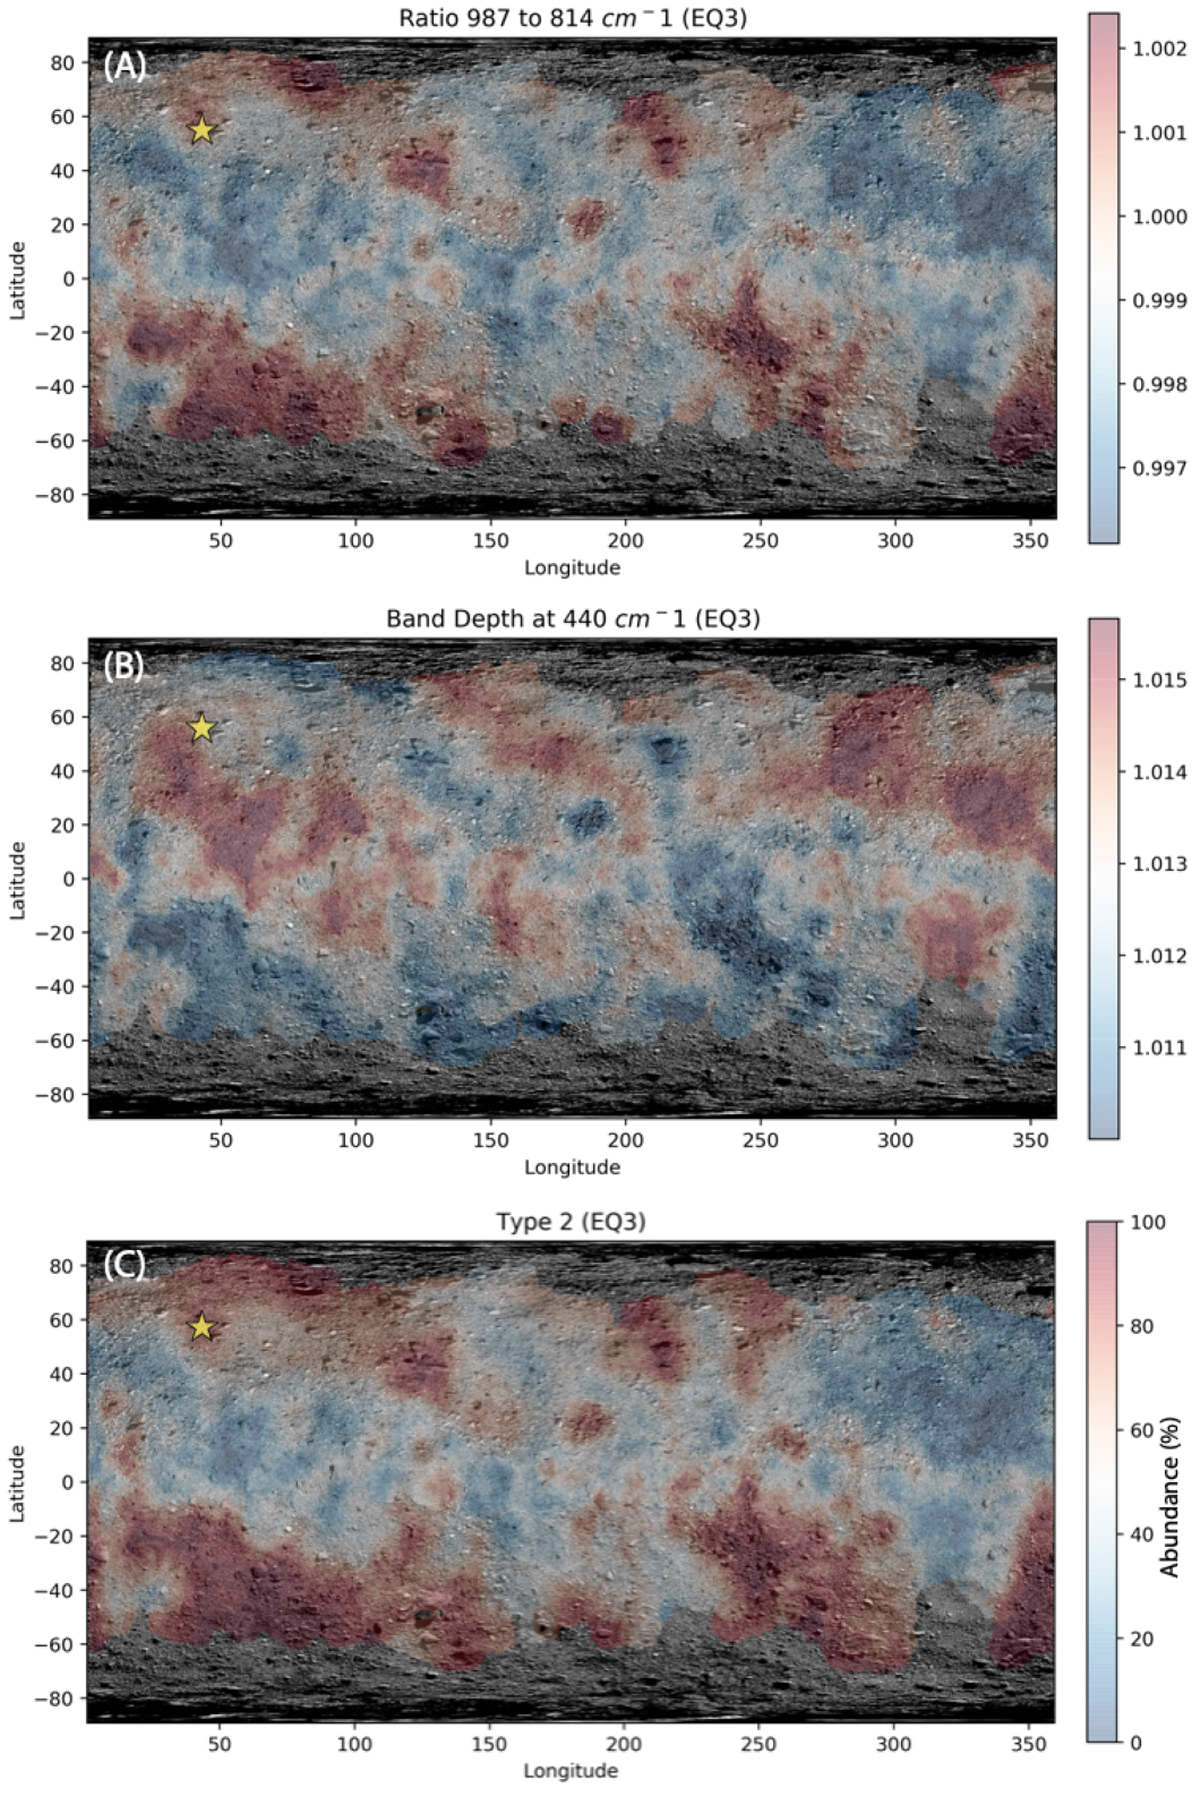
Distribution maps of the OTES spectral types. (A) Ratio of 987/814 cm−1; blue is OTES T1 and red is OTES T2. (B) Band depth at 440 cm−1, modestly inversely correlated with R987/814 (see text for details). (C) Linear least squares modeled abundance distribution of T2 (where 0% = T1). The minimum and maximum scale bar values of (A) and (B) are ±2 standard deviations from the mean. All maps in this and subsequent figures are overlaid on the base map of Bennett et al. (2020); the yellow star denotes the Nightingale site.
Current usage metrics show cumulative count of Article Views (full-text article views including HTML views, PDF and ePub downloads, according to the available data) and Abstracts Views on Vision4Press platform.
Data correspond to usage on the plateform after 2015. The current usage metrics is available 48-96 hours after online publication and is updated daily on week days.
Initial download of the metrics may take a while.