Fig. 5
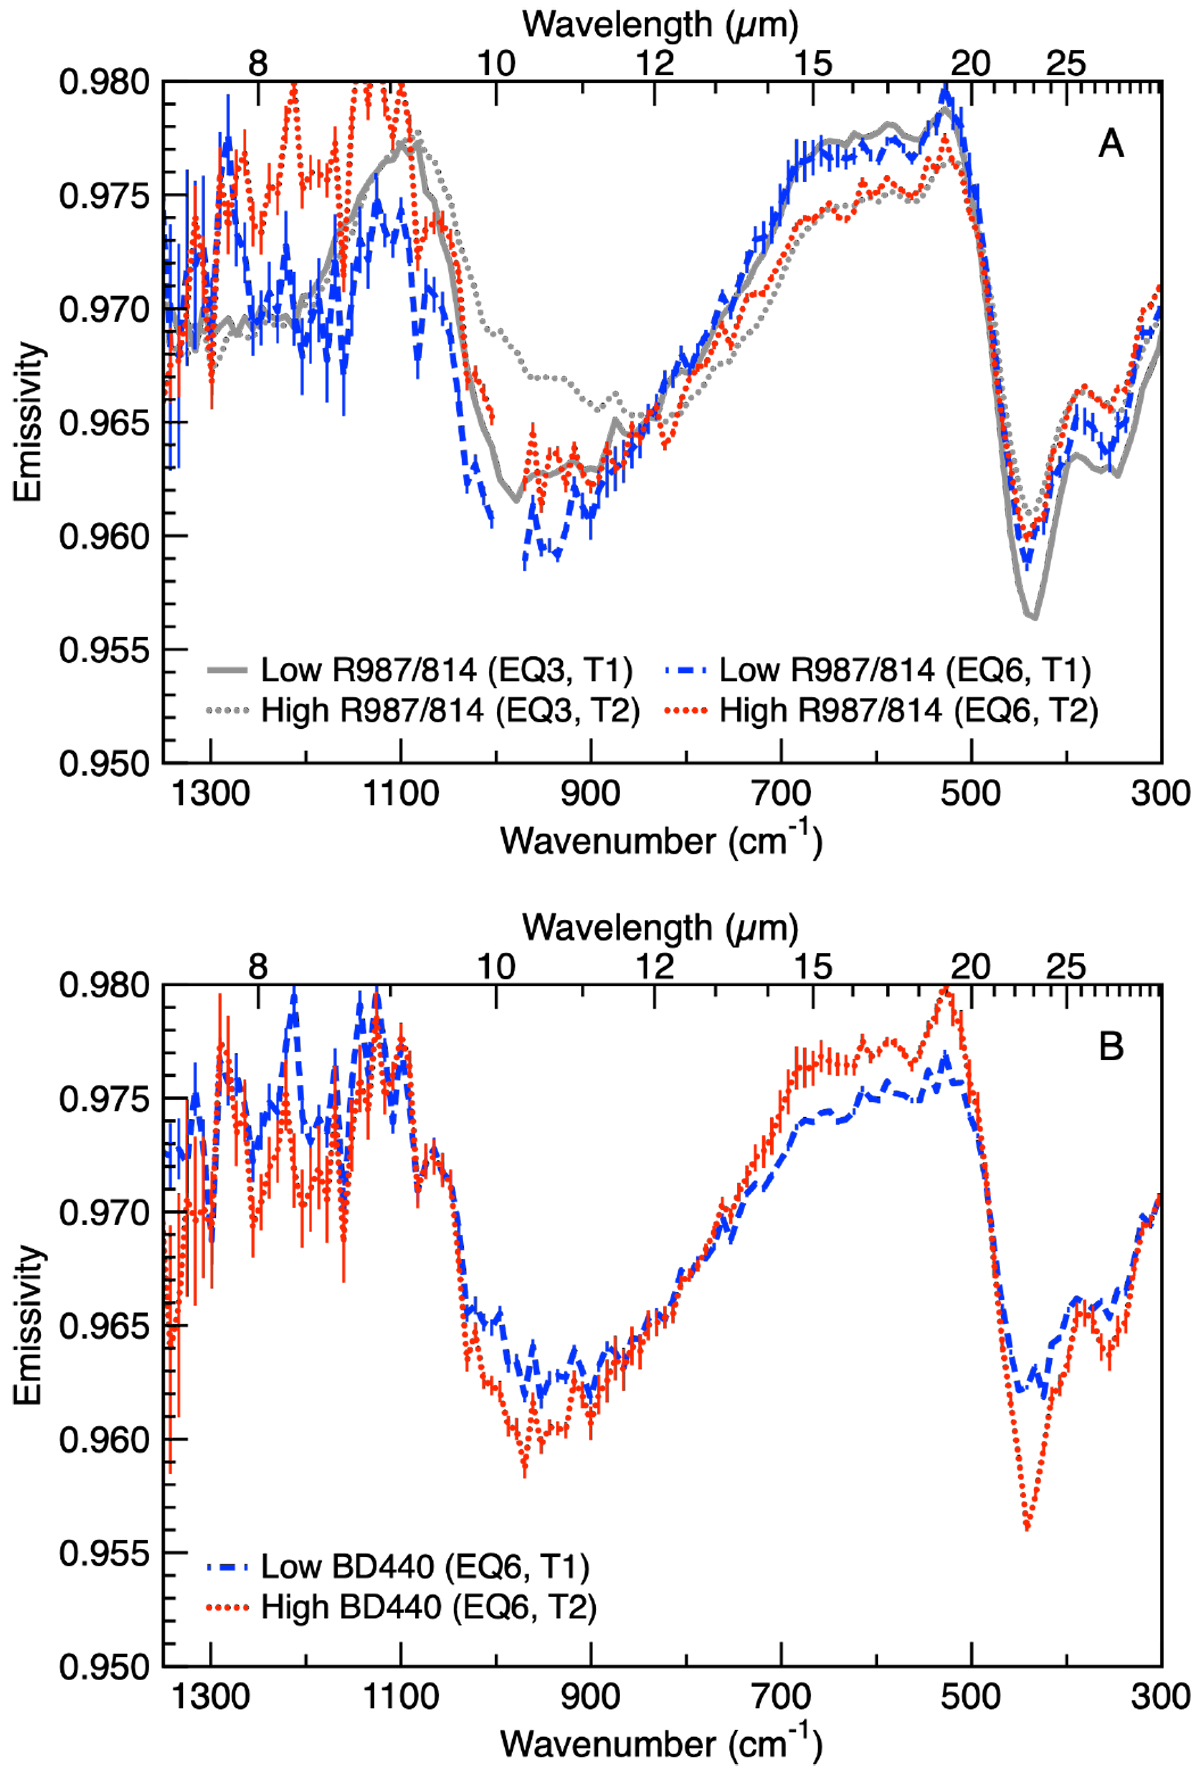
Comparison of daytime and nighttime OTES spectra. (A) OTES nighttime spectra (EQ6, 8:40 pm) that have the lowest and highest R987/814 values (T1 and T2, respectively) in comparison with EQ3 (daytime) data from Fig. 1. Temperatures at this local time range from 229–287 K; because the signal-to-noise ratio (S/N) is a function of temperature, averages of 300 nighttime spectra are shown to increase the S/N. Standard errors are shown asvertical lines at each point in the spectrum; errors at wavenumbers lower than about 1100 cm−1 are close to the line width in many cases. An area of systematic noise in these very low temperature data is excluded. (B) Average (N = 300) nighttime spectra that have the lowest and highest BD440 values. There is little variability in silicate stretching features in nighttime data, suggesting that variations in daytime data are largely attributable to particle size effects. BD440 shows that spectral contrast variations persist across the spectrum at night; these likely represent rocks (deeper) and coarse particulates (shallower).
Current usage metrics show cumulative count of Article Views (full-text article views including HTML views, PDF and ePub downloads, according to the available data) and Abstracts Views on Vision4Press platform.
Data correspond to usage on the plateform after 2015. The current usage metrics is available 48-96 hours after online publication and is updated daily on week days.
Initial download of the metrics may take a while.