Fig. 3
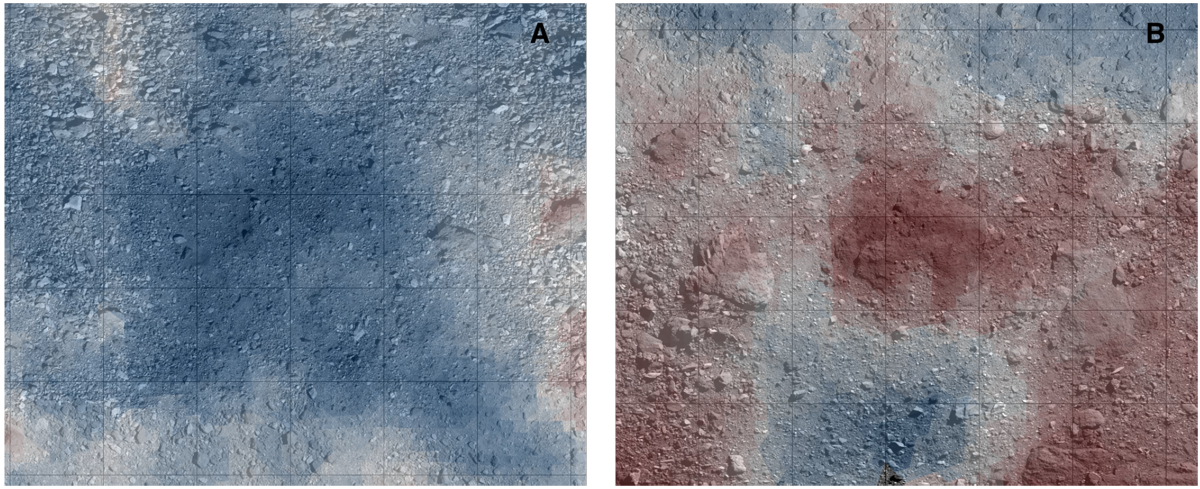
Examples of T1- and T2-bearing terrains; images are colorized following the spectra in Fig. 1A, with blue representing T1 and red representing T2. Individual OTES spots are overlaid on the base map of Bennett et al. (2020) using the open source J-Asteroid GIS software package (documented as JMARS by Christensen et al. 2009). (A) Relatively boulder-free region near Aellopus Saxum (image centered near 25.5°N, 336°E) with some of the strongest T1 signatures. (B) Large boulder at Roc Saxum (image centered near −23°N, 23°E) with some of the strongest T2 signatures. Grids are 10° of latitude and longitude, or roughly 43 m; OTES spots are approximately 38 m in diameter at these latitudes.
Current usage metrics show cumulative count of Article Views (full-text article views including HTML views, PDF and ePub downloads, according to the available data) and Abstracts Views on Vision4Press platform.
Data correspond to usage on the plateform after 2015. The current usage metrics is available 48-96 hours after online publication and is updated daily on week days.
Initial download of the metrics may take a while.