| Issue |
A&A
Volume 650, June 2021
|
|
|---|---|---|
| Article Number | A117 | |
| Number of page(s) | 13 | |
| Section | Extragalactic astronomy | |
| DOI | https://doi.org/10.1051/0004-6361/202039689 | |
| Published online | 18 June 2021 | |
The host galaxy of the short GRB 050709⋆
1
Thüringer Landessternwarte Tautenburg, Sternwarte 5, 07778 Tautenburg, Germany
e-mail: This email address is being protected from spambots. You need JavaScript enabled to view it.
2
Department of Physics, University of Bath, Claverton Down, Bath BA2 7AY, UK
3
Max-Planck-Institut für Extraterrestrische Physik, Giessenbachstraße 1, 85748 Garching, Germany
4
Department of Physics and Astronomy, Clemson University, Clemson, SC 29634, USA
5
INAF-Osservatorio Astrofisico di Arcetri, Largo E. Fermi 5, 50125 Firenze, Italy
6
Argelander Institut für Astronomie, Universität Bonn, Auf dem Hügel 71, Bonn 53121, Germany
7
INAF-OAS Bologna, Via Gobetti 101, 40129 Bologna, Italy
8
Departamento de Ciencias Físicas, Universidad Andrés Bello, Fernández Concha 700, Las Condes, Santiago, Chile
9
Astronomical Observatory Institute, Faculty of Physics, Adam Mickiewicz University, ul. Słoneczna 36, 60-286 Poznań, Poland
10
CSIRO Astronomy and Space Science, PO Box 76, Epping, NSW 1710, Australia
Received:
15
October
2020
Accepted:
14
March
2021
Abstract
The host of the short gamma-ray burst (GRB) 050709 is a morphologically disturbed low-luminous galaxy. At a redshift of z = 0.16, it belongs to one of the cosmologically nearest short-GRB hosts identified to date. Consequently, it represents a promising target for sensitive, spatially resolved observational studies. We have used the Multi Unit Spectroscopic Explorer (MUSE) mounted at the Very Large Telescope to characterize the GRB host galaxy. In addition, we performed deep radio-continuum observations of the host with the Australia Telescope Compact Array (ATCA) and with ALMA at 1.3 mm. Moreover, we made use of archival Spitzer Space Telescope 24 μm and Hubble Space Telescope/F814W imaging data of this galaxy. The spatially resolved MUSE data reveal that the entire host is a source of strong line emission, in particular from Hα and [O III] λ 5007, superimposed on a rather weak stellar continuum. Using the Balmer decrement, we map the internal host-galaxy reddening and derive an extinction-corrected star formation rate based on the flux in the Hα line of 0.15 ± 0.02 M⊙ yr−1. The galaxy is detected neither by ALMA nor by Spitzer, excluding a substantial amount of optically obscured star formation activity. Using the O3N2 metallicity indicator, we measure an average 12 + log (O/H) = 8.40 ± 0.05 (corresponding to ∼0.5 solar). Diagnostic emission line diagrams show that a substantial fraction of all MUSE spaxels that cover the GRB 050709 host galaxy lie close to the star-formation demarcation line. Some spaxels even suggest line emission by shocked gas. The ATCA observations reveal faint diffuse radio emission at the eastern part of the host in excess to that expected from pure star formation, possibly further evidence for nonthermal processes. The kinematics of the Hα-emitting gas suggests a rotationally supported host-galaxy system, apparently in contrast to its irregular photometric morphology. A comparison with the field-galaxy population reveals, however, that the kinematics of the gas in the 050709 host fits into the ensemble of merging galaxies well. Finally, we use the ATCA radio data to set deep constraints on any late-time flux from the GRB afterglow or a potentially associated kilonova radio flare ∼10 years after the burst.
Key words: gamma-ray burst: individual: GRB 050709
Based on observations collected at the Very Large Telescope of the European Southern Observatory, Paranal, Chile (ESO program 099.D-0115A, principal investigator: T. Krühler), ALMA (program 2016.1.01333.S, principal investigator: S. Klose), ATCA (program C2840, principal investigator: A. Nicuesa Guelbenzu), and Spitzer (program ID: 30834, principal investigator: S. Savaglio). Other data products were obtained from the Hubble Legacy Archive (program 10624, principal investigator: D. Fox).
© ESO 2021
1. Introduction
Studies of the physical properties of galaxies that host transient phenomena are a powerful observational tool for learning more about the nature of the underlying source population. This approach goes back to early work from Reaves (1953), van den Bergh (1959), and others, when the observed spectral diversity in ”super novae” (Minkowski 1941) garnered attention. What today belongs to the main roots of our understanding of supernova explosions also holds true for the progenitors of long and short gamma-ray bursts (GRBs).
Since pioneering work performed in the late 1990s on long GRBs (e.g., Metzger et al. 1997; Bloom et al. 1998; Kulkarni et al. 1998), studies of GRB host galaxies have become an increasingly important tool for understanding the formation and evolution of GRB progenitors (see also Natarajan et al. 1997; Djorgovski et al. 1998; Odewahn et al. 1998). Concerning short GRBs, such work started with studies of the host of the first well-localized short GRB (050509B; Gehrels et al. 2005) and has culminated (for now) in detailed investigations of the host of GRB 170817A as it relates to the gravitational wave (GW) event GW170817 (e.g., Blanchard et al. 2017; Ebrová et al. 2020; Lee et al. 2018; Levan et al. 2017).
The Neil Gehrels Swift Observatory (Gehrels et al. 2004) detects and localizes, at the arcsecond scale, about 50–100 GRBs per year, ∼5% of which are short (t90 < 2 s). Since short-burst afterglows (AGs) are on average much fainter than their long-burst cousins (e.g., Kann et al. 2010, 2011; Nicuesa Guelbenzu et al. 2012), their discovery and detailed follow-up is challenging. Consequently, the number of well-identified short-GRB host galaxies is still rather small (for a review see Berger 2014; D’Avanzo 2015). In particular, short GRBs at low redshifts (z < 0.2) are still rare; at present, only ∼10 such cases are known. However, the spatially resolved properties of these low-z host galaxies – such as the star formation rate (SFR) or the internal dynamics of the interstellar gas – represent promising targets for study. In order to better understand the observed diversity in short bursts and their follow-up phenomena, a study of their hosts and galactic environments is the way to go.
Here we present the results of a comprehensive multiwavelength observing campaign of the host galaxy of the short GRB 050709 using the Australia Telescope Compact Array (ATCA), ALMA, and the Multi Unit Spectroscopic Explorer (MUSE; Bacon et al. 2010) mounted at the Very Large Telescope (VLT) together with archival data from the Hubble Space Telescope (HST) and Spitzer. At a redshift of z = 0.1606 ± 0.0001 (Fox et al. 2005; Covino et al. 2006; Prochaska et al. 2006), this galaxy is still one of the nearest short-GRB hosts detected to date (Berger 2014)1, qualifying it as one of the today’s best targets for a study of its physical properties.
Throughout this paper, we adopt a flat cosmological model with H0 = 68 km s−1 Mpc−1, ΩM = 0.31, and ΩΛ = 0.69 (Planck Collaboration XIII 2016). For these parameters, a redshift of z = 0.1606 corresponds to a luminosity distance of dL = 2.44 × 1027 cm (∼790 Mpc) and 1 arcsec corresponds to a 2.85 kpc projected distance.
2. The burst and its host galaxy
2.1. The burst
The detection and subsequent localization of the short GRB 050709 was one of the scientific highlights of the High Energy Transient Explorer (HETE-II; Ricker 1997) mission. The burst triggered HETE-II at 22:36:37 UT on 9 July 2005. It consisted of a single spike with a duration of 70 ± 10 ms in the 30–400 keV band and 220 ± 50 ms in the 2–25 keV band (Villasenor et al. 2005), defining it as a bona fide short burst. Its peak energy was 83 keV (Boer et al. 2005; Villasenor et al. 2005). About ∼30 s after this spike, the burst was followed by a soft (≲10 keV) extended emission that lasted about 150 s. It was this soft, second component that allowed HETE-II to localize a possible X-ray AG with its Soft X-ray Camera at coordinates RA, Dec (J2000) = 23:01:30, −38:58:33, with a positional uncertainty of 1.34 arcmin (Butler et al. 2005).
The conclusion that GRB 050709 was a member of the short-GRB class is supported by several other arguments: (i) The spectral lag of the burst was  ms, consistent with zero, which is typical for short bursts (Norris & Bonnell 2006; see also their Sect. 2.2). (ii) GRB 050709 does not follow the Amati Eiso − Epeak relation (Amati et al. 2008), which also is characteristic of short bursts. (iii) The luminosity of the optical AG lies in the parameter region occupied by short-burst AGs (Ferrero et al. 2007; Kann et al. 2011). Also, its low X-ray luminosity (LX = 3 × 1042 erg s−1) at t = 10 h post burst (Fox et al. 2005) is rather typical for short bursts (cf. Fig. 17 in Nicuesa Guelbenzu et al. 2012). (iv) GRB 050709 is not an outlier in any empirical relation between various burst and optical or X-ray AG parameters found for the short-burst population (Nysewander et al. 2009; Kann et al. 2011; D’Avanzo et al. 2014). (v) Finally, despite the relatively small redshift, no supernova component following the burst was detected to very deep flux limits up to 18 days after the burst (Fox et al. 2005; Hjorth et al. 2005; Kann et al. 2011; absolute peak magnitude MR > −12.1, Kann et al. 2011).
2.2. The host
2.2.1. Ground-based observations
Follow-up observations with the Chandra X-ray Observatory ∼2.5 days after the burst led to a refined localization of its X-ray AG at RA, Dec (J2000) = 23:01:26.96, −38:58:39.5 (±0 5; Fox et al. 2005). Optical follow-up observations performed with the Danish 1.5 m telescope at ESO/La Silla, which started 33 h after the GRB, finally identified a faint (R ∼ 23), fading source at RA, Dec (J2000) = 23:01:26.957, −38:58:39.76 (±0
 25; Hjorth et al. 2005), coincident with the Chandra AG position. The optical transient was located in the outskirts of an irregularly shaped host, about 1
 4 away from its optically brightest, central region (projected distance ∼4.0 kpc; Fox et al. 2005; Hjorth et al. 2005).
According to Hjorth et al. (2005), the host of GRB 050709 is a blue dwarf galaxy with an absolute magnitude MB = −16.9 ± 0.1. Its SFR, deduced from its broadband spectral energy distribution (SED), is about 0.1 M⊙ yr−1 (Leibler & Berger 2010). According to these authors, the SED reveals a dominating stellar population with an age of about 2 Gyr and a stellar mass of log M⋆/M⊙ = 8.8. This relatively low stellar mass places the host of GRB 050709 at the low end of the mass distribution of short-GRB host galaxies (see Table 2 in Leibler & Berger 2010). The galaxy is not detected in any band2 of the Wide-Field Infrared Survey Explorer (WISE; Wright et al. 2010) satellite (Chrimes et al. 2018).
Long-slit spectroscopy of the host was performed with the Gemini Multi-Object Spectrographs (GMOS) on Gemini North (Fox et al. 2005), the FOcal Reducer Spectrograph (FORS2) at the VLT (Covino et al. 2006), and the Echellette Spectrometer and Imager on Keck II (Prochaska et al. 2006). These spectral data revealed that the host is a source of strong emission lines. Based on the observed line ratios, Fox et al. (2005) and Covino et al. (2006) derived a global SFR of about 0.2 and 0.3 M⊙ yr−1, respectively. Prochaska et al. (2006) concluded that the internal reddening is E(B − V)> 0.4 mag and inferred a global SFR of > 0.3 M⊙ yr−1. The combination of the SFR and the stellar mass places this dwarf galaxy on the main sequence of star-forming galaxies (e.g., Elbaz et al. 2007).
2.2.2. The host seen by the HST
The HST, equipped with the Advanced Camera for Surveys (ACS WFC1/F814W), observed the host on several occasions in July and August 2005 when the AG was still visible (program ID 10624, principal investigator: D. Fox). Further data were obtained one year later using the same instrumental setup. A combined HST/F814W image (32 ks total exposure time) is provided by the Hubble Legacy Archive3. The fact that the ACS WFC1/F814W filter passband includes the redshifted Hα emission line is important for this study.
A visual inspection of the HST/F814W image reveals that the host has an irregular morphology. Varying the contrast parameters in this image shows that the optically brightest region (labeled B) has two emission peaks (Fig. 1), possibly indicative of a tight pair of galaxies in an advanced merger stage. In addition, several small bright blobs (radius  , corresponding to ≲0.3−0.6 kpc) are spread across the host, in particular in its eastern part (inside regions C-D and F-G). Furthermore, the host is surrounded by faint, extended (
 ) objects (regions E and K-M).
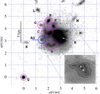 |
Fig. 1. Archived HST/ACS F814W image of the host of GRB 050709 and its AG taken in July and August 2005 (HST program ID 10624, principal investigator: D. Fox). Labels indicate the AG (blue), the optically brightest part of the host (B), and potentially star-forming regions or young luminous stellar clusters placed along tidal arms (C and D). The apparently faint western region of the host (H) is filled with ionized gas (Sect. 4). “Q” is an anonymous point-like emission-line object, which we have used as a reference for the astrometry between HST and VLT/MUSE (see Sect. 3.4). Coordinate values are given in units of arcseconds relative to object Q. The inset shows an optical contour plot that reveals two peaks inside region B that are 0 |

In the eastern part of the host there are signs of at least two faint curved structures, which could be interpreted as tidal arms. One arm is located in the NE region of the galaxy. It contains a bright blob (C), then curves to the north and seems to end in an optically less bright blob (G). A second arm is located in the SE region of the galaxy. It is fainter than the northern arm, contains three well-isolated blobs (D), and seems to end close to the GRB explosion site (AG). These small blobs are possibly young star-forming regions or bright stellar clusters.
Observations with HST/F814W in July 2006 (program ID 10624, principal investigator: D. Fox) did not reveal any other galaxy underlying the position of the optical transient. This supports the view of a physical association of the burst with the galaxy at z = 0.16.
3. Additional observations and data reduction
3.1. Spitzer Space Telescope mid-infrared observations
The Spitzer Space Telescope (Werner et al. 2004) Multiband Imaging Photometer (MIPS; Rieke et al. 2004) observed the field of GRB 050709 on 6 December 2006 (program ID: 30834, principal investigator: S. Savaglio). The observations lasted for 13 min. The M1/MIPS images (M1 band = MIPS 24 micron), downloaded from the Spitzer archive4, were reduced with MOPEX (Makovoz & Marleau 2005).
At a wavelength of 24 μm, the host (including the GRB explosio n site) remained undetected. To derive the flux upper limit we followed the procedure detailed in Dale et al. (2012, their page 7). In particular, we measured the sky and its standard deviation from ten empty sky regions around the host position, and we used as Npix and Nsky(=Npix) the area subtended by a radius slightly larger than the M1/MIPS point spread function (PSF). In doing so, we find  Jy (3σ).
Following Tzanavaris et al. (2010), the corresponding SFR is
 (1)
(1)
where  is measured in units of erg s−1. Adopting a spectral slope in the 24 μm band of the form Lν(ν)∼ν−β, we have
 (2)
(2)
Assuming that the SED of the host is similar to the SED of the host of the long-duration GRB 980425, then in the 24 μm window the spectral slope, β, can have values between 3 and 4 (cf. Fig. 3 in Michałowski et al. 2009). The observed upper limit then implies an SFR24 μm < 0.68 (1 + z)β − 1 M⊙ yr−1; that is, the SFR in the entire galaxy is less than 1 M⊙ yr−1 (for β between 3 and 4).
Following Murphy et al. (2011, their Eq. (5)), the constraint on the SFR is slightly higher: For β = 3 we have SFR24 μm < 1.4 M⊙ yr−1, and for β = 4 it is SFR24 μm < 1.5 M⊙ yr−1.
3.2. ATCA radio-continuum observations
Radio-continuum observations of the host of GRB 050709 were performed with ATCA eight years after the burst on 24 July 2013 in the 5.5 and 9.0 GHz bands (corresponding to wavelengths of 6 and 3 cm, respectively). Observations were executed using the upgraded Compact Array Broadband Backend (CABB) detector (Wilson et al. 2011) and all six 22 m antennas with the 6 km baseline (configuration 6A; program ID: C2840, principal investigator: A. Nicuesa Guelbenzu). CABB integrated in both bands simultaneously with 2048 channels, beginning at 4.476 and 7.976 GHz, respectively, with an increment of 1 MHz. Bandpass and flux calibration was performed using the Seyfert 2 galaxy PKS B1934–638. Phase calibration was done by observing the radio source 2244–372 for 3 min every hour (Fν(5.5 GHz) = 0.79 Jy, Fν(9.0 GHz) = 0.74 Jy; angular distance 3.48 deg), followed by 57 min of integration on target. Altogether, ten such 1 h cycles were executed, providing a good coverage of the (u, v) plane.
Data reduction was performed in a standard manner using the Multichannel Image Reconstruction, Image Analysis and Display (MIRIAD) software package for ATCA radio interferometry (for details, see Sault et al. 1995)5 The Briggs “robust” parameter (Briggs 1995) was varied between 0.0 and 2.0 (natural weighting for maximum sensitivity). We finally selected the results that gave the best compromise between sensitivity and resolution, providing a 1σ rms of 5.3 μJy beam−1 at 5.5 GHz and 5.0 μJy beam−1 at 9.0 GHz. The widths of the synthesized beam were  and
and  , respectively. At the given redshift this corresponds to regions with sizes of 8.8 × 4.5 and 5.6 × 2.8 kpc2, respectively.
We double-checked the astrometry of the resulting radio images by comparing the position of two known radio sources in the field with their published coordinates. These are the quasars B2258–391 (measured flux Fν(5.5 GHz) = 103 ± 10 μJy) and NVSS J230132–385927 (measured flux Fν(5.5 GHz) = 1160 ± 77 μJy). The ATCA positions of both sources were found to agree with their cataloged values to better than 0.3″ in right ascension and 0.1″ in declination. We considered this to be the accuracy of the relative astrometry between ATCA and the HST.
At standard resolution (robust parameter = 0), there is no evidence for a source at the GRB position at either frequency (Fν(5.5 GHz)< 15 μJy, Fν(9.0 GHz)< 15 μJy; 3σ). The nearest radio source is a faint 44 μJy source at RA, Dec (J2000) = 23:01:27.13, −38:58:26.6, with an image noise level of 7 μJy at 5.5 GHz. It can be seen, but it is below 4σ in the 9 GHz image (it looks resolved into a double source in the HST image; Fig. 2). We identified this source with the luminous infrared galaxy (LIRG) GALEXASC J230127.17–385825.6. Its redshift (z = 0.481) was determined based on our MUSE data (Sect. 3.4).
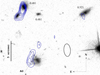 |
Fig. 2. ATCA radio-continuum 5.5 GHz contours of the field of GRB 050709, overlaid on the HST image. It shows faint extended emission in the eastern part of the galaxy. Contour levels (in blue) start at three times the image 1σrms of 5.3 μJy beam−1 and continue in steps of 0.5σrms. In addition, we indicate the optical AG and the redshifts for some objects as they follow from the VLT/MUSE data (see Sect. 3.4). The galaxy ∼13 arcsec northeast of the GRB host is a morphologically disturbed LIRG at z = 0.481 (GALEXASC J230127.17–385825.6). The beam is shown in black. |
In a natural weighted 5.5 GHz image, the GALEXASC source shows a flux of 40 μJy and there is a hint of extended emission near the GRB AG position (at a level of 15–20 μJy) with a 5 μJy noise level. Adding some tapering (full width half maximum = 5 arcsec) increases the noise level to 8 μJy and the extended emission level to 40 μJy; the GALEXASC source is still 40 μJy, so it is not very extended. At 9 GHz there is no sign of emission near the GRB position and the GALEXASC source is below the 4σ noise level.
We conclude that there may be some extended emission at the GRB explosion site at the 5σ level. This is too faint to perform a more detailed analysis (e.g., splitting in time or frequency). It does not look like a spurious source, but at the S/N level at which we detect it there is no guarantee that it is real. If it is real, the radio source is not point-like and therefore cannot be the GRB radio AG. Analogously, it cannot be the potential late-time radio flare from non-relativistic ejecta of the double neutron star (DNS) merger (e.g., Margalit & Piran 2015). Given the redshift, these expanding radio sources would have an angular extension still far below 1 mas ∼10 years after the burst and would not be resolved by ATCA.
A first interpretation of these results could be that the origin of the radio emission is star-forming activity averaged over ∼100 Myr (e.g., Michałowski et al. 2016, 2020; Greis et al. 2017). Using Eq. (1) in Greiner et al. (2016), the observed 5.5 GHz flux would then correspond to an unobscured SFR in the eastern part of the host of ∼2−3 M⊙ yr−1. However, our VLT/MUSE observations do not support this picture (Sect. 3.4).
3.3. ALMA millimeter observations
In order to clarify if the faint ATCA radio source is related to star-forming activity in the eastern part of the galaxy, we applied for ALMA observations in bands 6 (1.1–1.4 mm, 211–275 GHz) and 9 (0.4–0.5 mm, 602–720 GHz). Assuming an SED of the GRB 050709 host galaxy similar to the star-forming host of the long GRB 980425 (Michałowski et al. 2009, 2014) or other long-GRB host galaxies (Hunt et al. 2014), observations in band 9 would have been the most sensitive to radiation from heated dust, while observations at the lower frequencies would have provided the spectral slope. Unfortunately, due to weather constraints observations in band 9 could not be performed despite being scheduled.
Observations in band 6, which are less affected by atmospheric transmission issues, were executed over two runs (program ID: 2016.1.01333.S; principal investigator: S. Klose). The first data were obtained on 7 October 2016 using a long-baseline configuration (run 1: C40-6; 41 antennas; baselines up to 3144 m). Additional observations Additional observations were performed on 7 December 2016 using a short-baseline configuration (run 2: C40-3; 41 antennas, baselines between 15 and 650 m). All observations were performed in four spectral windows of 2.0 GHz bandwidth centered at 224, 226, 240, and 242 GHz; when combined, this led to a mean observed frequency of 233 GHz = 1.3 mm. During run 1 the time on target was 2933 s, and during run 2 it was 911 s. During run 1 the atmospheric conditions (water vapor in the atmosphere) were very good, during run 2 only slightly worse. Details about the calibrators are listed in Table 1.
Calibrators used during the two ALMA observing runs.
Data reduction and combination was performed using standard ALMA routines developed under Common Astronomy Software Applications package version 4.7.0 and provided by the ALMA Regional Center. Using the CASA tclean task and combining both runs (Briggs robust parameter = 2.0) resulted in a synthesized beam size of  (0.6 × 0.5 kpc2) and a 5σrms upper limit of 55 μJy beam−1 at the image phase center (the GRB AG position).
No millimeter source was detected, neither at the position of the GRB AG nor anywhere superimposed on the host galaxy. Using the standard infrared SED library of Chary & Elbaz (2001), we translated the 1.3 mm flux upper limit into an SFR upper limit. In doing so, we redshifted and renormalized each of the SED templates to match an observed 1.3 mm flux density of 55 μJy at z = 0.1606. The infrared luminosities (i.e., LIR) of these renormalized templates were then converted into SFRs using the standard SFR(M⊙ yr−1) = 10−10 (LIR/L⊙) relation from Kennicutt (1998). From this analysis, we inferred SFR < 4.5 M⊙ yr−1, in agreement with the Spitzer data (Sect. 3.1). This can, however, be considered as a very conservative upper limit as the median SFR of these renormalized templates is ∼1.6 M⊙ yr−1.
3.4. VLT/MUSE spectroscopy
VLT/MUSE observed the host of GRB 050709 on 21 June 2017 (program ID: 099.D-0115(A), principal investigator: T. Krühler). Four dithered exposures of ∼700 s were obtained. Observations were executed using the wide-field mode, in which MUSE offers a field of view of 1 arcmin2. In this mode the spaxel resolution is 0 2. The MUSE data cover the wavelength range from 480 to 930 nm with a resolving power of 1800–3600 (increasing from the blue to red wavelengths). During the observations the seeing was between 1.0 and 1.1 arcsec.
The data were reduced in a standard fashion following Krühler et al. (2017), using version 1.2.1 of the MUSE data reduction pipeline provided by ESO (Weilbacher et al. 2012, 2014). The data were corrected for Galactic foreground reddening (E(B − V)=0.01 mag; Schlafly & Finkbeiner 2011), assuming an average Milky Way extinction law (Pei 1992) and RV = 3.08. For the flux calibration, the spectrophotometric standard star LTT3218 was observed at the beginning of each night. Telluric absorption lines in the spectrum were taken into account by using the molecfit software package (Smette et al. 2015). The full width half maximum (FWHM) of the stellar PSF was between 0 9 (at 9000 Å) and 1
 1 (at 5000 Å).
The MUSE cube was aligned with respect to the HST/F814W image using SAOimage DS9 (Joye & Mandel 2003). For this purpose we made use of an anonymous emission-line object that we discovered in the MUSE data cube at a small angular distance from the GRB host galaxy (labeled Q in Fig. 1). In the HST/F814W image this object appears point-like at coordinates RA, Dec (J2000) = 23:01:27.098, −38:58:42.77 (±0 20). It lies only 3
 4 SE of the optical AG (Fig. 1) and shows a strong emission line at 637.5 nm (no other emission or absorption lines could be identified). We estimate that our final achieved relative astrometric accuracy between HST and MUSE is better than
  (±1 spaxel) in each direction.
Following Krühler et al. (2017), we separated the stellar and gas-phase components of the galaxy in order to get accurate line flux measurements. To summarize, we used the Starlight software package (Cid Fernandes et al. 2005, 2009) to model the stellar continuum using a combination of single stellar population models (Bruzual & Charlot 2003) and then subtracted the fitted stellar continuum model to obtain the gas-phase-only data cube. Figure 3 does show some indication of absorption close to the Balmer lines; the Starlight fits then remove these absorption features, such that the gas-phase-only cube no longer contains any absorption lines. In the following, we use this gas-phase cube, except when we calculate the equivalent widths.
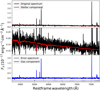 |
Fig. 3. Example spectrum extracted from a spaxel in the central region of the host galaxy of GRB 050709, illustrating the separation of the stellar and gas-phase components. Top: original spectrum containing stellar and ionized gas emission (black) and the model stellar fit (red). Middle: zoom-in of the continuum shown in the top panel. Bottom: spectrum of the gas-phase-only component (blue) together with the error spectrum (black). |
4. Results
Given the non-detection of the host with ALMA and Spitzer, we focus here on the results obtained from our VLT/MUSE observing run.
The MUSE data revealed that the entire host is a source of emission lines at a common redshift of z = 0.1607 ± 0.0001. We identify lines from Hα, Hβ, and Hγ and forbidden lines from [O III] λλ4960, 5007, [N II] λ 6584, and [S II] λλ6718, 6731 superimposed on a rather faint stellar continuum (Fig. 3). These lines are stronger in the central part of the galaxy (B), while they are comparably weak at the GRB explosion site. In particular, the MUSE data show that there is a substantial amount of gas in between the tidal tails, which shines bright in the hydrogen and oxygen emission lines.
For the following analysis, only spaxels for which the signal-to-noise ratio (S/N) of the appropriate emission lines lies above a certain value were selected. We required S/N ≥ 4 for the bright lines (Hα, [O III] λ 5007) and S/N ≥ 2 for the faint lines (Hβ, [N II] λ 6584, [S II] λ 6718). The relatively modest S/N we chose for the faint lines is a compromise between the reliability of the data and the number of spaxels that fulfill this criterion in the particular line under consideration. Unless otherwise stated, the gas cube was used in the analysis.
4.1. The nature of objects C-G and K-M
In principle, the MUSE data cube should allow us to search for spectroscopic signatures of all objects labeled in Fig. 1. However, in doing so we were confronted with a number of difficulties: (i) The angular size of these objects is rather small, typically less than 0 2. This is less than our astrometric accuracy. (ii) Except objects K-M, all objects lie in the area that is characterized by strong line emission from interstellar gas at z = 0.1606. (iii) All objects are rather faint. Consequently, we cannot clarify the nature of these objects using the MUSE spectroscopy. While the HST image seems to provide compelling evidence that these are star-forming regions, young luminous stellar clusters, or background (foreground) galaxies, their individual nature cannot be clarified with certainty using the MUSE data cube.
In particular, in the case of objects K-M, we do not detect any emission lines above a noisy continuum that would allow us to determine their redshifts. Because of their elongated morphology, they could be galaxies. However, we note that such elongated features are also seen in some local merging dwarf galaxies (e.g., Paudel et al. 2015; Fensch et al. 2016), and one possible interpretation is that this could be debris material from a disrupted companion galaxy (e.g., UGC 6741; Paudel et al. 2015).
The HST observed the host again in July 2007 using WFPC2 and the F450W filter (eight times 400 s on target; program ID 11176, principal investigator: A. Fruchter). Compared to the 814W image, the 450W image is less deep. We do not detect objects K or M, and there is only a hint of object L. With a clear detection in only one HST filter band, the nature of these objects cannot be clarified.
4.2. Host-galaxy reddening E(B – V)
We calculated the internal host-galaxy reddening via the Balmer decrement6 by assuming a Milky Way extinction law with a ratio of total-to-selective extinction RV = 3.08 after correcting for Galactic foreground extinction (Sect. 3.4):
 (3)
(3)
where Hα/Hβ is the observed flux ratio in the lines. Corresponding 1σ errors were calculated via error propagation as a function of the S/N of the Hα and Hβ emission line fluxes.
In doing so, mainly spaxels in the optically brightest region (B) appear, with values ranging between 0.05 and 0.6 mag (Fig. 4). The mean in this region is E(B − V)host = 0.28 mag. The mean over the entire galaxy is basically the same (0.27 mag). Unfortunately, there is no data point close to the GRB explosion site. The individual 1σ measurement error per spaxel increases toward the outer parts of the galaxy. The corresponding median for all spaxels is 0.13 mag for region B and 0.20 mag when considering the entire galaxy. Therefore, the reddening values for the outskirts of the galaxy are less secure. Just considering region B, the reddening value we found agrees, within the 1σ error, with previous reddening measurements made via long-slit spectroscopy (Prochaska et al. 2006, see Sect. 2.2).
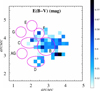 |
Fig. 4. VLT/MUSE view of the host of GRB 050709: E(B − V) in units of magnitudes. Grid coordinates are given in units of arcseconds relative to the emission-line object Q shown in Fig. 1. The circles have the same meaning as in Fig. 1. The “AG” refers to the region that includes the afterglow position. One spaxel ( |

4.3. Star formation rate
We assume here that all Hα line emission is due to ionizing photons related to star formation activity. The SFR was then calculated via the measured flux in the Hα emission line (Kennicutt 1998; Kennicutt & Evans 2012) using the prescription given in Murphy et al. (2011, their Eq. (2)),
 (4)
(4)
where the Hα luminosity L is measured in units of erg s−1. Before applying Eq. (4), the Hα line flux was corrected for host-galaxy extinction (Sect. 4.2). If a spaxel had no reddening value (i.e., E(B − V) is not defined because of a low S/N in the Hα and Hβ emission lines), then the SFR in that particular spaxel was not corrected for host-galaxy reddening (i.e., we set E(B − V)host = 0). This affected spaxels in the outskirts of the galaxy where the S/N is lower.
The SFR pattern is rather smooth across the entire galaxy; however, it shows an asymmetric structure with a single peak of ∼0.04 M⊙ yr−1 kpc−2 in the northwestern quadrant of the optically brightest part (B) of the host (Fig. 5). In the HST/F814W image, this peak is resolved into two components (Fig. 1). Close to the GRB explosion site (which lies 1.6 arcsec southeast of this peak), the SFR falls to less than 10% of this value. For regions C, D, and F, we measure medians of 0.006, 0.005, and 0.009 M⊙ yr−1 kpc−2, respectively.
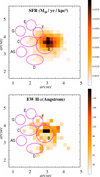 |
Fig. 5. VLT/MUSE: SFR (in units of M⊙ yr−1 kpc−2; top) and equivalent width EW(Hα) (in units of Å; bottom). Symbols have the same meaning as in Fig. 4. |
For the entire galaxy, inside a circle with a radius of 2 arcsec centered at the central part of the host, the SFR is 0.15 ± 0.02 M⊙ yr−1. One-third of this SFR (Hα flux) comes from region B. The global SFR we find is at the lower end of previous SFR determinations (see Sect. 2.2). For a host-galaxy absolute magnitude of MB = −16.9 ± 0.1 (Hjorth et al. 2005), the deduced SFR matches the observed SFR–MB relation for galaxies in the local universe (Paudel et al. 2018, their Fig. 6).
4.4. Equivalent width (Hα)
Figure 5 (bottom) shows a map of the equivalent width EW(Hα) using spaxels with a corresponding S/N ≥ 4. In addition, we required EW(Hα)> 0 and a measurable continuum level; a flux density ≥2 × 10⁻²⁰ erg s−1 cm−2 Å−1 turned out to be a reasonable choice. In doing so, the medians of the entire galaxy and of region B are 40 and 55 Å, respectively. Compared to, for example, local (d < 11 Mpc) dwarf galaxies in the luminosity range −17 ≤ MB ≤ −15 (Lee et al. 2009), this is a rather typical value.
The equivalent width peaks at the position where the Hα flux has its maximum. Here we measure EW(Hα)=230 ± 10 Å. In regions C, D, and F, the individual EW(Hα) values lie between 20 and 70 Å. In regions E and G as well as for the GRB explosion site, EW(Hα) could not be measured.
Assuming an instantaneous starburst as the source of the line emission, EW(Hα) is a proxy for the age of a star-forming region (Leitherer et al. 1999). The median value we found for region B and the entire host would then imply ages < 10 Myr (see also Cedrés et al. 2005; Kuncarayakti et al. 2013).
4.5. Metallicity
Metallicity is defined in the Z/Z⊙ notation, with Z being the total mass fraction of elements heavier than helium. Because Z is a parameter that cannot be directly measured, several empirical and theoretical metallicity-sensitive indicators have been developed in the literature. Oxygen (predominantly from core collapse supernovae) is often used as a proxy for Z (for a detailed discussion of this issue, see Nicholls et al. 2017).
We follow here Pettini & Pagel (2004, PP04), according to whom the nebular oxygen abundance can be calculated as
![Mathematical equation: $$ \begin{aligned}&12+\log \mathrm{(O/H)} = 8.73 - 0.32 \times \mathrm{O3N2}, \,\,\, \mathrm{with} \\&\mathrm{O3N2} \equiv \log \frac{{[\mathrm{O}\,\small {\text{III}} ]\ \lambda } 5007 / \mathrm{H}\beta }{[\mathrm{N}\,\small {\text{II}} ]\ \lambda 6584 / \mathrm{H}\alpha }\nonumber . \end{aligned} $$](/articles/aa/full_html/2021/06/aa39689-20/aa39689-20-eq25.gif) (5)
(5)
Since the flux ratios refer to lines that are very close to each other, the line ratios are basically insensitive to extinction by dust along the line of sight or instrumental response. According to Moustakas et al. (2006), this equation is valid for 8.12 ≲ 12 + log(O/H) < 9.05 (see also Kewley & Ellison 2008), which is fulfilled in our case (see below).
Using only spaxels that fulfill our aforementioned S/N criterion (Fig. 6), for the entire galaxy we measure a median of 12 + log(O/H) = 8.40 ± 0.05. Region B appears to be less metal-rich than the outer parts of the galaxy, but we caution that such a conclusion could also be a result of low-number statistics (a small number of spaxels with data). If correct, this, in combination with the fact that the SFR peaks in region B (Fig. 5), could indicate that star formation is triggered here by the infall of metal-poor gas. Indeed, low metallicities and high SFRs were explained by gas infall for observed (Sánchez Almeida et al. 2013, 2014a,b; Sánchez Almeida et al. 2015; Michałowski et al. 2015) and simulated (Davé et al. 2013) galaxies. Feedback from stellar winds, which is especially efficient in the low potential well of low-mass galaxies, could be an alternative scenario because regions that have consumed their gas more quickly (and so have lower SFRs) have had a higher metal production rate (for a detailed discussion, see, e.g., Sánchez Almeida et al. 2018).
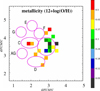 |
Fig. 6. VLT/MUSE: spatial distribution of the metallicity index 12 + log(O/H) (Eq. (5)) over the host of GRB 050709. Symbols have the same meaning as in Fig. 4. |
The measured median of 12 + log(O/H) corresponds to a metallicity  , for a solar value of 12 + log(O/H) = 8.69 (Asplund et al. 2009; but see also Kewley et al. 2019 and Vagnozzi 2019). Compared to the other short-GRB hosts listed in Berger (2014), this puts the host of GRB 050709 at the low metallicity end of the distribution.
The observed median oxygen abundance [12 + log(O/H)] of the host can be compared with its deduced stellar mass. Adopting log M⋆/M⊙ = 8.8 (Leibler & Berger 2010), we plotted the GRB 050709 host in the mass–metallicity plane, as shown in Fig. 7. The galaxies illustrated in the mass–metallicity relation (MZR) are taken from the MAGMA (Metallicity and Gas for Mass Assembly) sample of local star-forming galaxies (e.g., Ginolfi et al. 2020; Hunt et al. 2020). The metallicity calibration used for that sample is based on the linear N2 calibration from PP04, rather than their O3N2 calibration as used here7. Also shown in Fig. 7 is the MZR by Curti et al. (2020). As is evident in Fig. 7, the location of the GRB 050709 host galaxy in the MZR is entirely consistent with the behavior of local normal star-forming galaxies. The specific SFR (sSFR) of log(sSFR) = −9.8 in the context of the metallicity and stellar mass of the GRB 050709 host is also consistent with the trend of the MZR with SFR (e.g., Mannucci et al. 2010; Hunt et al. 2012, 2016).
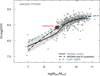 |
Fig. 7. MZR for the MAGMA sample as described in the text. The locus of the host galaxy for GRB 050709 is also shown as a solid red square; the MZRs for MAGMA are shown as a solid curve (MAGMA median) and a dashed black curve (the best quadratic fit). Also shown is the MZR from Curti et al. (2020). The GRB 050709 host falls clearly within the range of normal star-forming galaxies and, compared with MAGMA, is rather metal-enriched. |
4.6. Velocity pattern
The radial velocity map of the gas component based on the Hα emission line is shown in Fig. 8 (top). The main features in this plot are (i) a velocity gradient in the NW-to-SE direction and (ii) a rather smooth velocity field over the entire galaxy, suggesting a rotationally supported system. Apparently, the observed rather smooth kinematic morphology of this galaxy stands in contrast to its irregular photometric morphology.
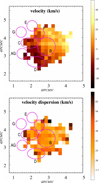 |
Fig. 8. VLT/MUSE radial velocity map (top) and the corresponding velocity dispersion (bottom) after correcting for instrumental effects and thermal line broadening. Symbols have the same meaning as in Fig. 4. |
More information about the internal dynamics of the line-emitting gas can come from the observed line-of-sight velocity dispersion. It can be written as the sum of instrumental effects, thermal line broadening, and internal gas dynamics (e.g., Lagos et al. 2009):  . MUSE has a line spread function (LSF) with an FWHM between about 2.4 and 3.0 Å (see Fig. 15 in Bacon et al. 2017). At the wavelength of the redshifted Hα line, the LSF is about 2.5 Å, corresponding to8σinstr = 42 km s−1, while for a T ∼ 104 K warm gas, σT, gas = 9.1 km s−1.
Figure 8 (bottom) shows the resulting velocity dispersion map of the Hα emission line after the subtraction of  and
and  . In the entire galaxy, σdyn, gas has values between about 20 and 40 km s−1; the median is 30 km s−1. Some higher dispersion values of up to about 60 km s−1 occur at the outskirts of the galaxy, though we cannot rule out that this is due to a lower S/N. If correct, such high values would exceed the typical velocity dispersion in HII regions and in gas that is ionized by evolved stellar populations (Kewley et al. 2019).
Several authors have investigated scaling relations between the Hα velocity dispersion and the mass in stars, including local dwarf galaxies. According to Barat et al. (2020) and Moiseev et al. (2015), for a stellar mass of log M⋆/M⊙ = 8.8, a dispersion of 30 km s−1 is at the high end of the distribution.
4.7. Emission-line diagnostic diagrams
In order to reveal the physical origin of the line emission, we followed the standard approach (e.g., Belfiore et al. 2015; Levan et al. 2017; Michałowski et al. 2018; Tanga et al. 2018; Kumari et al. 2019) and used the classical Baldwin–Philips–Terlevich (BPT) diagnostic line diagram, which allows for an identification of the main excitation mechanism of the lines (Baldwin et al. 1981; see also Kewley et al. 2001, 2006, 2019; Kauffmann et al. 2003).
The classical BPT diagram uses the line flux ratios [O III] λ 5007/Hβ and [N II] λ 6584/Hα in order to distinguish between stellar ionization of the interstellar gas (HII; star forming) and other ionization processes (stellar winds, active galactic nucleus activity, shocks). In addition, we considered the diagnostic emission-line diagram that utilizes the line ratios of [O III] λ 5007/Hβ versus [S II] λ 6718/Hα (e.g., Kewley et al. 2001, 2006). Analogous to the metallicity indicator used in Sect. 4.5, the line ratios are not very sensitive to extinction by dust along the line of sight or instrumental response.
In both diagnostic diagrams, a substantial percentage of all spaxels lie close to the star-formation demarcation line; some spaxels even lie outside the parameter space characteristic for pure star formation (Fig. 9)9. Some of these data points touch the parameter space for slow shocks (Kewley et al. 2019; their Fig. 11). Even though the pure star formation scenario is never ruled out with high statistical significance, this leaves room for a scenario in which shock excitation (e.g., Medling et al. 2015; Alatalo et al. 2016) affects the observed line emission of the galaxy to some degree.
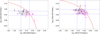 |
Fig. 9. Emission-line BPT diagnostic diagrams of the host of GRB 050709. Left: diagnostic diagram using [NII]. Shown are the corresponding values for all individual spaxels as well as their mean value with the 1σ error bars (gray box). Black data points refer to spaxels that lie inside region B, and red data points lie outside this region. The red line shows the pure star-formation demarcation line for the redshift of the galaxy (Kewley et al. 2013, their Eq. (1)). Data points above this line cannot be reproduced by pure star-formation models. Right: same as the left panel but using [SII] (Kewley et al. 2001 and Kewley et al. 2006; their Eqs. (6) and (2), respectively.) |
In order to place this finding in context, comparisons with other short-GRB hosts would be an appropriate approach. However, at present, studies of short-GRB host galaxies with integral field units (IFUs) are not very common. So far, only the host of the short GRB 170817A has been observed with an IFU (VLT/MUSE; Levan et al. 2017), but this host is an elliptical galaxy. Even for long-GRB hosts the corresponding sample of well-studied galaxies is still very small: GRB 980425 (Christensen et al. 2008; Krühler et al. 2017), GRB 060505 (Thöne et al. 2014), GRB 100316D (Izzo et al. 2017), and GRB 111005A (Tanga et al. 2018). In these cases, evidence for a substantial contribution from non-thermally excited gas has not been found.
5. Discussion
5.1. The GRB host galaxy
The host of GRB 050709 is an irregular galaxy that shines bright in various emission lines. Nevertheless, it lies roughly on the main sequence of star-forming galaxies (e.g., Saintonge et al. 2016). Figure 10 shows the relation between the sSFR and stellar mass for the MAGMA sample (Ginolfi et al. 2020; Hunt et al. 2020), together with the main sequence trend found by Saintonge et al. (2016). The locus of the GRB 050709 host is within the ±1σ variation of the main sequence as shown by the gray regions. The relatively low SFR of the host would exclude a classification of “starburst” (e.g., Telles & Melnick 2018), although there are potentially some signs, morphological and otherwise, of a past history of mergers.
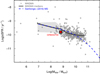 |
Fig. 10. Star-formation main sequence for the MAGMA sample as described in the text. The locus of the host galaxy for GRB 050709 is shown as a solid red square; the main sequence found by Saintonge et al. (2016) is shown as a dashed blue curve and the medians for MAGMA as heavy solid curves. The 050709 host falls within the range of normal star-forming galaxies, as shown by the gray regions that indicate a 1σ deviation from the MAGMA median. |
A visual inspection of the HST/F814W image reveals features that are typical for merging dwarf galaxies (e.g., Rich et al. 2012; Amorisco et al. 2014; Paudel et al. 2017; Paudel & Yoon 2020): there is tentative evidence for a double nucleus (where the two nuclei are situated very close to each other), there are curved and irregularly shaped filaments typical of tidal tails, and there is the generally very irregular morphology and asymmetric structure. Extinction by interstellar dust cannot explain these kiloparsec-scale features in the GRB 050709 host. Moreover, there is no obvious sign of an underlying regular disk.
There are other details that support the merger hypothesis: (i) The diagnostic diagrams suggest that nonthermal line emission is evident in the galaxy (Sect. 4.7). Such a radiation component has also been found in other merging field galaxies (e.g., Belfiore et al. 2016, their Fig. 5). (ii) The 5.5 GHz radio-continuum flux coming from the eastern part of the galaxy (Sect. 3.2) could have its origin in shocked gas. This is analogous to what has been observed in other pairs of interacting field galaxies (e.g., Donevski & Prodanović 2015). Alternatively, the infall of external gas clouds could have shaped the galaxy, a scenario that has been considered for small galaxies in the local universe (e.g., Cairós & González-Pérez 2020) as well as for long-GRB hosts (Michałowski et al. 2015).
Even the apparently smooth kinematics of the ionized gas (Fig. 8) does not contradict the merger hypothesis because it finds its analog in other merging field galaxies as well. Motivated by the need for automatic galaxy classification schemes in cosmologically deep surveys, various authors have discussed the issue of how to distinguish isolated galaxies with disks from merging galaxies. A very fruitful approach in this respect is based on the observed kinematics of the ionized or molecular gas (e.g., Barrera-Ballesteros et al. 2015; Hung et al. 2015, and references therein). Some of these studies then showed that the orbital motion of merging galaxies when convolved with a typical seeing-limited spatial resolution on the order of several kiloparsecs can mimic the regular ordered motion of a rotating disk (Hung et al. 2015; Simons et al. 2019).
We can use the comprehensive observational study by Hung et al. (2015) to find various examples of the kinematics of the gas in merging field galaxies in different evolutionary stages. These authors carried out a systematic classification of a sample of 24 local luminous infrared and ultra-luminous infrared galaxies (ULIRGs) that were observed with HST/ACS in the F814W filter and which span a wide range of morphologies, from isolated disks to fully merged remnants. In doing so, these authors provide IFU velocity and velocity dispersion maps for each case. A visual inspection of their Fig. 5 reveals three galaxies where the morphology and the kinematics of the interstellar gas strongly resemble the case of the GRB 050709 host. The gas shows a disk-like rotation curve and a smooth velocity dispersion map with no strong peak. All three of these galaxies are defined by the authors as merged galaxies with a single nucleus and tidal tails (type M4, according to their classification scheme). We note that within their scheme the GRB 050709 host might also be considered as a galaxy in such an advanced merger stage.
As we turn to the presently known short-GRB host-galaxy ensemble, our attention is directed toward a potential twin of the GRB 050709 host, namely the host of the short GRB 160821B at z = 0.1613 (Troja et al. 2019). The morphological appearance of this galaxy shows a striking similarity to the GRB 050709 host. Like the GRB 050709 host, the SED of this galaxy is dominated by line emission from Hα, Hβ, and the forbidden transitions of oxygen. Although its SFR and luminosity are a factor of ∼10 higher, its filamentary structure shows details very similar to the GRB 050709 case. Even the redshift and the relative location of the GRB explosion site with respect to the brightest central region of its host fit into the picture of a twin of the GRB 050709 host.
While these similarities are striking, they focus on a more statistical issue, namely the frequency distribution of the morphological types of short-GRB host galaxies. Given the still small number of known short-GRB hosts on the one hand and their broad range in redshifts on the other hand, this might be a complex task, and it is one that cannot be tackled here. Instead, we note the following. Khim et al. (2015) used the Sloan Digital Sky Survey Data Release 7 to perform a statistical study of the properties of isolated galaxies in the redshift range 0.025 < z < 0.044. The host of GRB 050709 lies at about four to six times higher redshift, but the corresponding age of the universe differs by only 1.5–1.7 Gyr. Khim et al. (2015) found that in their sample only 1.2% are irregularly shaped emission-line galaxies. If their galaxy sample is also representative of the galaxy zoo at redshifts around z = 0.16, then the finding of two such irregularly shaped emission-line galaxies in the total ensemble of only ∼50 short-GRB hosts (of which a substantial fraction have no known detailed morphology) might be worth keeping in mind for future studies.
While the host of GRB 050709 appears to be special in this respect, the galaxy is not an outlier in the short-GRB host-galaxy ensemble in respect to its stellar mass (log M⋆/M⊙ = 8.8; Leibler & Berger 2010), B-band luminosity (MB = −16.9 ± 0.1; Hjorth et al. 2005), SFR (0.15 ± 0.02 M⊙ yr−1; Sect. 4.3), or metallicity (12 + log(O/H) = 8.40 ± 0.05; Sect. 4.5; Berger 2014).
5.2. The GRB progenitor and the GRB explosion site
It was already potentially evident in the HST/F814W image (Fig. 1), and confirmed by our MUSE/SFR map (Fig. 5), that line emission from the interstellar gas can be traced up to regions close to the GRB position. Our data sensitivity is not good enough, however, to measure the corresponding SFR in this part of the galaxy with certainty.
It has been pointed out in the literature that the observed broadband SED of the optical transient as well as the observed Balmer decrement imply a nonzero host-galaxy visual extinction. According to Ferrero et al. (2007) and Kann et al. (2011), the AG data suggest  mag, while according to Prochaska et al. (2006) the observed Hα/Hβ flux ratio points to a global E(B − V)host > 0.4 mag. Our MUSE data confirm that the reddening values reach up to ∼0.6 mag in the optically brightest part of the galaxy.
While a sight-line visual extinction of 0.7 mag is not a spectacularly high value, for short-GRB AGs it is the exception rather than the rule (e.g., Kann et al. 2011). In particular, given the position of the GRB 050709 AG in the outskirts of its irregular host, it could be an indication of a possible star-formation complex near the GRB explosion site. Unfortunately, using our MUSE data we can neither confirm nor exclude such high reddening values at the GRB position (Sect. 4.2).
The HST/F814W image, which covers the redshifted Hα emission line, reveals several blobs or clumps some kiloparsecs away from the GRB explosion site that could be stellar clusters or star-forming regions. If that is the case, star formation is indeed ongoing in this part of the galaxy. The potential stellar nurseries that are nearest to the short-GRB explosion site are located about 0 6–0
6–0 7 away in regions C and D (Fig. 1). This corresponds to about 2 kpc in projected distance. A link between the GRB progenitor and one of these regions cannot, however, be established.
Assuming an instantaneous starburst, the characteristic lifetime of an H II region is 6–10 Myr (e.g., Copetti et al. 1986; Tremblin et al. 2014). On the other hand, stellar population synthesis models (Belczynski, priv. comm.) suggest that DNS mergers do not occur earlier than ∼10 Myr after the stellar progenitors arrive at the zero-age main sequence (ZAMS). Putting these two timescales together implies that the progenitor of GRB 050709 cannot be linked to any Hα-bright star-forming region in its host. Alternative scenarios that include a continuous starburst or three-body encounters (e.g., Gvaramadze & Gualandris 2011) may, however, provide a different conclusion.
5.3. Constraints on GRB late-time emission components
Our ATCA observations were performed 8.04 yr post burst, corresponding to 6.93 yr in the GRB host galaxy rest frame. The non-detection of a point source at the GRB explosion site at 5.5 and 9.0 GHz allows us to place constraints on the flux from the radio AG (e.g., Chandra & Frail 2012) as well as on a potential late-time kilonova radio flare that peak years after the burst (e.g., Nakar & Piran 2011; Metzger & Bower 2014; Margalit & Piran 2015; Fong et al. 2016; Horesh et al. 2016; Radice et al. 2018).
The corresponding results attained following the procedure outlined in Klose et al. (2019), using 5σ upper limits (corresponding to 25 μJy at 5.5 and 9.0 GHz), and assuming an isotropically radiating source are listed in Table 2. Here, for the radio AG we considered its spectral slope (Fν ∼ ν−β) to be either β = −1/3 or 0.7, and for a kilonova radio flare we set β = 0.7.
Upper limits on late-time radiation components.
Detection of the radio AG several years after the event was not expected as no short-GRB radio AG had ever been found beyond ∼10 days rest-frame time (Chandra & Frail 2012; Fong et al. 2015; Zhang et al. 2017); therefore, a comparison with other short-GRB data cannot be made in a meaningful way. However, long-GRB radio AGs may act as a reference since they are on average one to two orders of magnitude more luminous than their short-burst cousins. The constraint we can place on the radio luminosity is about 100 times lower than the luminosity of the canonical long-GRB AG at about 6.9 yr host frame time (for more details see Klose et al. 2019).
Concerning kilonova radio flares, the non-detection of a radiation component about 6 years after the burst (host frame) provides a deep observational upper limit. It is among the deepest flux limits obtained to date for such a radio transient (for recent summaries, see Klose et al. 2019; Ricci et al. 2021; Schroeder et al. 2020). It further supports the conclusion that very luminous radio transients following DNS mergers do not exist. Or, if they do exist, they do not peak years after the burst. Whether or not they instead peak at much earlier times remains to be explored.
6. Summary
Motivated by substantial progress in our understanding of short-GRB progenitors, we performed a multiwavelength observing campaign of one of the cosmologically nearest short-GRB hosts. Using ATCA (radio), ALMA (submillimeter), Spitzer (mid-infrared), and VLT/MUSE (optical) observations in combination with publicly available HST/F814W images, we explored the physical properties of the irregularly shaped host of GRB 050709.
The host was detected neither by ALMA in band 6 (1.1–1.4 mm) nor by Spitzer at 24 μm, providing a firm upper limit on its SFR of ∼1.5–4.5 M⊙ yr−1. In our ATCA 5.5 GHz radio-continuum observations, however, we find tentative evidence for faint, diffuse emission arising from the eastern part of the host, where the AG was located. If this faint radio component were due to star formation activity, this would correspond to an SFR of about 2–3 M⊙ yr−1. However, in line with the ALMA and Spitzer non-detections, the MUSE observations do not support such an interpretation.
The MUSE data revealed that the entire host is a source of intense line emission superimposed on a rather weak stellar continuum. Using the Hα line, the velocity field appears to show the typical structure of a rotating galaxy. The velocity dispersion in this line is rather smooth across the entire galaxy, varying between about 20 and 40 km s−1. This smooth kinematic morphology stands in stark contrast to the galaxy’s irregular photometric morphology.
Based on the observed Balmer decrement, we measure an internal reddening by dust up to about 0.6 mag, in agreement with earlier studies. Unfortunately, within the constraints we set on the S/N, no reddening value could be determined for the GRB explosion site. The spatially resolved Hα emission reveals an asymmetric structure with a single peak and a longer tail in the SE direction relative to the NW direction. At this peak, the Hα-derived SFR is ∼0.04 M⊙ yr−1 kpc−2 and the equivalent width (Hα) reaches more than 200 Å. The extinction-corrected total SFR of the metal-poor host (about 0.5 solar) based on the observed Hα luminosity is ∼0.15 M⊙ yr−1, in agreement with previous findings.
Diagnostic emission-line diagrams based on the flux ratios [O III] λ 5007/Hβ, [N II] λ 6584/Hα, and [S II] λ 6718/Hα suggest that a fraction of the entire line emission could be due to shock-excited gas. If correct, this could also be the origin of the faint diffuse radio emission seen by ATCA. This potential evidence for shocked gas, the very irregular morphological appearance of the host, and a comparison of the observed kinematics of the Hα-emitting gas with analogous results for merging field galaxies led us to conclude that the GRB 050709 host is most likely a galaxy in an advanced merger stage.
Several bright blobs can be identified in the HST/F814W image, which are distributed across the host; they probably represent Hα-bright star-forming regions or luminous stellar clusters. The potential star-forming regions nearest to the AG position lie about 2 kpc away (projected distance). However, a link between the short-GRB progenitor to one of these star-forming regions cannot be established. Nevertheless, an important constraint on the explosion dynamics can be set. The fact that no radio point source was detected by ATCA superimposed on the host provides a valuable upper limit on the late-time emission from the GRB AG or a potential kilonova radio flare.
Before the detection of GW170817/GRB 170817A, no short burst at a redshift z < 0.1 had been known. GW170817 has shown that GW observatories can detect DNS merger events at cosmologically very close distances. This means that we can expect to detect promising host-galaxy targets in the coming years, and it will allow us to further zoom in to GRB explosion environments. First impressive steps in this respect have already been undertaken using VLT/MUSE and the HST (Levan et al. 2017).
See also J.G.’s web page at https://www.mpe.mpg.de/~jcg/grbgen.html
W1(3.4 μm), W2(4.6 μm), W3(12 μm), W4(22 μm).
Adopting Case B recombination at T = 104 K and an electron density of ne ∼ 102 − 104 cm−3 (Osterbrock 1989).
The PP04 O3N2 and N2 calibrations are generally at the low end of the scale when compared to diagnostics based on photoionization models (e.g., Kewley & Ellison 2008), so other diagnostics would likely give an even higher metallicity value.
FWHM = 2.35, σ = 98 km s−1.
We note that the ensemble of spaxels that fulfills the criterion S/N ≥ 2 in the [N II] λ 6584 line is not identical to the ensemble of spaxels that fulfills this S/N criterion for the [S II] λ 6718 line.
Acknowledgments
A.N.G. and S.K. acknowledge financial support by grants DFG Kl 766/16-3, DFG Kl 766/18-1, and DFG RA 2484/1-3. P.S. acknowledges support through the Sofja Kovalevskaja Award from the Alexander von Humboldt Foundation of Germany. M.J.M. acknowledges the support of the National Science Centre, Poland through the SONATA BIS grant 2018/30/E/ST9/00208. The authors thank Thomas Krühler for providing several numerical tools for VLT/MUSE data reduction and for taking care of the VLT/MUSE observations and a first data reduction. A.N.G. and S.K. thank Kris Belczynski, Polish Academy of Sciences, for his interest in this work and very useful discussions. Based on observations made with the NASA/ESA Hubble Space Telescope, and obtained from the Hubble Legacy Archive, which is a collaboration between the Space Telescope Science Institute (STScI/NASA), the Space Telescope European Coordinating Facility (ST-ECF/ESA) and the Canadian Astronomy Data Centre (CADC/NRC/CSA). The Australia Telescope is funded by the Commonwealth of Australia for operation as a National Facility managed by CSIRO. A.N.G. and S.K. thank Catarina Ubach and Sarah Maddison, Swinburne University, Ivy Wong, CSIRO Sydney, and Jamie Stevens, CSIRO Narrabri, for helpful discussions and observing guidance. This paper makes use of the following ALMA data: 2016.1.01333.S. ALMA is a partnership of ESO (representing its member states), NSF (USA) and NINS (Japan), together with NRC (Canada), MOST and ASIAA (Taiwan), and KASI (Republic of Korea), in cooperation with the Republic of Chile. The Joint ALMA Observatory is operated by ESO, AUI/NRAO and NAOJ. This work is based in part on observations made with the Spitzer Space Telescope, which was operated by the Jet Propulsion Laboratory, California Institute of Technology under a contract with NASA. This research has made use of the SIMBAD database, operated at CDS, Strasbourg, France. This research has made use of the NASA/IPAC Extragalactic Database (NED) which is operated by the Jet Propulsion Laboratory, California Institute of Technology, under contract with the National Aeronautics and Space Administration. The authors thank the anonymous referee for a very careful reading of the manuscript and for very valuable suggestions that helped to improve the content of this paper.
References
- Alatalo, K., Cales, S. L., Rich, J. A., et al. 2016, ApJS, 224, 38 [NASA ADS] [CrossRef] [Google Scholar]
- Amati, L., Guidorzi, C., Frontera, F., et al. 2008, MNRAS, 391, 577 [NASA ADS] [CrossRef] [MathSciNet] [Google Scholar]
- Amorisco, N. C., Evans, N. W., & van de Ven, G. 2014, Nature, 507, 335 [NASA ADS] [CrossRef] [Google Scholar]
- Asplund, M., Grevesse, N., Sauval, A. J., & Scott, P. 2009, ARA&A, 47, 481 [NASA ADS] [CrossRef] [Google Scholar]
- Bacon, R., Accardo, M., Adjali, L., et al. 2010, in Ground-based and Airborne Instrumentation for Astronomy III, eds. I. S. McLean, S. K. Ramsay,&H. Takami, SPIE Conf. Ser., 7735, 773508 [CrossRef] [Google Scholar]
- Bacon, R., Conseil, S., Mary, D., et al. 2017, A&A, 608, A1 [NASA ADS] [CrossRef] [EDP Sciences] [Google Scholar]
- Baldwin, J. A., Phillips, M. M., & Terlevich, R. 1981, PASP, 93, 5 [NASA ADS] [CrossRef] [EDP Sciences] [Google Scholar]
- Barat, D., D’Eugenio, F., Colless, M., et al. 2020, MNRAS, 498, 5885 [NASA ADS] [CrossRef] [Google Scholar]
- Barrera-Ballesteros, J. K., García-Lorenzo, B., Falcón-Barroso, J., et al. 2015, A&A, 582, A21 [NASA ADS] [CrossRef] [EDP Sciences] [Google Scholar]
- Belfiore, F., Maiolino, R., Bundy, K., et al. 2015, MNRAS, 449, 867 [NASA ADS] [CrossRef] [Google Scholar]
- Belfiore, F., Maiolino, R., Maraston, C., et al. 2016, MNRAS, 461, 3111 [Google Scholar]
- Berger, E. 2014, ARA&A, 52, 43 [NASA ADS] [CrossRef] [Google Scholar]
- Blanchard, P. K., Berger, E., Fong, W., et al. 2017, ApJ, 848, L22 [NASA ADS] [CrossRef] [Google Scholar]
- Bloom, J. S., Djorgovski, S. G., Kulkarni, S. R., & Frail, D. A. 1998, ApJ, 507, L25 [NASA ADS] [CrossRef] [Google Scholar]
- Boer, M., Ricker, G., Atteia, J.-L., et al. 2005, GRB Coordinates Network, 3653, 1 [Google Scholar]
- Briggs, D. S. 1995, Bull. Am. Astron. Soc., 27, 112.02 [Google Scholar]
- Bruzual, G., & Charlot, S. 2003, MNRAS, 344, 1000 [NASA ADS] [CrossRef] [Google Scholar]
- Butler, N., Ricker, G., Atteia, J.-L., et al. 2005, GRB Coordinates Network, 3570, 1 [Google Scholar]
- Cairós, L. M., & González-Pérez, J. N. 2020, A&A, 634, A95 [CrossRef] [EDP Sciences] [Google Scholar]
- Cedrés, B., Cepa, J., & Tomita, A. 2005, ApJ, 634, 1043 [NASA ADS] [CrossRef] [Google Scholar]
- Chandra, P., & Frail, D. A. 2012, ApJ, 746, 156 [NASA ADS] [CrossRef] [Google Scholar]
- Chary, R., & Elbaz, D. 2001, ApJ, 556, 562 [Google Scholar]
- Chrimes, A. A., Stanway, E. R., Levan, A. J., et al. 2018, MNRAS, 478, 2 [CrossRef] [Google Scholar]
- Christensen, L., Vreeswijk, P. M., Sollerman, J., et al. 2008, A&A, 490, 45 [NASA ADS] [CrossRef] [EDP Sciences] [Google Scholar]
- Cid Fernandes, R., Mateus, A., Sodré, L., Stasińska, G., & Gomes, J. M. 2005, MNRAS, 358, 363 [NASA ADS] [CrossRef] [Google Scholar]
- Cid Fernandes, R., Schoenell, W., Gomes, J. M., et al. 2009, Rev. Mex. Astron. Astrofis. Conf. Ser., 35, 127 [Google Scholar]
- Copetti, M. V. F., Pastoriza, M. G., & Dottori, H. A. 1986, A&A, 156, 111 [NASA ADS] [Google Scholar]
- Covino, S., Malesani, D., Israel, G. L., et al. 2006, A&A, 447, L5 [NASA ADS] [CrossRef] [EDP Sciences] [Google Scholar]
- Curti, M., Mannucci, F., Cresci, G., & Maiolino, R. 2020, MNRAS, 491, 944 [NASA ADS] [CrossRef] [Google Scholar]
- Dale, D. A., Aniano, G., Engelbracht, C. W., et al. 2012, ApJ, 745, 95 [NASA ADS] [CrossRef] [Google Scholar]
- D’Avanzo, P. 2015, J. High Energy Astrophys., 7, 73 [NASA ADS] [CrossRef] [Google Scholar]
- D’Avanzo, P., Salvaterra, R., Bernardini, M. G., et al. 2014, MNRAS, 442, 2342 [NASA ADS] [CrossRef] [Google Scholar]
- Davé, R., Katz, N., Oppenheimer, B. D., Kollmeier, J. A., & Weinberg, D. H. 2013, MNRAS, 434, 2645 [NASA ADS] [CrossRef] [Google Scholar]
- Djorgovski, S. G., Kulkarni, S. R., Bloom, J. S., et al. 1998, ApJ, 508, L17 [NASA ADS] [CrossRef] [Google Scholar]
- Donevski, D., & Prodanović, T. 2015, MNRAS, 453, 638 [NASA ADS] [CrossRef] [Google Scholar]
- Ebrová, I., Bílek, M., Yıldız, M. K., & Eliášek, J. 2020, A&A, 634, A73 [CrossRef] [EDP Sciences] [Google Scholar]
- Elbaz, D., Daddi, E., Le Borgne, D., et al. 2007, A&A, 468, 33 [NASA ADS] [CrossRef] [EDP Sciences] [Google Scholar]
- Fensch, J., Duc, P. A., Weilbacher, P. M., Boquien, M., & Zackrisson, E. 2016, A&A, 585, A79 [NASA ADS] [CrossRef] [EDP Sciences] [Google Scholar]
- Ferrero, P., Sanchez, S. F., Kann, D. A., et al. 2007, AJ, 134, 2118 [NASA ADS] [CrossRef] [Google Scholar]
- Fong, W., Berger, E., Margutti, R., & Zauderer, B. A. 2015, ApJ, 815, 102 [NASA ADS] [CrossRef] [Google Scholar]
- Fong, W., Metzger, B. D., Berger, E., & Özel, F. 2016, ApJ, 831, 141 [CrossRef] [Google Scholar]
- Fox, D. B., Frail, D. A., Price, P. A., et al. 2005, Nature, 437, 845 [NASA ADS] [CrossRef] [PubMed] [Google Scholar]
- Gehrels, N., Chincarini, G., Giommi, P., et al. 2004, ApJ, 611, 1005 [NASA ADS] [CrossRef] [Google Scholar]
- Gehrels, N., Sarazin, C. L., O’Brien, P. T., et al. 2005, Nature, 437, 851 [NASA ADS] [CrossRef] [PubMed] [Google Scholar]
- Ginolfi, M., Hunt, L. K., Tortora, C., Schneider, R., & Cresci, G. 2020, A&A, 638, A4 [CrossRef] [EDP Sciences] [Google Scholar]
- Greiner, J., Michałowski, M. J., Klose, S., et al. 2016, A&A, 593, A17 [NASA ADS] [CrossRef] [EDP Sciences] [Google Scholar]
- Greis, S. M. L., Stanway, E. R., Levan, A. J., Davies, L. J. M., & Eldridge, J. J. 2017, MNRAS, 470, 489 [CrossRef] [Google Scholar]
- Gvaramadze, V. V., & Gualandris, A. 2011, MNRAS, 410, 304 [NASA ADS] [CrossRef] [Google Scholar]
- Hjorth, J., Watson, D., Fynbo, J. P. U., et al. 2005, Nature, 437, 859 [NASA ADS] [CrossRef] [PubMed] [Google Scholar]
- Horesh, A., Hotokezaka, K., Piran, T., Nakar, E., & Hancock, P. 2016, ApJ, 819, L22 [CrossRef] [Google Scholar]
- Hung, C.-L., Rich, J. A., Yuan, T., et al. 2015, ApJ, 803, 62 [NASA ADS] [CrossRef] [Google Scholar]
- Hunt, L., Magrini, L., Galli, D., et al. 2012, MNRAS, 427, 906 [NASA ADS] [CrossRef] [Google Scholar]
- Hunt, L. K., Palazzi, E., Michałowski, M. J., et al. 2014, A&A, 565, A112 [NASA ADS] [CrossRef] [EDP Sciences] [Google Scholar]
- Hunt, L., Dayal, P., Magrini, L., & Ferrara, A. 2016, MNRAS, 463, 2002 [NASA ADS] [CrossRef] [Google Scholar]
- Hunt, L. K., Tortora, C., Ginolfi, M., & Schneider, R. 2020, A&A, 643, A180 [CrossRef] [EDP Sciences] [Google Scholar]
- Izzo, L., Thöne, C. C., Schulze, S., et al. 2017, MNRAS, 472, 4480 [Google Scholar]
- Joye, W. A., & Mandel, E. 2003, in Astronomical Data Analysis Software and Systems XII, eds. H. E. Payne, R. I. Jedrzejewski, & R. N. Hook, ASP Conf. Ser., 295, 489 [NASA ADS] [Google Scholar]
- Kann, D. A., Klose, S., Zhang, B., et al. 2010, ApJ, 720, 1513 [Google Scholar]
- Kann, D. A., Klose, S., Zhang, B., et al. 2011, ApJ, 734, 96 [NASA ADS] [CrossRef] [Google Scholar]
- Kauffmann, G., Heckman, T. M., Tremonti, C., et al. 2003, MNRAS, 346, 1055 [Google Scholar]
- Kennicutt, Jr., R. C. 1998, ARA&A, 36, 189 [Google Scholar]
- Kennicutt, Jr., R. C., & Evans, N. J. 2012, ARA&A, 50, 531 [NASA ADS] [CrossRef] [Google Scholar]
- Kewley, L. J., & Ellison, S. L. 2008, ApJ, 681, 1183 [Google Scholar]
- Kewley, L. J., Dopita, M. A., Sutherland, R. S., Heisler, C. A., & Trevena, J. 2001, ApJ, 556, 121 [NASA ADS] [CrossRef] [Google Scholar]
- Kewley, L. J., Groves, B., Kauffmann, G., & Heckman, T. 2006, MNRAS, 372, 961 [NASA ADS] [CrossRef] [Google Scholar]
- Kewley, L. J., Maier, C., Yabe, K., et al. 2013, ApJ, 774, L10 [Google Scholar]
- Kewley, L. J., Nicholls, D. C., & Sutherland, R. S. 2019, ARA&A, 57, 511 [Google Scholar]
- Khim, H.-G., Park, J., Seo, S.-W., et al. 2015, ApJS, 220, 3 [NASA ADS] [CrossRef] [Google Scholar]
- Klose, S., Nicuesa Guelbenzu, A. M., Michałowski, M. J., et al. 2019, ApJ, 887, 206 [CrossRef] [Google Scholar]
- Krühler, T., Kuncarayakti, H., Schady, P., et al. 2017, A&A, 602, A85 [NASA ADS] [CrossRef] [EDP Sciences] [Google Scholar]
- Kulkarni, S. R., Djorgovski, S. G., Ramaprakash, A. N., et al. 1998, Nature, 393, 35 [NASA ADS] [CrossRef] [Google Scholar]
- Kumari, N., James, B. L., Irwin, M. J., & Aloisi, A. 2019, MNRAS, 485, 1103 [CrossRef] [Google Scholar]
- Kuncarayakti, H., Doi, M., Aldering, G., et al. 2013, AJ, 146, 30 [NASA ADS] [CrossRef] [Google Scholar]
- Lagos, P., Telles, E., Muñoz-Tuñón, C., et al. 2009, AJ, 137, 5068 [NASA ADS] [CrossRef] [Google Scholar]
- Lee, J. C., Kennicutt, Jr., R. C., Funes, S. J. J. G., Sakai, S., & Akiyama, S. 2009, ApJ, 692, 1305 [NASA ADS] [CrossRef] [Google Scholar]
- Lee, M. G., Kang, J., & Im, M. 2018, ApJ, 859, L6 [CrossRef] [Google Scholar]
- Leibler, C. N., & Berger, E. 2010, ApJ, 725, 1202 [NASA ADS] [CrossRef] [Google Scholar]
- Leitherer, C., Schaerer, D., Goldader, J. D., et al. 1999, ApJS, 123, 3 [Google Scholar]
- Levan, A. J., Lyman, J. D., Tanvir, N. R., et al. 2017, ApJ, 848, L28 [Google Scholar]
- Makovoz, D., & Marleau, F. R. 2005, PASP, 117, 1113 [NASA ADS] [CrossRef] [Google Scholar]
- Mannucci, F., Cresci, G., Maiolino, R., Marconi, A., & Gnerucci, A. 2010, MNRAS, 408, 2115 [Google Scholar]
- Margalit, B., & Piran, T. 2015, MNRAS, 452, 3419 [CrossRef] [Google Scholar]
- Medling, A. M., Vivian, U., Rich, J. A., et al. 2015, MNRAS, 448, 2301 [NASA ADS] [CrossRef] [Google Scholar]
- Metzger, B. D., & Bower, G. C. 2014, MNRAS, 437, 1821 [CrossRef] [Google Scholar]
- Metzger, M. R., Djorgovski, S. G., Kulkarni, S. R., et al. 1997, Nature, 387, 878 [NASA ADS] [CrossRef] [Google Scholar]
- Michałowski, M. J., Hjorth, J., Malesani, D., et al. 2009, ApJ, 693, 347 [NASA ADS] [CrossRef] [Google Scholar]
- Michałowski, M. J., Hunt, L. K., Palazzi, E., et al. 2014, A&A, 562, A70 [NASA ADS] [CrossRef] [EDP Sciences] [Google Scholar]
- Michałowski, M. J., Gentile, G., Hjorth, J., et al. 2015, A&A, 582, A78 [NASA ADS] [CrossRef] [EDP Sciences] [Google Scholar]
- Michałowski, M. J., Castro Cerón, J. M., Wardlow, J. L., et al. 2016, A&A, 595, A72 [NASA ADS] [CrossRef] [EDP Sciences] [Google Scholar]
- Michałowski, M. J., Xu, D., Stevens, J., et al. 2018, A&A, 616, A169 [NASA ADS] [CrossRef] [EDP Sciences] [Google Scholar]
- Michałowski, M. J., Gotkiewicz, N., Hjorth, J., & Kamphuis, P. 2020, A&A, 638, A47 [CrossRef] [EDP Sciences] [Google Scholar]
- Minkowski, R. 1941, PASP, 53, 224 [NASA ADS] [CrossRef] [Google Scholar]
- Moiseev, A. V., Tikhonov, A. V., & Klypin, A. 2015, MNRAS, 449, 3568 [NASA ADS] [CrossRef] [Google Scholar]
- Moustakas, J., Kennicutt, Jr., R. C., & Tremonti, C. A. 2006, ApJ, 642, 775 [NASA ADS] [CrossRef] [Google Scholar]
- Murphy, E. J., Condon, J. J., Schinnerer, E., et al. 2011, ApJ, 737, 67 [NASA ADS] [CrossRef] [Google Scholar]
- Nakar, E., & Piran, T. 2011, Nature, 478, 82 [NASA ADS] [CrossRef] [PubMed] [Google Scholar]
- Natarajan, P., Bloom, J. S., Sigurdsson, S., et al. 1997, New Astron., 2, 471 [CrossRef] [Google Scholar]
- Nicholls, D. C., Sutherland, R. S., Dopita, M. A., Kewley, L. J., & Groves, B. A. 2017, MNRAS, 466, 4403 [Google Scholar]
- Nicuesa Guelbenzu, A., Klose, S., Greiner, J., et al. 2012, A&A, 548, A101 [NASA ADS] [CrossRef] [EDP Sciences] [Google Scholar]
- Norris, J. P., & Bonnell, J. T. 2006, ApJ, 643, 266 [NASA ADS] [CrossRef] [Google Scholar]
- Nysewander, M., Fruchter, A. S., & Pe’er, A. 2009, ApJ, 701, 824 [NASA ADS] [CrossRef] [Google Scholar]
- Odewahn, S. C., Djorgovski, S. G., Kulkarni, S. R., et al. 1998, ApJ, 509, L5 [NASA ADS] [CrossRef] [Google Scholar]
- Osterbrock, D. E. 1989, Astrophysics of Gaseous Nebulae and Active Galactic Nuclei (New York: University Science Books), 422 [Google Scholar]
- Paudel, S., & Yoon, S.-J. 2020, ApJ, 898, L47 [CrossRef] [Google Scholar]
- Paudel, S., Duc, P. A., & Ree, C. H. 2015, AJ, 149, 114 [NASA ADS] [CrossRef] [Google Scholar]
- Paudel, S., Smith, R., Duc, P.-A., et al. 2017, ApJ, 834, 66 [NASA ADS] [CrossRef] [Google Scholar]
- Paudel, S., Smith, R., Yoon, S. J., Calderón-Castillo, P., & Duc, P.-A. 2018, ApJS, 237, 36 [Google Scholar]
- Pei, Y. C. 1992, ApJ, 395, 130 [NASA ADS] [CrossRef] [Google Scholar]
- Pettini, M., & Pagel, B. E. J. 2004, MNRAS, 348, L59 [NASA ADS] [CrossRef] [Google Scholar]
- Planck Collaboration XIII. 2016, A&A, 594, A13 [NASA ADS] [CrossRef] [EDP Sciences] [Google Scholar]
- Prochaska, J. X., Bloom, J. S., Chen, H.-W., et al. 2006, ApJ, 642, 989 [NASA ADS] [CrossRef] [Google Scholar]
- Radice, D., Perego, A., Hotokezaka, K., et al. 2018, ApJ, 869, 869 [NASA ADS] [CrossRef] [Google Scholar]
- Reaves, G. 1953, PASP, 65, 242 [NASA ADS] [CrossRef] [Google Scholar]
- Ricci, R., Troja, E., Bruni, G., et al. 2021, MNRAS, 500, 1708 [CrossRef] [Google Scholar]
- Rich, R. M., Collins, M. L. M., Black, C. M., et al. 2012, Nature, 482, 192 [NASA ADS] [CrossRef] [Google Scholar]
- Ricker, G. R. 1997, in All-Sky X-Ray Observations in the Next Decade, eds. M. Matsuoka, & N. Kawai, 366 [Google Scholar]
- Rieke, G. H., Young, E. T., Engelbracht, C. W., et al. 2004, ApJS, 154, 25 [NASA ADS] [CrossRef] [Google Scholar]
- Saintonge, A., Catinella, B., Cortese, L., et al. 2016, MNRAS, 462, 1749 [Google Scholar]
- Sánchez Almeida, J., Muñoz-Tuñón, C., Elmegreen, D. M., Elmegreen, B. G., & Méndez-Abreu, J. 2013, ApJ, 767, 74 [NASA ADS] [CrossRef] [Google Scholar]
- Sánchez Almeida, J., Elmegreen, B. G., Muñoz-Tuñón, C., & Elmegreen, D. M. 2014a, A&ARv, 22, 71 [NASA ADS] [CrossRef] [Google Scholar]
- Sánchez Almeida, J., Morales-Luis, A. B., Muñoz-Tuñón, C., et al. 2014b, ApJ, 783, 45 [NASA ADS] [CrossRef] [Google Scholar]
- Sánchez Almeida, J., Elmegreen, B. G., Muñoz-Tuñón, C., et al. 2015, ApJ, 810, L15 [NASA ADS] [CrossRef] [Google Scholar]
- Sánchez Almeida, J., Caon, N., Muñoz-Tuñón, C., Filho, M., & Cerviño, M. 2018, MNRAS, 476, 4765 [Google Scholar]
- Sault, R. J., Teuben, P. J., & Wright, M. C. H. 1995, PASP, 77, 433 [Google Scholar]
- Schlafly, E. F., & Finkbeiner, D. P. 2011, ApJ, 737, 103 [NASA ADS] [CrossRef] [Google Scholar]
- Schroeder, G., Margalit, B., Fong, W.-F., et al. 2020, ApJ, 902, 82 [Google Scholar]
- Simons, R. C., Kassin, S. A., Snyder, G. F., et al. 2019, ApJ, 874, 59 [NASA ADS] [CrossRef] [Google Scholar]
- Smette, A., Sana, H., Noll, S., et al. 2015, A&A, 576, A77 [NASA ADS] [CrossRef] [EDP Sciences] [Google Scholar]
- Tanga, M., Krühler, T., Schady, P., et al. 2018, A&A, 615, A136 [NASA ADS] [CrossRef] [EDP Sciences] [Google Scholar]
- Telles, E., & Melnick, J. 2018, A&A, 615, A55 [EDP Sciences] [Google Scholar]
- Thöne, C. C., Christensen, L., Prochaska, J. X., et al. 2014, MNRAS, 441, 2034 [Google Scholar]
- Tremblin, P., Anderson, L. D., Didelon, P., et al. 2014, A&A, 568, A4 [NASA ADS] [CrossRef] [EDP Sciences] [Google Scholar]
- Troja, E., Castro-Tirado, A. J., Becerra González, J., et al. 2019, MNRAS, 489, 2104 [Google Scholar]
- Tzanavaris, P., Hornschemeier, A. E., Gallagher, S. C., et al. 2010, ApJ, 716, 556 [NASA ADS] [CrossRef] [Google Scholar]
- Vagnozzi, S. 2019, Atoms, 7, 41 [NASA ADS] [CrossRef] [Google Scholar]
- van den Bergh, S. 1959, Ann. d’Astrophys., 22, 123 [Google Scholar]
- Villasenor, J. S., Lamb, D. Q., Ricker, G. R., et al. 2005, Nature, 437, 855 [NASA ADS] [CrossRef] [PubMed] [Google Scholar]
- Weilbacher, P. M., Streicher, O., Urrutia, T., et al. 2012, in Software and Cyberinfrastructure for Astronomy II, Proc. SPIE, 8451, 84510B [CrossRef] [Google Scholar]
- Weilbacher, P. M., Streicher, O., Urrutia, T., et al. 2014, in Astronomical Data Analysis Software and Systems XXIII, eds. N. Manset, &P. Forshay, ASP Conf. Ser., 485, 451 [Google Scholar]
- Werner, M. W., Roellig, T. L., Low, F. J., et al. 2004, ApJS, 154, 1 [NASA ADS] [CrossRef] [Google Scholar]
- Wilson, W. E., Ferris, R. H., Axtens, P., et al. 2011, MNRAS, 416, 832 [NASA ADS] [CrossRef] [Google Scholar]
- Wright, E. L., Eisenhardt, P. R. M., Mainzer, A. K., et al. 2010, AJ, 140, 1868 [Google Scholar]
- Zhang, S., Jin, Z.-P., Wang, Y.-Z., & Wei, D.-M. 2017, ApJ, 835, 73 [Google Scholar]
All Tables
All Figures
|
Fig. 1. Archived HST/ACS F814W image of the host of GRB 050709 and its AG taken in July and August 2005 (HST program ID 10624, principal investigator: D. Fox). Labels indicate the AG (blue), the optically brightest part of the host (B), and potentially star-forming regions or young luminous stellar clusters placed along tidal arms (C and D). The apparently faint western region of the host (H) is filled with ionized gas (Sect. 4). “Q” is an anonymous point-like emission-line object, which we have used as a reference for the astrometry between HST and VLT/MUSE (see Sect. 3.4). Coordinate values are given in units of arcseconds relative to object Q. The inset shows an optical contour plot that reveals two peaks inside region B that are 0 |
| In the text | |
|
Fig. 2. ATCA radio-continuum 5.5 GHz contours of the field of GRB 050709, overlaid on the HST image. It shows faint extended emission in the eastern part of the galaxy. Contour levels (in blue) start at three times the image 1σrms of 5.3 μJy beam−1 and continue in steps of 0.5σrms. In addition, we indicate the optical AG and the redshifts for some objects as they follow from the VLT/MUSE data (see Sect. 3.4). The galaxy ∼13 arcsec northeast of the GRB host is a morphologically disturbed LIRG at z = 0.481 (GALEXASC J230127.17–385825.6). The beam is shown in black. |
| In the text | |
|
Fig. 3. Example spectrum extracted from a spaxel in the central region of the host galaxy of GRB 050709, illustrating the separation of the stellar and gas-phase components. Top: original spectrum containing stellar and ionized gas emission (black) and the model stellar fit (red). Middle: zoom-in of the continuum shown in the top panel. Bottom: spectrum of the gas-phase-only component (blue) together with the error spectrum (black). |
| In the text | |
|
Fig. 4. VLT/MUSE view of the host of GRB 050709: E(B − V) in units of magnitudes. Grid coordinates are given in units of arcseconds relative to the emission-line object Q shown in Fig. 1. The circles have the same meaning as in Fig. 1. The “AG” refers to the region that includes the afterglow position. One spaxel ( |
| In the text | |
|
Fig. 5. VLT/MUSE: SFR (in units of M⊙ yr−1 kpc−2; top) and equivalent width EW(Hα) (in units of Å; bottom). Symbols have the same meaning as in Fig. 4. |
| In the text | |
|
Fig. 6. VLT/MUSE: spatial distribution of the metallicity index 12 + log(O/H) (Eq. (5)) over the host of GRB 050709. Symbols have the same meaning as in Fig. 4. |
| In the text | |
|
Fig. 7. MZR for the MAGMA sample as described in the text. The locus of the host galaxy for GRB 050709 is also shown as a solid red square; the MZRs for MAGMA are shown as a solid curve (MAGMA median) and a dashed black curve (the best quadratic fit). Also shown is the MZR from Curti et al. (2020). The GRB 050709 host falls clearly within the range of normal star-forming galaxies and, compared with MAGMA, is rather metal-enriched. |
| In the text | |
|
Fig. 8. VLT/MUSE radial velocity map (top) and the corresponding velocity dispersion (bottom) after correcting for instrumental effects and thermal line broadening. Symbols have the same meaning as in Fig. 4. |
| In the text | |
|
Fig. 9. Emission-line BPT diagnostic diagrams of the host of GRB 050709. Left: diagnostic diagram using [NII]. Shown are the corresponding values for all individual spaxels as well as their mean value with the 1σ error bars (gray box). Black data points refer to spaxels that lie inside region B, and red data points lie outside this region. The red line shows the pure star-formation demarcation line for the redshift of the galaxy (Kewley et al. 2013, their Eq. (1)). Data points above this line cannot be reproduced by pure star-formation models. Right: same as the left panel but using [SII] (Kewley et al. 2001 and Kewley et al. 2006; their Eqs. (6) and (2), respectively.) |
| In the text | |
|
Fig. 10. Star-formation main sequence for the MAGMA sample as described in the text. The locus of the host galaxy for GRB 050709 is shown as a solid red square; the main sequence found by Saintonge et al. (2016) is shown as a dashed blue curve and the medians for MAGMA as heavy solid curves. The 050709 host falls within the range of normal star-forming galaxies, as shown by the gray regions that indicate a 1σ deviation from the MAGMA median. |
| In the text | |
Current usage metrics show cumulative count of Article Views (full-text article views including HTML views, PDF and ePub downloads, according to the available data) and Abstracts Views on Vision4Press platform.
Data correspond to usage on the plateform after 2015. The current usage metrics is available 48-96 hours after online publication and is updated daily on week days.
Initial download of the metrics may take a while.