Fig. 4.
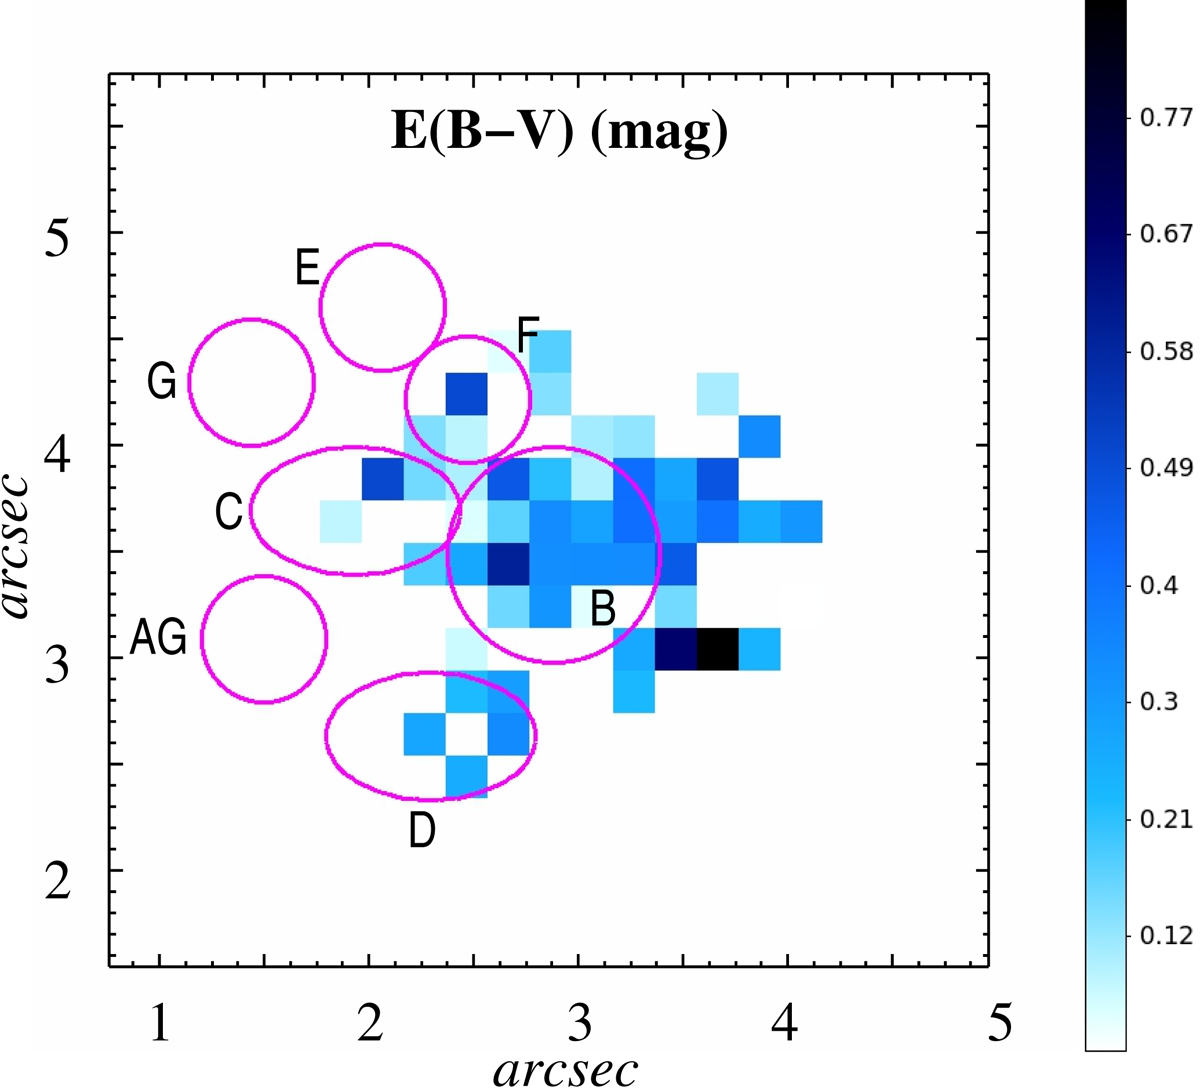
VLT/MUSE view of the host of GRB 050709: E(B − V) in units of magnitudes. Grid coordinates are given in units of arcseconds relative to the emission-line object Q shown in Fig. 1. The circles have the same meaning as in Fig. 1. The “AG” refers to the region that includes the afterglow position. One spaxel (![]() ) corresponds to 0.57 × 0.57 kpc2. We note that the positional accuracy of these regions on the MUSE images compared to the HST image is about ±1 spaxel.
) corresponds to 0.57 × 0.57 kpc2. We note that the positional accuracy of these regions on the MUSE images compared to the HST image is about ±1 spaxel.
Current usage metrics show cumulative count of Article Views (full-text article views including HTML views, PDF and ePub downloads, according to the available data) and Abstracts Views on Vision4Press platform.
Data correspond to usage on the plateform after 2015. The current usage metrics is available 48-96 hours after online publication and is updated daily on week days.
Initial download of the metrics may take a while.