Fig. 3.
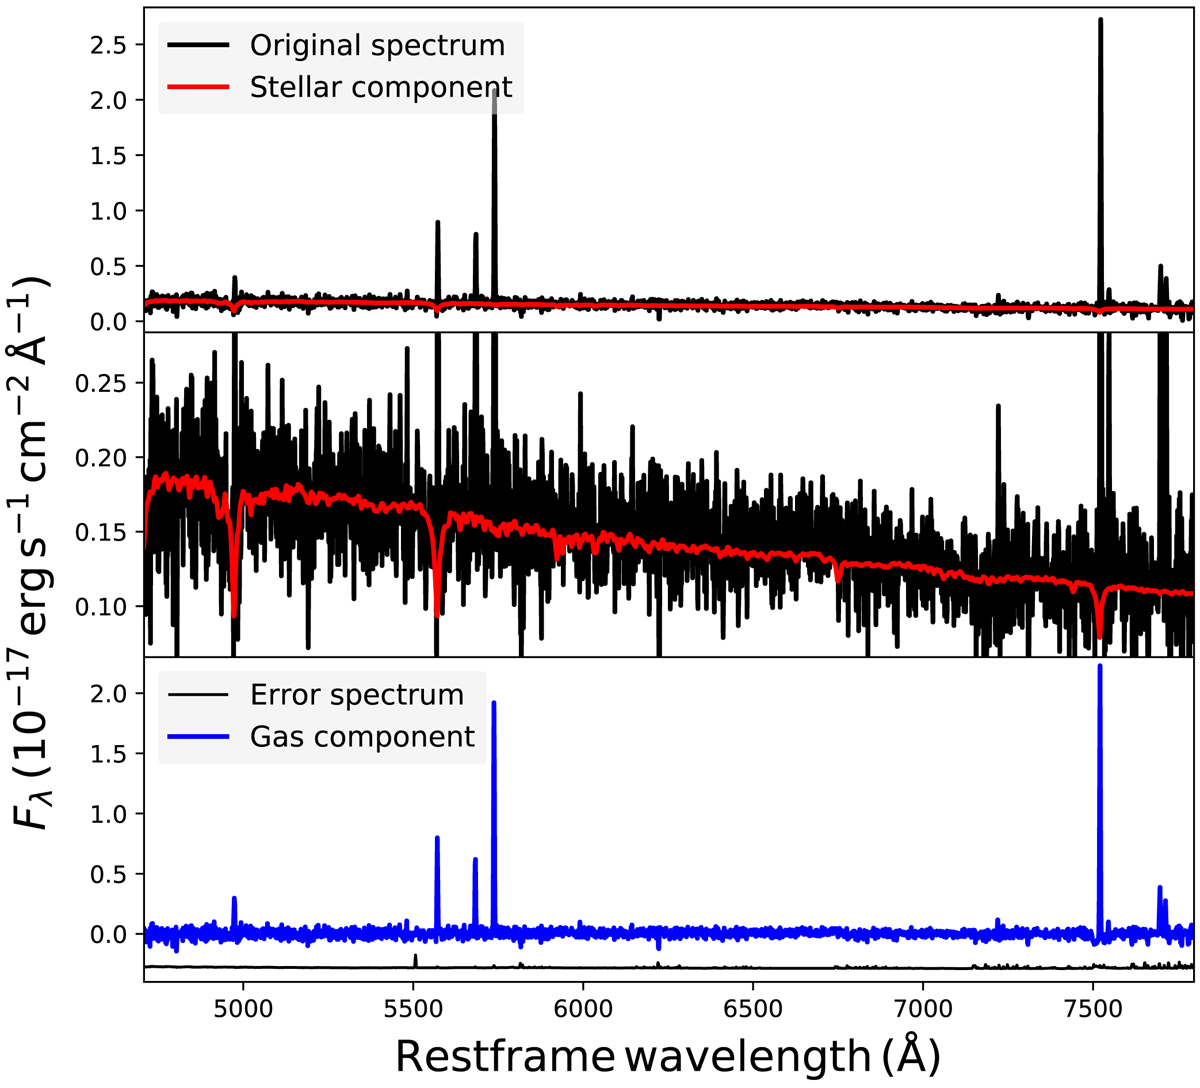
Example spectrum extracted from a spaxel in the central region of the host galaxy of GRB 050709, illustrating the separation of the stellar and gas-phase components. Top: original spectrum containing stellar and ionized gas emission (black) and the model stellar fit (red). Middle: zoom-in of the continuum shown in the top panel. Bottom: spectrum of the gas-phase-only component (blue) together with the error spectrum (black).
Current usage metrics show cumulative count of Article Views (full-text article views including HTML views, PDF and ePub downloads, according to the available data) and Abstracts Views on Vision4Press platform.
Data correspond to usage on the plateform after 2015. The current usage metrics is available 48-96 hours after online publication and is updated daily on week days.
Initial download of the metrics may take a while.