Fig. 9.
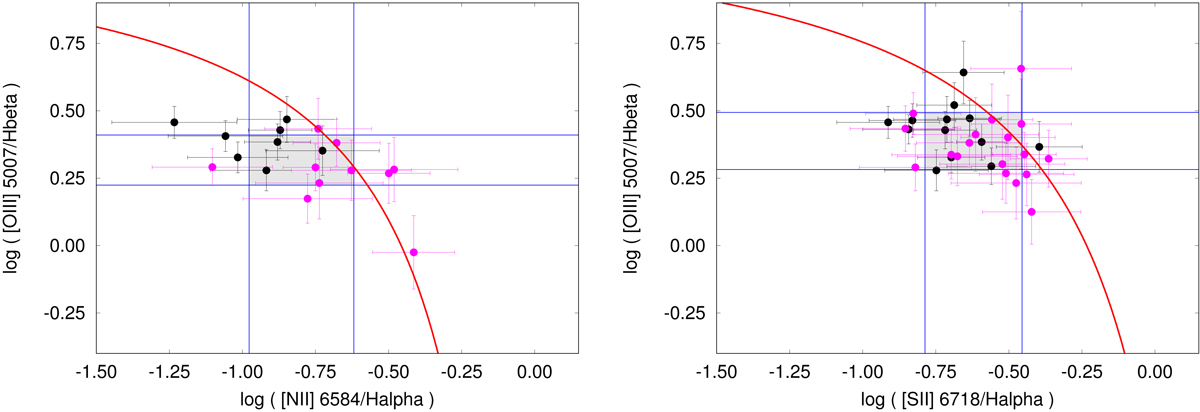
Emission-line BPT diagnostic diagrams of the host of GRB 050709. Left: diagnostic diagram using [NII]. Shown are the corresponding values for all individual spaxels as well as their mean value with the 1σ error bars (gray box). Black data points refer to spaxels that lie inside region B, and red data points lie outside this region. The red line shows the pure star-formation demarcation line for the redshift of the galaxy (Kewley et al. 2013, their Eq. (1)). Data points above this line cannot be reproduced by pure star-formation models. Right: same as the left panel but using [SII] (Kewley et al. 2001 and Kewley et al. 2006; their Eqs. (6) and (2), respectively.)
Current usage metrics show cumulative count of Article Views (full-text article views including HTML views, PDF and ePub downloads, according to the available data) and Abstracts Views on Vision4Press platform.
Data correspond to usage on the plateform after 2015. The current usage metrics is available 48-96 hours after online publication and is updated daily on week days.
Initial download of the metrics may take a while.