| Issue |
A&A
Volume 649, May 2021
|
|
|---|---|---|
| Article Number | A148 | |
| Number of page(s) | 9 | |
| Section | Interstellar and circumstellar matter | |
| DOI | https://doi.org/10.1051/0004-6361/202140671 | |
| Published online | 28 May 2021 | |
Influence of the nano-grain depletion in photon-dominated regions
Application to the gas physics and chemistry in the Horsehead
1
Université Paris-Saclay, CNRS, Institut d’astrophysique spatiale,
91405
Orsay,
France
e-mail: This email address is being protected from spambots. You need JavaScript enabled to view it.
2
LERMA, Observatoire de Paris, PSL Research University, CNRS, Sorbonne Universités,
92190
Meudon,
France
Received:
26
February
2021
Accepted:
12
April
2021
Abstract
Context. The large disparity in physical conditions from the diffuse interstellar medium (ISM) to denser clouds such as photon-dominated regions (PDRs) triggers an evolution of the dust properties (i.e. composition, size, and shape). The gas physics and chemistry are tightly connected to these dust properties and are therefore affected by dust evolution and especially the nano-grain depletion in the outer irradiated part of PDRs.
Aims. We highlight the influence of nano-grain depletion on the gas physics and chemistry in the Horsehead nebula, a prototypical PDR.
Methods. We used a model for atomic and molecular gas in PDRs, the Meudon PDR code, using diffuse ISM-like dust and Horsehead-like dust to study the influence of nano-grain depletion on the gas physics and chemistry, focusing on the impact on photoelectric heating and H2 formation and, therefore, on the H2 gas lines.
Results. We find that nano-grain depletion in the Horsehead strongly affects gas heating through the photoelectric effect and thus the gas temperature and the H2 formation, hence the H → H2 position. Consequently, the first four pure rotational lines of H2 (e.g. 0–0 S(0), S(1), S(2), and S(3)) vary by a factor of 2 to 14. The 0–0 S(3) line that is often underestimated in models is underestimated even more when taking nano-grain depletion into account due to the decrease in gas heating through the photoelectric effect. This strongly suggests that our understanding of the excitation of H2 and/or of heating processes in the Horsehead, and more generally in PDRs, is still incomplete.
Conclusions. Nano-grain depletion in the outer part of the Horsehead has a strong influence on several gas tracers that will be prominent in JWST observations of irradiated clouds. We therefore need to take this depletion into account in order to improve our understanding of the Horsehead, and more generally PDRs, and to contribute to the optimal scientific return of the mission.
Key words: photon-dominated region (PDR) / planetary nebulae: individual: Horsehead / dust, extinction / evolution / ISM: lines and bands
© T. Schirmer et al. 2021
 Open Access article, published by EDP Sciences, under the terms of the Creative Commons Attribution License (https://creativecommons.org/licenses/by/4.0), which permits unrestricted use, distribution, and reproduction in any medium, provided the original work is properly cited.
1 Introduction
Interstellar dust plays an important role in numerous physical and chemical processes in the interstellar medium (ISM) and most particularly in photon-dominated regions (PDRs). In the outer irradiated part of PDRs, gas heating is mainly due to the photoelectric effect on dust grains (e.g. Bakes & Tielens 1994) and the formation of molecular hydrogen H2 (e.g. Le Bourlot et al. 2012; Bron 2014; Jones & Habart 2015) happens on dust surfaces. The efficiency of these processes strongly depends on the dust physical properties (size, composition, and shape) and must therefore be constrained to understand PDR observations, such as the H2 gas lines.
With the aim of modelling PDRs, several models have been developed (see Röllig et al. 2007, for a comparative study of these codes), mostly using grains with properties similar to those of the diffuse ISM (e.g. Mathis et al. 1977; Weingartner & Draine 2001a; Draine & Li 2007; Compiègne et al. 2011; Jones et al. 2013). However, it has been shown that dust evolves from diffuse to dense regions (e.g. Flagey et al. 2009; Ysard et al. 2013, 2016; Juvela et al. 2020; Saajasto et al. 2021) and most specifically in PDRs (e.g. Berné et al. 2007; Abergel et al. 2010; Pilleri et al. 2012; Arab et al. 2012; Van De Putte et al. 2019; Schirmer et al. 2020). Based on the Spitzer and Herschel observation together with the THEMIS dust model (Jones et al. 2013, 2017) and the radiative transfer code SOC (Juvela 2019), Schirmer et al. (2020) constrained the dust properties in the Horsehead nebula. They found that in the outer irradiated part of the Horsehead (i.e. below a maximum depth of 0.05 pc from the edge, where H2 and nano-grains emit), the nano-grain dust-to-gas ratio is 6–10 times lower and the minimum size of these grains is 2–2.25 times larger than in the diffuse ISM. In the inner part of the Horsehead, they found that grains most likely consist of multi-compositional mantled aggregates. Thus, the efficiency of physical and chemical processes in PDRs is affected. Using the Meudon PDR code (Le Petit et al. 2006), Goicoechea & Le Bourlot (2007) showed that grain growth with depth inside a PDR affects the penetration of the UV flux and therefore the physical and chemical structures inside this region. However, they did not study the influence of grain growth on the efficiency of specific physical and chemical mechanisms such as heating through the photoelectric effect on dust or the H2 formation. In this paper, we propose a complementary study.
We show the influence of the nano-grain depletion in the outer irradiated part of the Horsehead (Schirmer et al. 2020) on the physics and chemistry of this region using the Meudon PDR code (Le Petit et al. 2006). The paper is organised as follows. In Sect. 2, we present the Meudon PDR code. We also describe how we tuned the dust model in the Meudon PDR code in order to reproduce the observed nano-grain depletion in the Horsehead using the THEMIS dust model (Jones et al. 2013, 2017). In Sect. 3, we present the influence of nano-grain depletion on the gas temperature, the H → H2 transition, and several H2 gas tracers. Finally, we summarise and conclude in Sect. 4.
2 Models and tools
In order to study the influence of nano-grain depletion on the gas physics and chemistry in the outer irradiated region of the Horsehead, we used a model for atomic and molecular gas in PDRs, the Meudon PDR code. First, we present this model. Second, we describe how we tuned the dust parameters to reproduce, at first order, the observed nano-grain depletion in the Horsehead.
2.1 The Meudon PDR code
The Meudon PDR code1 (Le Petit et al. 2006) is a model for atomic and molecular gas in irradiated interstellar clouds. It uses a 1D parallel plane geometry in aid of a thorough description of the physical and chemical processes at work inside PDRs. Up to 234 species are included and involved in a chemical network that is described in the chemistry file2 provided with the code. The dust model used in this code is based on an MRN distribution (Mathis et al. 1977) for graphites and silicates with a possibility to add a log-normal distribution of PAHs as in Draine & Li (2007) (see Fig. 1). The description of these grains is important as they are involved in (i) the radiative transfer through their extinction (Goicoechea & Le Bourlot 2007); (ii) the chemistry of H2 and other species by way of their catalyst role (Le Bourlot et al. 2012; Bron et al. 2014); and (iii) the thermal balance with both the photoelectric effect (Bakes & Tielens 1994; Weingartner & Draine 2001b) and the gas-grain coupling.
2.2 Parametrisation of nano-grain depletion in the Horsehead with the Meudon PDR code
Based on Herschel and Spitzer observations of the Horsehead together with the THEMIS3 dust model (Jones et al. 2013, 2017), Schirmer et al. (2020) show a strong depletion of nano-grains in the irradiated outer part of this PDR. The nano-grain dust-to-gas ratio is 6–10 times lower and the minimum size of these grains is 2–2.25 times larger than in the diffuse ISM.
In order to explore, qualitatively, the effects of this nano-grain depletion on the gas using the Meudon PDR code, we needed to tune parameters of the dust model used in the Meudon PDR code with the aim of consistently reproducing the grain depletion within the THEMIS framework. To this end, we tuned the parameter qPAH which corresponds to the PAH-to-dust mass ratio. This parameter is equivalent to the parameter qAF (see Galliano et al. 2021) which is the mass fraction of aromatic-feature-carrying grains in THEMIS, which are the small a-C(:H) grains in Fig. 1. In the diffuse ISM, qPAH = 4.6% (see Draine & Li 2007), whereas qAF = 17% (see Galliano et al. 2021). This difference can be explained because the THEMIS model does not contain PAHs, but a-C(:H) material that is composed ofless aromatic bonds per dust mass than PAHs. It is therefore necessary to consider a higher mass of a-C(:H) to reproduce the same aromatic emission as with PAHs. As dust evolves in the ISM, these two ratios evolve as well and are linked by the following relation:
 (1)
(1)
Figure 2 shows qAF as a function of both the nano-grain dust-to-gas ratio Ma-C/MH and the nano-grain minimum size amin, a-C. First and foremost, qAF decreases from 17% in the diffuse-ISM to ~ 2% in the Horsehead. We also note that qAF barely changes with amin, a-C as an increase in this parameter implies a redistribution of the nano-grain mass towards larger nano-grains (see Fig. 4 in Schirmer et al. 2020) that are mostly smaller than 1.5 nm. From now onwards, a decrease in qAF is equivalent to an increase in the depletion of nano-grains and we assume two values of reference that are qAF = 17 % in the diffuse ISM and qAF = 2 % in the outer irradiated part of the Horsehead.
As it is not currently possible to use dust properties varying with AV in the MeudonPDR code, we only focus on a smaller region of the outer irradiated part of the Horsehead (i.e. below a maximum depth of 0.025 pc from the edge), where there are no aggregates. This region corresponds to where the H → H2 transition happens and where most of the H2 lines emit. For the sake of simplicity, we used the same extinction curve regardless of qAF (and therefore a constant RV = 3.1). This means that we did not take the influence of the nano-grain depletion on the radiative transfer into account. This assumption is discussed further in Sect. 3.5.
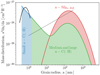 |
Fig. 1 Mass distribution for small a-C(:H) in blue, medium and large a-C(:H) in green, and silicate grains in red. These sub-components composed the THEMIS dust model for the diffuse ISM. The PAH mass distribution used in the Meudon PDR code is shown with a black line. The MRN distribution of graphite and silicates (70% graphite and30% silicate) used in the Meudon PDR code is shown with a dotted line. |
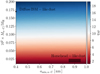 |
Fig. 2 Mass fraction qAF of aromatic-feature-carrying grains in THEMIS as a function of the nano-grain dust-to-gas ratio Ma-C /MH and the nano-grain minimum size amin, a-C. The grey dot corresponds to the dust properties of the diffuse ISM-like dust (Ma-C /MH = 0.17 × 10⁻² and amin, a-C = 0.4 nm). The grey rectangle corresponds to the dust properties in the irradiated outer part of the Horsehead. |
3 Results
We now present the results of our gas modelling in the Horsehead using the Meudon PDR code for different values of qAF. Firstly, we describe how we modelled the Horsehead with the Meudon PDR code (see Sect. 3.1); and secondly, we present the influence of dust evolution through the parameter qAF on the gas temperature (see Sect. 3.2), the chemistry (see Sect. 3.3), and gas tracers (see Sect. 3.4).
3.1 Horsehead modelling
As it is possible to use a density profile in the Meudon PDR code and with the aim of being consistent with the study of Schirmer et al. (2020), we used the same density profile described in Habart et al. (2005) and the same radiation field whose intensity is about G0 ~ 100. The other parameters are defined in Table 1. One may note that the standard ionisation rate ζ in the Meudon PDR code is 1 × 10⁻¹⁷ s−1, albeit Rimmer et al. (2012) found a cosmic ray ionisation rate of 5 × 10⁻¹⁵ s−1 in the Horsehead. However, we show (see Appendix A) that variations in ζ from 1 × 10⁻¹⁷ s−1 s−1 to 5 × 10⁻¹⁵ s−1 result in changes in the H2 gas tracers of the order of less than one percent. Our results are therefore unaffected by variations in ζ and we set this rate to 1 × 10⁻¹⁷ s−1. From this point onwards, we focus on a smaller region of the outer irradiated part of the Horsehead where the H → H2 transition happens and where most of the H2 gas tracers emit (i.e. d < 0.03 or d < 2.25′′, see Fig. 3 top panel). In order to study the influence of dust evolution on the gas physics and chemistry, we modified the parameter qPAH from 0% to 6% (qAF varying from 0% to 22%, see Eq. (1)) on a linear grid composed of 35 points.
3.2 Thermal balance
Figure 3 (top panel) shows the gas temperature across the Horsehead for qAF varying from 0% to 22%, as well as both the position of the H → H2 transition and the position of the maximum of several H2 lines (0–0 S(0), S(1), S(2), and 1–0 S(1)). The density at the H → H2 transition is about 4–7 × 10³ H cm−3 and Tgas = 3–4 × 10² K, hence the thermal pressure4 is about Pth = 1.2–2.8 × 10⁶ K cm−3. In addition, Joblin et al. (2018) find the following relation between the thermal pressure and G0 in PDRs: Pth ∕G0 = 5 × 10³–8 × 10⁴ K cm−3, which when applied to the Horsehead provides us with the following range of expected thermal pressure Pth = 5 × 10⁵–8 × 10⁶ K cm−3. Our model is therefore consistent with Joblin et al. (2018).
Regardless of the depth inside the Horsehead, the gas temperature decreases with qAF from a factor of 1.5–3 (see Fig. 3, bottom panel) when using Horsehead-like dust (i.e. qAF = 2%) instead of diffuse ISM-like dust (i.e. qAF = 17%). These variations in the gas temperaturewith qAF are due to variations in the gas total heating with qAF (see Fig. 4, panel a). Furthermore, the gas heating through the photoelectric effect on dust contributes at least to 80% of the total gas heating, hence we can consider that dust heating in the outer irradiated part of the Horsehead is dominated by this process (see Fig. 4, panel b). As Bakes & Tielens (1994) showed that the photoelectric effect is only efficient on nano-grains and because a decrease in qAF implies a decrease in this grain population, the heating via the photoelectric effect on dust grains decreases as well and therefore explains the decrease in the gas temperature with qAF.
Even if the other gas heating processes are marginal compared to the photoelectric effect on dust, the heating through the H2 formation can contribute up to 15% of the total gas heating (see Fig. 4, panel c) and up to 10% through the H2 collisional deexcitation (see Fig. 4, panel d). Regarding the gas heating due to the H2 formation, it increases with qAF because the H2 formation increases with qAF (see Fig. 7). As the UV radiation field is high at the Horsehead edge, H2 is efficiently pumped by external UV radiation. This process is usually followed by collisional deexcitations that can heat the gas. However, a density of about 103 H cm−3 (Hollenbach & Tielens 1999) must be reached to efficiently heat the gas through this process. In our PDR model, the density profile reaches this typical value where the UV radiation field is still high enough to efficiently pump H2 (i.e. before the H → H2 transition); however, since the density is not much higher than 103 H cm3 (nH < 2000 H cm3), the efficiency of the heating through H2 collisional deexcitations remains low.
PDR model parameters.
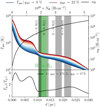 |
Fig. 3 Top: gas temperature across the PDR for qAF varying from 0% (blue line) to22% (red line). The density profile is shown with a black line. Bottom: ratio between the gas temperature across the PDR using the diffuse ISM-like dust (qAF = 17%) and the Horsehead-like dust (qAF = 2%). The green stripe corresponds to the position of the H → H2 transition (see Fig. 6) for qAF varying from 2% (Horsehead-like dust) to 17% (diffuse ISM-like dust). The four grey bands successively correspond to the position of the maximum emission of the H2 1–0 S(1) line (see Fig. B.4), the H2 0–0 S(1) line (see Fig. B.2), the H2 0–0 S(2) line (see Fig. B.3), and the H2 0–0 S(0) line (see Fig. B.1) for 2 ≤ qAF ≤ 17%. |
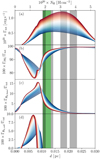 |
Fig. 4 Panel a: total gas heating rate across the PDR for qAF varying from 0% (blue line) to22% (red line). Panel b: contribution of the gas heating through the photo-electric effect on dust to the total gas heating. Panel c: contribution of the gas heating through the H2 formation to the total gas heating. Panel d: contribution of the gas heating through H2 collisional deexcitation to the total gas heating. The meaning of the green and grey stripes is explained in Fig. 3. |
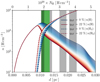 |
Fig. 5 Density of atomic hydrogen (solid line) and molecular hydrogen (dashed line) across the PDR for qAF varying from 0% (blue line) to22% (red line). The meaning of the green and grey stripes is explained in Fig. 3. |
3.3 Chemistry
Figure 5 shows the density of atomic and molecular hydrogen across the Horsehead for qAF varying from 0% to 22%. Regardless of qAF, the H2 abundance increases with depth inside the Horsehead until it exceeds that of atomic hydrogen H. As the UV flux decreases with depth inside the Horsehead because of dust extinction and H2 self-shielding, H2 photodissociation decreases as well together with an increase in the H2 formation (see Fig. 7), leading to an increase in the H2 abundance.
The position of the H → H2 transition also varies with qAF. Figure 6 shows the transition position as a function of qAF. A decrease in qAF implies a shift of the H → H2 towards theinner part of the Horsehead because such a decrease in qAF implies a decrease in the H2 formation rate. Indeed, Fig. 7 shows the H2 formation rate across the Horsehead for qAF varying from 0% to 22%. The molecular hydrogen H2 mainly forms on the grain surface (e.g. Hollenbach & Salpeter 1971) and is modelled in the Meudon PDR code through two different mechanisms (Le Bourlot et al. 2012) that are the following:
the Langmuir–Hinshelwood mechanism that consists of a physisorbed hydrogen atom that can migrate on the dust surface until it encounters another physisorbed hydrogen atom and therefore forms H2. For high dust temperatures (i.e. typically in the outer irradiated part of PDRs), large grains are too hot and the hydrogen atoms are thermally desorbed from the dust surface before forming H2. The efficiency of this process is therefore low in the outer irradiated part of PDRs. However, Bron et al. (2014) show that this mechanism can be efficient on nano-grains as they are stochastically heated and therefore can stay in the temperature range long enough, allowing H2 to form before the hydrogen atoms are thermally desorbed. When the hydrogen atoms are not thermally desorbed (i.e. when the temperatureis low enough) and in the same time when they can migrate (i.e. when the temperature is high enough), the efficiency of this mechanism only depends on the dust total surface;
the Eley–Rideal mechanism that consists of a chemisorbed hydrogen atom on the dust surface which is impinged by a hydrogen atom of the gas phase thereby forming H2. The efficiency of this mechanism is proportional on the dust total surface and sensitive to the gas temperature.
In the version of the Meudon PDR code we used, the H2 formation isdescribed by the formalism of Le Bourlot et al. (2012) and it does not contain the results of Bron et al. (2014). In our model, the Langmuir–Hinshelwood mechanism is therefore not efficient enough to form H2 in the outerpart of the Horsehead and it is marginal compared to the Eley–Rideal mechanism. The H2 formation is thus proportional to the gas temperature and the total dust surface. As both of these quantities decrease with qAF, the H2 formation decreases with qAF as well. We would have the same effect if the formalism of Bron et al. (2014) would have been included in the Meudon PDR code as the efficiency of the Langmuir Hinshelwood mechanism is proportional to the total dust surface. Also, regardless of qAF and the PDR depth, the H2 formation rate (see Fig. 7) is at least five times higher than the standard value for the diffuse ISM (Rf ≃ 3–4 × 10⁻¹⁷ cm3 s−1, see Gry et al. (2002)), which is what Habart et al. (2004) found from observations of H2 lines in moderately excited PDRs (G0 ≃ 102–103).
It is also interesting to note that the difference between the position of the H → H2 transition for qAF = 17% (i.e. using diffuse ISM-like dust) to qAF = 2% (i.e. using Horsehead-like dust) is in the range of the spatial resolution of the JWST instruments (~ 0.1′′ to ~ 1.2′′), depending on the wavelength of the observed line (see Table 2). Thus, the influence of the nano-grain depletion in the Horsehead on the position of the H → H2 transition should be observed with the JWST. One can note that the H → H2 transition also strongly depends on the density profile that must therefore be well constrained, which should be possible with the JWST.
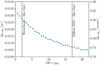 |
Fig. 6 Position of the H → H2 transition as a function of qAF. |
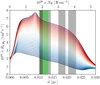 |
Fig. 7 Total H2 formation rate across the PDR for qAF varying from 0% (blue line) to22% (red line). The meaning of the green and grey stripes is explained in Fig. 3. |
Main H2 lines with the associated intensities and the JWST spatial resolution at these wavelengths.
3.4 H2 gas tracers
Variations in the gas temperature (see Sect. 3.2) and in the chemistry (see Sect. 3.3) affect the gas tracers. Figure 8 (left panel) shows the H2 line integrated5 intensities for qAF varying from 0% to 22%. We note that regardless of the considered line, the intensity of the first four pure rotational lines (e.g. 0–0 S(0), S(1), S(2), and S(3)) decreases with a decrease in qAF. These lines essentially result from collisional excitation and therefore mainly depend on the gas temperature. Thus, as a decrease in qAF implies a decrease in the gas temperature (see Sect. 3.2), these line intensities subsequently decrease with qAF.
The high rotational and ro-vibrational line 1–0 S(1) is essentially due to the decay of electronically states that are pumped through the absorption of FUV photons and the other pure rotational lines (e.g. 0–0 S(4), S(5), and up to S(9)) are essentially due to UV pumping (Habart et al. 2011). Moreover, the intensity of these lines is low compared to the first four pure rotational lines as the gas temperature is not high enough to pump them. Since there is not enough FUV and UV photons at the PDR depth of these lines and because this amount of photons barely depends on qAF, these lines do not vary with qAF. Decreases in the first four pure rotational lines with qAF are important: by a factor of ~2 for 0–0 S(0), a factor of ~4 for 0–0 S(1), a factor of ~14 for 0–0 S(2), and a factor of ~6 for 0–0 S(3) (see Fig. 8, right panel).
In the right panel of Fig. 8, we also compare the modelled and observed6 intensities of the first four pure rotational lines 0–0 S(0) to S(3) and the ro-vibrational line 1–0 S(1), after normalising the last line because it barely depends on qAF and thus on the nano-grain depletion. This normalisation is justified as the modelled intensity is usually multiplied by a factor of 1/ cos(θ) in order to take the geometry into account, which in the case of the Horsehead is 1/ cos(θ) ~ 6.66 (Habart et al. 2011). In our case, the normalisation of our two models requires two geometrical factors of 5.5 and 7.4, which are in agreement with the one used in Habart et al. (2011).
We find good agreement, with qAF = 2% for the 0–0 S(1) and 0–0 S(2) lines. The 0–0 S(3) line is underestimated by a factor of ~ 10, at least, which is not surprising as this line is rarely reproduced by PDR models (e.g. Habart et al. 2011), suggesting that understanding the excitation ofH2 and/or of heating processes in PDRs is still incomplete. The nano-grain depletion in PDRs is unfortunately going to decrease the gas temperature and, therefore, the 0–0 S(3) line.
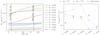 |
Fig. 8 Left: modelled integrated intensities (i.e. intensity integrated along a line-of-sight considering a face-on PDR) of H2 lines as a function of qAF. Right: modelled integrated intensities of H2 lines for qAF = 2% (red dots) and qAF = 17% (blue dots). Observed integrated intensity (the spectra are averaged in an area centred at the emission peak (see black boxes in Fig. 3 in Habart et al. 2011)) in the Horsehead with uncertainties (1σ) is shown by the green squares. Models have been scaled on the 1–0 S(1) H2 observed line. |
3.5 Influence of the dust extinction on the H2 gas tracers
The column density at 0.025 pc is about NH ~ 4.7 × 10²⁰ H cm−2, hence close but still below the critical value of NH ~ 5 × 10²⁰ H cm−2 above whichdust opacity becomes important (Hollenbach & Tielens 1999). This means that variations in the extinction in the outer irradiated part of the Horsehead barely affect the UV flux. Thus, the gas heating the gas temperature therefore barely depends on these variations. Regarding the chemistry, the position of the H → H2 transition is dominated by the H2 self-shielding if G0 /nH≲4 × 10−2 cm3 H−1 and by dust extinction, conversely (Hollenbach & Tielens 1999). In this study, the H → H2 transition occurs between 0.010 and 0.015 pc (see Fig. 6), where the density is between 2500 H cm−3 and 7000 H cm−3 and G0 /nH is thereforebetween 1.4 × 10⁻² cm3 H−1 and 4 × 10⁻² cm3 H−1. Thus, the position of the H → H2 transitiondoes not depend on the dust extinction, but on the H2 self-shielding only. Therefore, variations in dust properties that could affect radiative transfer in the outer irradiated part of the Horsehead are negligible and the physical and chemical processes discussed in this paper would barely be affected if we were to take the nano-grain depletion into account in the radiative transfer (i.e. RV that varies). Thus, our assumption on a constant RV is justified. One may note that if we had studied other mechanisms that occur in the denser part of the Horsehead such as the C+ → C → CO transition, this hypothesis would no longer have been valid to study this transition because, unlike the outer irradiated part of the Horsehead, variations in dust properties strongly affect the UV radiation field in the denser part of the Horsehead.
4 Summary and conclusion
We study the influence of nano-grain depletion observed in the outer irradiated region of the Horsehead on the gas physics and chemistry using the Meudon PDR code. As this PDR model does not include the THEMIS dust model that we used to highlight the nano-grain depletion, we had to tune the mass fraction of PAHs contained in the Meudon PDR code on a range that is, at first order, consistent with dust variations using THEMIS (i.e. the depletion of nano-grains is equivalent to a decrease in the mass fraction of PAHs, qPAH). We therefore calculated the value of qPAH that corresponds to the dust properties derived in the Horsehead which differ from the diffuse ISM. We show the following.
- 1.
Gas heating is dominated by the photoelectric effect on nano-grains in the outer irradiated part of the Horsehead and because this dust population decreases when moving from a model with diffuse ISM-like dust (case a) to a model with Horsehead-like dust (case b), the gas temperature decreases as well from a factor of 1.5 to 3.
- 2.
The first four pure rotational lines of H2 (e.g. 0–0 S(0), S(1), S(2), and S(3)) are very sensitive to a decrease in qAF as they are essentially excited through collisions and therefore depend on the gas temperature. The variations in these lines from case a to b range from a factor of 2 (for 0–0 S(0)) to a factor of 14 (0–0 S(2)).
- 3.
The H → H2 transition shifts towards the inner part of the Horsehead because the H2 formation decreases when moving from case a to case b.
- 4.
The decrease in H2 formation is due to the decrease in the total dust surface from case a to case b.
- 5.
The variation in the position of the H → H2 transition from case a to case b might be spatially resolved with the JWST, which was not the case with Spitzer.
- 6.
The H2 ro-vibrational line 1–0 S(1) is barely affected by variations in qAF and therefore by the nano-grain depletion.
Even though the nano-grain depletion in the outer irradiated part of PDRs has been evidenced by observations for many years, the influence of this depletion on the gas tracers in PDRs has never been studied in detail. In this study, we quantitatively explore the influence of this depletion with the Meudon PDR code. This code does not include the THEMIS model, but thanks to a justified approximation we can mimic the nano-grain depletion with the dust model included in the Meudon PDR code.
We show that this depletion has a strong influence on the physics and the gas in the Horsehead. Moreover, the first four pure rotational lines of H2 (e.g. 0–0 S(0), S(1), S(2), and S(3)) that are usually observed in PDRs can vary from a factor of 2–14. Also, the 0–0 S(3) line that is usually underestimated by models is underestimated even more with the nano-grain depletion due to the decrease in the heating through the photo-electric effect on dust grains. This clearly indicates that we need to consider another source of heating in the outer irradiated part of low excited PDRs such as the Horsehead. In order to go further, PDR models must include recent dust models that consider dust evolution from diffuse to dense regions. Given that current PDR models fail to fully explain the observed H2 line intensities, in future work it would be worth exploring the contribution that other mechanisms could make. For example, the Jones & Habart (2015) model proposes that the UV photon-processing of carbonaceous nano-particles forms H2 and that it may operate under conditions where classical H2 formation mechanisms are inhibited. The influence of this evolution on the gas tracers cannot be ignored if we want to advance our understanding of ISM physics and chemistry.
Acknowledgements
We thank the anonymous referee for very helpful suggestions and comments. We also thank Rachel Rudy, the language editor, for he correction. This work was supported by the Programme National “Physique et Chimie du Milieu Interstellaire” (PCMI) of CNRS/INSU with INC/INP co-funded by CEA and CNES. This work was also supported by the ≪P2IO LabEx (ANR-10-LABX-0038) ≫ in the framework “Investissements d’Avenir” (ANR-11-IDEX-0003-01) managed by the Agence Nationale de la Recherche (ANR), France.
Appendix A Influence of the cosmic ray ionisation rate on the H2 gas tracers
Here, we study the influence of the cosmic ray ionisation rate on the H2 gas tracers. Fig. A.1 shows the modelled integrated intensities of H2 lines for ζ varying from 10−17 s−1 to 10−15 s−1 using Horsehead-like dust (i.e. qAF = 2%) and Fig. A.2 shows the same thing but with diffuse ISM-like dust (i.e. qAF = 17%). Regardless of the dust used, the gas tracers barely vary (less than 1% of variations) with ζ, hence the cosmic rays do not influence the H2 gas tracers.
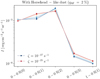 |
Fig. A.1 Modelled integrated intensities of H2 lines for ζ, varying from10−17 s−1 to 10−15 s−1 using Horsehead-like dust (i.e. qAF = 2%). |
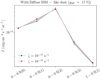 |
Fig. A.2 Modelled integrated intensities of H2 lines for ζ, varying from10−17 s−1 to 10−15 s−1 using diffuse ISM-like dust (i.e. qAF = 17%). |
Appendix B Number density of H2 for the different lines
Here, we show the number density of H2 for the different lines as a function of the depth inside the Horsehead for qAF varying from 0 to 22%.
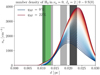 |
Fig. B.1 Number density of H2 in the state νu = 0 and Ju = 2 across the Horsehead. The meaning of the green and grey stripes is explained in Fig. 3. The darker grey stripe corresponds to the position of the maximum of this line for qAF varying from 2% to 17%. |
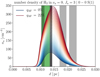 |
Fig. B.2 Number density of H2 in the state νu = 0 and Ju = 3 across the Horsehead. The meaning of the green and grey stripes is explained in Fig. 3. The darker grey stripe corresponds to the position of the maximum of this line for qAF varying from 2% to 17%. |
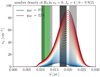 |
Fig. B.3 Number density of H2 in the state νu = 0 and Ju = 4 across the Horsehead. The meaning of the green and grey stripes is explained in Fig. 3. The darker grey stripe corresponds to the position of the maximum of this line for qAF varying from 2% to 17%. |
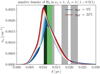 |
Fig. B.4 Number density of H2 in the state νu = 1 and Ju = 3 across the Horsehead. The meaning of the green and grey stripes is explained in Fig. 3. The darker grey stripe corresponds to the position of the maximum of this line for qAF varying from 2% to 17%. |
References
- Abergel, A., Arab, H., Compiègne, M., et al. 2010, A&A, 518, L96 [NASA ADS] [CrossRef] [EDP Sciences] [Google Scholar]
- Arab, H., Abergel, A., Habart, E., et al. 2012, A&A, 541, A19 [NASA ADS] [CrossRef] [EDP Sciences] [Google Scholar]
- Bakes, E. L. O., & Tielens, A. G. G. M. 1994, ApJ, 427, 822 [NASA ADS] [CrossRef] [Google Scholar]
- Berné, O., Joblin, C., Deville, Y., et al. 2007, A&A, 469, 575 [NASA ADS] [CrossRef] [EDP Sciences] [Google Scholar]
- Bron, E. 2014, PhD Thesis [Google Scholar]
- Bron, E., Le Bourlot, J., & Le Petit, F. 2014, A&A, 569, A100 [NASA ADS] [CrossRef] [EDP Sciences] [Google Scholar]
- Compiègne, M., Verstraete, L., Jones, A., et al. 2011, A&A, 525, A103 [NASA ADS] [CrossRef] [EDP Sciences] [Google Scholar]
- Draine, B. T., & Li, A. 2007, ApJ, 657, 810 [Google Scholar]
- Flagey, N., Noriega-Crespo, A., Boulanger, F., et al. 2009, ApJ, 701, 1450 [NASA ADS] [CrossRef] [Google Scholar]
- Galliano, F., Nersesian, A., Bianchi, S., et al. 2021, A&A, 649, A18 [EDP Sciences] [Google Scholar]
- Goicoechea, J. R., & Le Bourlot, J. 2007, A&A, 467, 1 [NASA ADS] [CrossRef] [EDP Sciences] [Google Scholar]
- Gry, C., Boulanger, F., Nehmé, C., et al. 2002, A&A, 391, 675 [NASA ADS] [CrossRef] [EDP Sciences] [Google Scholar]
- Habart, E., Boulanger, F., Verstraete, L., Walmsley, C. M., & Pineau des Forêts, G. 2004, A&A, 414, 531 [NASA ADS] [CrossRef] [EDP Sciences] [Google Scholar]
- Habart, E., Abergel, A., Walmsley, C. M., Teyssier, D., & Pety, J. 2005, A&A, 437, 177 [NASA ADS] [CrossRef] [EDP Sciences] [Google Scholar]
- Habart, E., Abergel, A., Boulanger, F., et al. 2011, A&A, 527, A122 [NASA ADS] [CrossRef] [EDP Sciences] [Google Scholar]
- Hollenbach, D., & Salpeter, E. E. 1971, ApJ, 163, 155 [NASA ADS] [CrossRef] [Google Scholar]
- Hollenbach, D. J., & Tielens, A. G. G. M. 1999, Rev. Mod. Phys., 71, 173 [Google Scholar]
- Joblin, C., Bron, E., Pinto, C., et al. 2018, A&A, 615, A129 [NASA ADS] [CrossRef] [EDP Sciences] [Google Scholar]
- Jones, A. P., & Habart, E. 2015, A&A, 581, A92 [NASA ADS] [CrossRef] [EDP Sciences] [Google Scholar]
- Jones, A. P., Fanciullo, L., Köhler, M., et al. 2013, A&A, 558, A62 [NASA ADS] [CrossRef] [EDP Sciences] [Google Scholar]
- Jones, A. P., Köhler, M., Ysard, N., Bocchio, M., & Verstraete, L. 2017, A&A, 602, A46 [NASA ADS] [CrossRef] [EDP Sciences] [Google Scholar]
- Juvela, M. 2019, A&A, 622, A79 [NASA ADS] [CrossRef] [EDP Sciences] [Google Scholar]
- Juvela, M., Neha, S., Mannfors, E., et al. 2020, A&A, 643, A132 [EDP Sciences] [Google Scholar]
- Le Bourlot, J., Le Petit, F., Pinto, C., Roueff, E., & Roy, F. 2012, A&A, 541, A76 [NASA ADS] [CrossRef] [EDP Sciences] [Google Scholar]
- Le Petit, F., Nehmé, C., Le Bourlot, J., & Roueff, E. 2006, ApJS, 164, 506 [NASA ADS] [CrossRef] [EDP Sciences] [Google Scholar]
- Mathis, J. S., Rumpl, W., & Nordsieck, K. H. 1977, ApJ, 217, 425 [NASA ADS] [CrossRef] [Google Scholar]
- Pilleri, P., Montillaud, J., Berné, O., & Joblin, C. 2012, A&A, 542, A69 [NASA ADS] [CrossRef] [EDP Sciences] [Google Scholar]
- Rimmer, P. B., Herbst, E., Morata, O., & Roueff, E. 2012, A&A, 537, A7 [NASA ADS] [CrossRef] [EDP Sciences] [Google Scholar]
- Röllig, M., Abel, N. P., Bell, T., et al. 2007, A&A, 467, 187 [NASA ADS] [CrossRef] [EDP Sciences] [Google Scholar]
- Saajasto, M., Juvela, M., Lefevre, C., Pagani, L., & Ysard, N. 2021, A&A, 647, A109 [EDP Sciences] [Google Scholar]
- Schirmer, T., Abergel, A., Verstraete, L., et al. 2020, A&A, 639, A144 [CrossRef] [EDP Sciences] [Google Scholar]
- Van De Putte, D., Gordon, K. D., Roman-Duval, J., et al. 2019, ApJ, 888, 22 [CrossRef] [Google Scholar]
- Weingartner, J. C., & Draine, B. T. 2001a, ApJ, 548, 296 [Google Scholar]
- Weingartner, J. C., & Draine, B. T. 2001b, ApJS, 134, 263 [NASA ADS] [CrossRef] [MathSciNet] [Google Scholar]
- Ysard, N., Abergel, A., Ristorcelli, I., et al. 2013, A&A, 559, A133 [NASA ADS] [CrossRef] [EDP Sciences] [Google Scholar]
- Ysard, N., Köhler, M., Jones, A., et al. 2016, A&A, 588, A44 [NASA ADS] [CrossRef] [EDP Sciences] [Google Scholar]
The Meudon PDR code is available here: ism.obspm.fr
We use the version 1.5.4: https://ism.obspm.fr/pdr_download.html
THEMIS is available here: https://www.ias.u-psud.fr/themis/
Pth = nH × Tgas.
The Meudon PDR code provides us with the integrated intensity along a line-of-sight across a PDR seen face-on.
The spectra are averaged in an area centred at the emission peak (see black boxes in Fig. 3 in Habart et al. 2011).
All Tables
Main H2 lines with the associated intensities and the JWST spatial resolution at these wavelengths.
All Figures
|
Fig. 1 Mass distribution for small a-C(:H) in blue, medium and large a-C(:H) in green, and silicate grains in red. These sub-components composed the THEMIS dust model for the diffuse ISM. The PAH mass distribution used in the Meudon PDR code is shown with a black line. The MRN distribution of graphite and silicates (70% graphite and30% silicate) used in the Meudon PDR code is shown with a dotted line. |
| In the text | |
|
Fig. 2 Mass fraction qAF of aromatic-feature-carrying grains in THEMIS as a function of the nano-grain dust-to-gas ratio Ma-C /MH and the nano-grain minimum size amin, a-C. The grey dot corresponds to the dust properties of the diffuse ISM-like dust (Ma-C /MH = 0.17 × 10⁻² and amin, a-C = 0.4 nm). The grey rectangle corresponds to the dust properties in the irradiated outer part of the Horsehead. |
| In the text | |
|
Fig. 3 Top: gas temperature across the PDR for qAF varying from 0% (blue line) to22% (red line). The density profile is shown with a black line. Bottom: ratio between the gas temperature across the PDR using the diffuse ISM-like dust (qAF = 17%) and the Horsehead-like dust (qAF = 2%). The green stripe corresponds to the position of the H → H2 transition (see Fig. 6) for qAF varying from 2% (Horsehead-like dust) to 17% (diffuse ISM-like dust). The four grey bands successively correspond to the position of the maximum emission of the H2 1–0 S(1) line (see Fig. B.4), the H2 0–0 S(1) line (see Fig. B.2), the H2 0–0 S(2) line (see Fig. B.3), and the H2 0–0 S(0) line (see Fig. B.1) for 2 ≤ qAF ≤ 17%. |
| In the text | |
|
Fig. 4 Panel a: total gas heating rate across the PDR for qAF varying from 0% (blue line) to22% (red line). Panel b: contribution of the gas heating through the photo-electric effect on dust to the total gas heating. Panel c: contribution of the gas heating through the H2 formation to the total gas heating. Panel d: contribution of the gas heating through H2 collisional deexcitation to the total gas heating. The meaning of the green and grey stripes is explained in Fig. 3. |
| In the text | |
|
Fig. 5 Density of atomic hydrogen (solid line) and molecular hydrogen (dashed line) across the PDR for qAF varying from 0% (blue line) to22% (red line). The meaning of the green and grey stripes is explained in Fig. 3. |
| In the text | |
|
Fig. 6 Position of the H → H2 transition as a function of qAF. |
| In the text | |
|
Fig. 7 Total H2 formation rate across the PDR for qAF varying from 0% (blue line) to22% (red line). The meaning of the green and grey stripes is explained in Fig. 3. |
| In the text | |
|
Fig. 8 Left: modelled integrated intensities (i.e. intensity integrated along a line-of-sight considering a face-on PDR) of H2 lines as a function of qAF. Right: modelled integrated intensities of H2 lines for qAF = 2% (red dots) and qAF = 17% (blue dots). Observed integrated intensity (the spectra are averaged in an area centred at the emission peak (see black boxes in Fig. 3 in Habart et al. 2011)) in the Horsehead with uncertainties (1σ) is shown by the green squares. Models have been scaled on the 1–0 S(1) H2 observed line. |
| In the text | |
|
Fig. A.1 Modelled integrated intensities of H2 lines for ζ, varying from10−17 s−1 to 10−15 s−1 using Horsehead-like dust (i.e. qAF = 2%). |
| In the text | |
|
Fig. A.2 Modelled integrated intensities of H2 lines for ζ, varying from10−17 s−1 to 10−15 s−1 using diffuse ISM-like dust (i.e. qAF = 17%). |
| In the text | |
|
Fig. B.1 Number density of H2 in the state νu = 0 and Ju = 2 across the Horsehead. The meaning of the green and grey stripes is explained in Fig. 3. The darker grey stripe corresponds to the position of the maximum of this line for qAF varying from 2% to 17%. |
| In the text | |
|
Fig. B.2 Number density of H2 in the state νu = 0 and Ju = 3 across the Horsehead. The meaning of the green and grey stripes is explained in Fig. 3. The darker grey stripe corresponds to the position of the maximum of this line for qAF varying from 2% to 17%. |
| In the text | |
|
Fig. B.3 Number density of H2 in the state νu = 0 and Ju = 4 across the Horsehead. The meaning of the green and grey stripes is explained in Fig. 3. The darker grey stripe corresponds to the position of the maximum of this line for qAF varying from 2% to 17%. |
| In the text | |
|
Fig. B.4 Number density of H2 in the state νu = 1 and Ju = 3 across the Horsehead. The meaning of the green and grey stripes is explained in Fig. 3. The darker grey stripe corresponds to the position of the maximum of this line for qAF varying from 2% to 17%. |
| In the text | |
Current usage metrics show cumulative count of Article Views (full-text article views including HTML views, PDF and ePub downloads, according to the available data) and Abstracts Views on Vision4Press platform.
Data correspond to usage on the plateform after 2015. The current usage metrics is available 48-96 hours after online publication and is updated daily on week days.
Initial download of the metrics may take a while.