| Issue |
A&A
Volume 671, March 2023
|
|
|---|---|---|
| Article Number | A41 | |
| Number of page(s) | 15 | |
| Section | Interstellar and circumstellar matter | |
| DOI | https://doi.org/10.1051/0004-6361/202244439 | |
| Published online | 06 March 2023 | |
OH mid-infrared emission as a diagnostic of H2O UV photodissociation
II. Application to interstellar photodissociation regions
1
Université Paris-Saclay, CNRS, Institut d’Astrophysique Spatiale,
91405
Orsay,
France
e-mail: This email address is being protected from spambots. You need JavaScript enabled to view it.
2
LERMA, Observatoire de Paris, PSL Research University, CNRS, Sorbonne Université,
92190
Meudon,
France
3
Leiden Observatory, Leiden University,
2300
RA Leiden,
The Netherlands
4
Max-Planck Institut für Extraterrestrische Physik (MPE),
Giessenbachstr. 1,
85748
Garching,
Germany
Received:
7
July
2022
Accepted:
17
October
2022
Abstract
Context. Water photodissociation in the 114–143 nm UV range forms excited OH which emits at mid-infrared (MIR) wavelengths via highly excited rotational lines. These lines have only been detected with Spitzer in proto-planetary disks and shocks. Previous studies have shown that they are a unique diagnostic for water photodissociation. Thanks to its high sensitivity and angular resolution, the James Webb Space Telescope (JWST) could be able to detect them in other environments such as interstellar photodissociation regions (PDRs).
Aims. Our goal is to predict OH MIR lines for a large range of thermal pressures and UV fields in PDRs.
Methods. We use the Meudon PDR Code to compute the thermal and chemical structure of PDRs. In order to predict the emerging spectrum of OH, we amended the code to include prompt emission induced by H2O photodissociation between 114 and 143 nm. We performed a detailed study of the influence of thermal pressure (Pth/k = nHTK) and UV field strength on the integrated intensities and their detectability with the JWST.
Results. OH MIR emission is predicted to originate very close to the H0/H2 transition and is directly proportional to the column density of water photodissociated in that layer. Because gas-phase neutral-neutral reactions forming water require relatively high temperatures (TK ≳ 300 K), the resulting OH MIR lines are primarily correlated with the temperature at this position, and are therefore brighter in regions with high pressure. This implies that these lines are predicted to be only detectable in strongly irradiated PDRs (G0incident > 103) with high thermal pressure (Pth/k ≳ 5x10⁷ K cm–3). In the latter case, OH MIR lines are less dependent on the strength of the incident UV field. The detection of such lines in PDRs such as the Orion bar – which should be possible – is also investigated and we show that the line-to-continuum ratio could be a major limitation for detection because of instrumental limitations.
Conclusions. OH MIR lines observable by JWST are a promising diagnostic for dense and strongly irradiated PDRs and proplyds. Their intensities are directly proportional to the amount of water photodissociated and they are therefore an indirect but sensitive probe of the gas temperature at the H0/H2 transition.
Key words: photon-dominated region / ISM: molecules / molecular processes / astrochemistry / stars: formation / infrared: ISM
© The Authors 2023
 Open Access article, published by EDP Sciences, under the terms of the Creative Commons Attribution License (https://creativecommons.org/licenses/by/4.0), which permits unrestricted use, distribution, and reproduction in any medium, provided the original work is properly cited.
This article is published in open access under the Subscribe to Open model. This email address is being protected from spambots. You need JavaScript enabled to view it. to support open access publication.
1 Introduction
Photodissociation regions (PDRs) are places where radiative feedback is dominant, with intense stellar far-ultraviolet (FUV) radiation playing a dominant role in the physics and chemistry (for a review, see e.g., Hollenbach & Tielens 1999; Wolfire et al. 2022). Stellar feedback is one of the major mechanisms that limit star formation (e.g., Inoguchi et al. 2020) by contributing to dispersal of the cloud due to gas heating and addition of angular momentum. Studying these regions is therefore essential in order to gain a better understanding of star formation and evolution of the interstellar matter. As a consequence of the intense UV field (up to a few 105 in units of the Mathis field corresponding to 1.9 × 10⁻³ erg s–1 cm–2, Mathis et al. 1983), PDRs act as a cradle of very active chemistry, which is even more enhanced in dense star forming regions (with densities of around nH ~ 106 cm–3). Moreover, emission from PDRs, which reprocess a significant part of the radiation energy emitted by young stars, dominates the infrared (IR) spectra from the galaxies in which they are located. It is therefore crucial to understand how the observed mid-infrared (MIR) emission is linked with physical conditions, and how these observations can constrain astrophysical environments.
The study of interstellar PDRs, such as the Orion Bar, NGC 7023, or the Horsehead nebula, is also important for understanding the still unknown UV-driven processes in other interstellar and circumstellar media. Observations and models of planetary nebulae indicate that a large fraction of the gas ejected by evolved stars goes through a PDR phase before being injected into the interstellar medium (ISM; Hollenbach & Natta 1995; Bernard-Salas & Tielens 2005). Infrared spectroscopy can provide information on the initial physical and chemical properties of the PDR phase (e.g., Bernard-Salas et al. 2009; Cox et al. 2016) and probe the photo-chemical evolution of molecules, nanoparticles, and grains. Dense and highly irradiated PDRs are also present in the FUV-illuminated surfaces of protoplanetary disks (e.g., Visser et al. 2007; Woitke et al. 2009). In summary, PDRs are present in a wide variety of environments and the interstellar PDRs represent a unique laboratory for use in studying UV-driven micro-processes.
Because of the layered structure with a strong variation of physical conditions across the PDR, a multi-wavelength study is needed to trace every zone. Emission lines with high upper-level energy from atomic ions (e.g., S+, Si+, Fe+, Kaufman et al. 2006) trace the ionization front. Ro-vibrational and pure rotational lines of H2 (e.g., Parmar et al. 1991; Luhman et al. 1994; van der Werfet al. 1996; Walmsley et al. 2000; Allers et al. 2005; Habart et al. 2005, 2011; Sheffer et al. 2011; Kaplan et al. 2017; Zhang et al. 2021) probe the H0/H2 dissociation front. Slightly further into the PDRs, the excited molecular gas is traced by rotationally excited lines from species such as CO (e.g., Stutzki & Guesten 1990; Tauber et al. 1994; Hogerheijde et al. 1995; Nagy et al. 2017; Joblin et al. 2018; Parikka et al. 2018), CH+, or OH (e.g., Goicoechea et al. 2011; Parikka et al. 2017). Key PDR signatures in the IR also include aromatic bands and dust continuum emission (e.g., Tielens 1993; Compiègne et al. 2011; Schirmer et al. 2020).
In order to spatially resolve the scale of FUV photon penetration (i.e., AV ~ 1) in dense molecular clouds, high-angular-resolution observations are needed. For instance, observations with the Atacama Large Millimeter/submillimeter Array (ALMA) with a spatial resolution of 1” reveal a very complex structure at the interface of the molecular cloud and the ionized gas for the highly illuminated Orion Bar PDR rather than a homogenous layered structure (Goicoechea et al. 2016). Moreover, recent near-infrared (NIR) Keck/NIRC2 observations with a resolution of ~0.1” resolved the substructures of this interface - especially at the H0/H2 transition - revealing several ridges and extremely sharp filaments (Habart et al. 2022). We observe a spatial coincidence between the H2 1–0 S(1) vibrational and HCO+ J = 4–3 rotational emission previously obtained with ALMA. This highlights the fact that in high-pressure PDRs, the H0/H2 and C+/C0/CO transition zones almost coincide and are closer than expected for a typical layered structure of a constant-density PDR. The need for angular resolution is even more important in order to resolve these two spatially close transitions.
Up to now, the spatial resolution attained in the MIR domain (by Spitzer, ISO, etc.) has been insufficient to resolve the sharp transition between hot ionized diffuse gas and cold molecular dense gas. The upcoming James Webb Space Telescope (JWST) observations will improve our understanding of these regions as this instrument will provide new data in the IR wavelengths between 0.6 and 28.8 μm. In particular, the MIRI instrument of the JWST, observing in the MIR, will combine high-angular-resolution maps (up to 0.2”) and IFU spectroscopy giving access to spatially resolved spectra at each pixel of the map; its high sensitivity will also enable the detection of numerous weak lines. Overall, the JWST observations will allow the warm and hot gas to be traced at small spatial scales, shedding new light on the FUV-driven chemistry and the physical conditions in these regions. In particular, a well-observed highly illuminated PDR, the Orion Bar, will be the target of an Early Release Science (ERS) program PDRs4All (1288) with the JWST (Berné et al. 2022) and a Guaranteed Time Observations (GTO) program “Physics and Chemistry of PDR Fronts” (1192) will focus on the Horsehead nebula and NGC-7023.
Among all the different lines in the MIR, the rotation-ally excited OH lines in the λ = 9–15 μm range appear the most promising diagnostic to unveil UV-driven processes in PDRs. Indeed, the incident UV field on the cloud leads to H2O photodissociation that produces mostly OH with various quantum states. Interestingly, when photodissociation is caused by short-wavelength photons (114 ≤ λ ≤ 143 nm, i.e., via the  state of H2O), OH is formed in highly rotationally excited states (~40000 K, corresponding to N > 35; van Harrevelt & van Hemert 2000). The subsequent de-excitation of these nascent OH products via a radiative cascade produces MIR lines, a process called “prompt emission”. Further modeling with a single-zone model shows that the line fluxes give unique access to the amount of water photodissociated per unit of time (Tabone et al. 2021). Therefore, in PDRs, MIR OH lines could be a unique diagnostic with which to constrain the physical conditions that affect the amount of water that is photodissociated there: typically the temperature at the H0/H2 transition. Although previous studies have derived H2O column densities using emission lines observed by Herschel (e.g., Choi et al. 2014; Putaud et al. 2019), those data mostly probe the cold regions of the PDR where H2O is very weakly photodissociated. Therefore, these latter results give access to different constraints from those provided by OH MIR emission. However, up to now, these rotationally excited lines of OH have only been detected with Spitzer in proto-planetary disks and strong protostellar shocks (e.g., Tappe et al. 2008, Tappe et al. 2012; Najita et al. 2010; Carr & Najita 2014). In PDRs and proplyds, only less excited FIR lines of OH (Eu/k ~ 100–300 K) – which are more likely to be excited by collisions – have been detected (e.g., Goicoechea et al. 2011; Parikka et al. 2018). Therefore, investigating the detectability and the potential of MIR lines of OH in PDRs requires the use of detailed modeling.
In this paper, we predict OH MIR line intensities in PDRs by computing the chemistry, thermal balance, and excitation of OH in a consistent way using the Meudon PDR code. We then study how the key physical parameters of a PDR – which in our modeling framework are the thermal pressure and the strength of the incident UV field – affect the intensities. The paper is organized as follows. In Sect. 2, we summarize the main ingredients of the Meudon PDR code and the updates made to model OH prompt emission. In Sect. 3, we present our main results for H2O and OH chemistry and the resulting MIR OH lines for a grid of models. In Sect. 4, our model is applied to the Orion Bar where we discuss their detectability with JWST, taking into account continuum, bands, and other lines. Finally, we discuss the detectability of MIR OH lines in other environments. Our findings are summarized in Sect. 5.
2 Models
2.1 Thermo-chemical model with the Meudon PDR Code
In this work, we computed H2O and OH density profiles and the local UV field intensity as a function of the depth into the PDR using the Meudon PDR code (version 1.5.41, Le Petit et al. 2006). The code simulates the thermal and chemical structure of the gas in a self-consistent manner, considering a 1D geometry and a stationary state in a plane-parallel irradiated gas and dust layer. This code takes the shape of the incident UV field as input. Here, we use the Mathis et al. (1983) prescription for the grid of models (see Sect. 3), and a radiation field representative of an O7 star for our application to the Orion Bar (see Sect. 4). The code includes the progressive attenuation of the UV field due to grain and gas extinction. In this work, we use a mean galactic extinction curve with the parameterization of Fitzpatrick & Massa (1988) for the grid of models (see Sect. 3) and a flatter extinction curve for the Orion Bar (see Sect. 4 for further details). The chemistry of the PDR is computed taking into account hundreds of species and thousands of chemical reactions. The excitation of the several key species is considered in the calculation of the thermal balance as the cooling relies on line emission. The photoelectric effect and thermal coupling between gas and dust are also taken into account in the thermal balance.
In this paper, we assume that the PDR is isobaric. This is an appropriate starting hypothesis given that several studies show that isobaric models reproduce the observed emission of warm molecular gas in interstellar PDRs such as the Horsehead, NGC-7023, and the Orion Bar (e.g., Habart et al. 2005; Allers et al. 2005; Joblin et al. 2018). However, magnetic and turbulence pressure may be important in PDRs (e.g., van Dishoeck & Black 1986; Pellegrini et al. 2009; Pabst et al. 2020) and the thermal pressure might not dominate. For instance, in the Orion Bar, the nonthermal turbulent pressure is of the same order as the gas thermal pressure (see Table 1 of Goicoechea et al. 2016). Consequently, the density and temperature gradients calculated in isobaric models may not fully fit the gas structure of a PDR. However, in order to estimate the emission of MIR OH lines and investigate how it varies with the excitation and physical conditions (i.e., temperature and density), this assumption is valid as a first approximation. This study is based on a grid of models with thermal pressure ranging from Pth/k = 105 to 109 K cm–3 (Pth/k = nHTK) and an intensity of the FUV field from  = 102 to 105 in units of the interstellar radiation field of Mathis et al. (1983). All the parameters fed into the models are summarized in Table 1. A fiducial model with Pth/k = 108 K cm–3 and
  = 104 (typical parameters of highly excited PDRs such as the Orion Bar) is adopted to present the results. In the following paragraphs, we review the micro-physical processes that are key for the modeling of the warm molecular layer where OH MIR emission originates.
In the Meudon PDR Code, the H2 rotational and rovibra-tional levels are calculated including collisional (de-)excitation with H (Wrathmall & Flower 2007), He, H2 (Flower & Roueff 1998, 1999) and H+, and UV radiative pumping of electronic lines followed by fluorescence. For our grid of models, we use the FGK approximation (Federman et al. 1979), which allows rapid computation for the UV radiative transfer involving self-shielding effects. The levels of H2 are also populated considering excitation due to formation on grain surfaces. For the formation on dust surfaces, we assume a Boltzmann distribution at a temperature of one-third of H2 dissociation energy (Black & van Dishoeck 1987). As the branching ratio of the distribution of H2 dissociation energy is unknown because it probably depends on conditions in the PDR and the nature of the grains, it is assumed that distribution follows an equipartition law. The two remaining thirds of H2 formation energy are distributed between grain excitation and the kinetic energy of released molecules.
The version of the code used in this paper includes an extensive chemical network. However, H2O molecule formation is computed only taking into account the gas-phase chemistry, and the formation on grains is neglected. As this study focuses on the photodissociation of water in warm regions, the only formation mechanism of interest here is gas-phase formation, so it does not affect the results. Chemical reaction rates are computed using thermal rate coefficients, except for the formation of CH+, SH+, OH, and H2O. For instance, a state-specific chemistry is included for the formation of OH and H2O as a result of reactions with H2 with an energy barrier (see further details in Sect. 3.1.1 with Eqs. (3) and (4)). This allows the internal energy of H2 to be considered in the rate coefficient and this energy may be used to overcome an activation barrier. Regarding the reaction OH + H2(υ, J), the state-specific chemistry is taken into account by replacing the activation energy by the difference between the activation energy and the ro-vibrational energy of H2 (e.g. Tielens & Hollenbach 1985a; Sternberg & Dalgarno 1995). This approach may not be fully accurate. However, the state-specific rate coefficients of the reaction OH + H2 (υ) are unknown except for υ = 1 (Zellner & Steinert 1981; Zhang & Zhang 1994; Truong 1995). This approximation gives coherent results with the state-specific rate coefficient determined in these latter studies. Moreover, when this approximation is not adopted and only the thermal rate coefficient is used, the abundance of H2O is reduced by a factor of three. We expect the true value of the abundance to be between these two limits. Therefore, this assumption is valid as a first approximation. Regarding the reaction O + H2, we amended the version of the Meudon PDR code used in this paper to include the H2(υ, J) state-specific rate coefficients recently computed by Veselinova et al. (2021). The H2O and OH photodissociation rates are consistently computed by integrating the cross section over the local radiation field using the compiled cross section from the Leiden database (Heays et al. 2017).
Input parameters of the Meudon PDR code.
2.2 Excitation of OH
The OH excitation was computed in concert with the chemistry and the thermal balance using the method of Gonzalez Garcia et al. (2008), which takes into account radiative pumping and collisional excitation, and allows us to include the formation of species in excited states. In order to include the impact of OH production in rotationally excited states, we assume that only H2O photodissociation in the 114–143 nm UV range leads to the production of OH with a nonthermal state distribution and that the destruction pathways are not state-specific; that is, the destruction rate of an OH molecule is independent of its state. Any other formation route but H2O photodissociation in the 114–143 nm range is assumed to produce OH with a thermal state distribution at the local temperature of the gas. Therefore, we neglected prompt emission of OH induced by water photodissociation at longer wavelength, which produces vibrationally hot but rotationally cold OH (van Harrevelt & van Hemert 2001), and chemical pumping by O+H2, which produces OH in lower rotational states N < 25 (Liu et al. 2000, and A. Zanchet, priv. comm.). These excitation processes do not impact the highly rotationally excited lines of OH in the 9–15 range, which are the focus of the present study (see discussion in Tabone et al. 2021).
These assumptions lead to the detailed balance equation:
 (1)
(1)
where ni [cm–3] is the local population density of OH at a given position in the PDR. Pij are the radiative and collisional transition probabilities and include the contribution of the line and dust emission to the local radiation field (see Gonzalez Garcia et al. 2008, for further details). We considered collisional (de-)excitation of OH with He and H2 using collisional rate coefficients of Kłos et al. (2007) and Offer et al. (1994), which have been further extrapolated to include collisional transitions between higher rotational levels of OH as in Tabone et al. (2021). F is the total formation rate of OH and fi(TK) is the Boltzmann distribution at a temperature Tk. Also, Fpd is the production rate of OH via H2O photodissociation in the 114–143 nm band [cm–3s–1] as defined by
 (2)
(2)
where σ(λ) is the photodissociation cross section of H2O, I(λ) is the local UV radiation field, and  is the local number density of H2O. Finally,
  in Eq. (1) is the state distribution of OH following H2O photodissociation. The exact distribution
  produced by water photodissociation in the 114–143 nm UV range depends relatively weakly on the shape of the local radiation field, and in this work we adopt the distribution produced by Lyman-a photons (λ = 121.6 nm) presented in Tabone et al. (2021).
Following Tabone et al. (2021), our OH model includes the list of energy levels and radiative transitions provided by Brooke et al. (2016). In order to reduce the computational time, the number of OH levels has been reduced to a total of 412 by limiting the vibrational quantum number to υ ≤ 1 and including only the OH(X) electronic ground state. All the rotational levels that are stable within a vibrational state are retained, which corresponds to N ≤ 50 and N ≤ 48 for υ = 0 and 1, respectively. In order to account for prompt emission induced by the production of OH in the levels that have been discarded, we use the reduced-state distribution  derived by Tabone et al. (in prep.). Each rotational level is further split by the spin orbit coupling and the Λ-doubling. Following Tabone et al. (2021), we consider intra-and cross-ladder rotational transitions in the υ = 0 and υ = 1 bands as well as between the υ = 1 and υ = 0 states, resulting in a total of 2360 (ro-)vibrational transitions.
3 Results
First, we present the results for our fiducial model, which corresponds to a high-pressure (Pth/k = 108 K cm–3) and strong incident UV field model  . This model is particularly interesting because these are parameters representative of a PDR for which OH MIR lines are the brightest. We then explore a grid of models to investigate how the line intensities vary with the pressure and incident UV field.
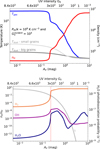 |
Fig. 1 Results of our fiducial model with Pth/k =108 K cm–3 and |

3.1 High-pressure and UV field fiducial model
3.1.1 H2O density profile and UV field
Figure 1 shows the total hydrogen density and gas temperature (top panel), and the H2O, OH, and H2 abundances (bottom panel) across the PDR. The H2O photodissociation rate is also displayed in the bottom panel. Because thermal pressure is assumed to be constant across the PDR, the gas gets denser as the temperature drops with depth. Until Av = 0.1, the thermal balance is dominated by heating by the photoelectric effect, and [OI] and [CII] radiative cooling. Then, at the H0/H2 transition (driven by dust opacity and self-shielding), the temperature decreases steeply as the gas is primarily cooled down by H2 emission and as the heating by photoelectric effect is less efficient due to the attenuation of the FUV field. Deeper into the PDR (Av > 1), the gas temperature smoothly decreases due to the cooling by CO, and eventually by gas-grain thermal coupling (Tielens & Hollenbach 1985a).
The H2O and OH abundance profile reflects that of H2 and of the temperature. Two peaks in H2O abundance, corresponding to two distinct reservoirs of water are highlighted in the bottom panel of Fig. 1. The first peak at Av ~ 0.5 in the warm and irradiated region is mainly due to neutral-neutral reactions (see Fig. 2). Here, H2O forms primarily via a two-step process with energy barriers (ΔE; van Dishoeck et al. 2013, see Appendix A.l):
 (3)
(3)
 (4)
(4)
As the first peak corresponds to an irradiated reservoir of H2O, OH prompt emission is expected to be confined to that layer. The position of the first H2O abundance peak is a compromise between being deep enough in the cloud to have relatively abundant molecular H2 (not photodissociated) necessary for the formation of water and being sufficiently close to the edge to have a temperature high enough to overcome the energy barrier of the chemical reaction. The peak is indeed located close to the H0/H2 transition, in agreement with the study of Sternberg & Dalgarno (1995, see their Figs. 8 and 9). Therefore, the peak abundance of H2O is highly sensitive to the temperature, as further shown in Sect. 3.2 and in Appendix A.2. Interestingly, in the warm region of interest, the inclusion of the enhanced reactivity of excited H2 in the formation of OH (and therefore H2O) does not drastically change the results obtained with calculations with the thermal rates. For example, at the H2O abundance peak, the formation rate of H2+O is only increased by a factor 2, compared to the formation rate calculated with the thermal rate which is rather low for these orders of magnitude. This is related to the relatively modest endoergicity of reaction O + H2 compared to hydrogénation reactions of N and S+ (e.g., Goicoechea & Roncero 2022). This lower endoergicity results in relatively high rate coefficients for the lower vibrational H2 states. In the warm region, OH is also primarily produced by neutral-neutral reactions (see Eq. (3) and Appendix B) with a significant contribution of H2O photodissociation at the peak of OH abundance. However, as explained in Sect. 3.1.2, only water photodissociation can lead to OH excited in highly rotational states. Thus, OH MIR emission depends on water abundance and not directly on OH abundance.
Deeper into the PDR (Av > 0.5), the H2O and OH abundances decrease drastically because the temperature is dropping and both molecules are still efficiently destroyed by photodissociation (see the H2O photodissociation rate in the bottom panel of Fig. 1). The second water reservoir peaks deeper into the cloud in colder regions, with a peak in H2O abundance at Av ≃ 7. In this region, H2O is primarily formed via ion–neutral reactions, ending with the electronic recombination of H3O+ :
 (5)
(5)
OH+ being formed by  in molecular regions (see Fig. 2 and Appendix A.2). Water is still primarily destroyed by photodissociation with an efficiency that decreases with depth into the PDR (see light gray in Fig. 1). Thus the H2O abundance increases again with Av. We note that deep into the cloud, H2O formation on grains followed by desorption (not included in our model) is expected to be relevant (Hollenbach et al. 2009; Putaud et al. 2019). However, this cold component is not of interest in the present study because it produces a negligible amount of highly excited OH. Indeed, although the cold reservoir is larger than the warm reservoir, it is so weakly irradiated that the amount of photodissociated water coming from this region is negligible in comparison to that coming from the warm region.
Interestingly, the amount of warm H2O (N(H2O)~4×l014cm–2) represents only 5–15% of the total H2O content of the PDR. This is in agreement with the results of Putaud et al. (2019), which suggest that the cold component dominates the emission of H2O in Herschel data. This explains why we cannot use these previous results to predict OH MIR emission, as we are only interested in the warm reservoir.
 |
Fig. 2 Percentage of the different formation routes of H2O as a function of the visual extinction for the model Pth/k= 108 K cm–3 and |

 |
Fig. 3 Intensities of OH MIR lines observed with a viewing angle of 60° as a function of wavelength for a model Pth/k= 108 K cm–3 and |

3.1.2 Prediction of OH MIR lines
Figure 3 presents the calculated MIR spectrum of OH for our fiducial model with a viewing angle of 60°. The viewing angle is the angle between the line of sight and the normal to the PDR, with 0° being face-on and 90° edge-on. The value of 60° is representative of the inclination of most of the observed interstellar PDRs, as they are closer to being edge-on than face-on (e.g., the Orion Bar and the Horsehead Nebula). A series of pure rotational lines can be seen in the 9–27 μm range coming from high-N states (15 ≤ N ≤ 45) with upper energies >5000K. These pure intra-ladder rotational lines, which are split into four components by Λ-doubling and spin-orbit coupling (not apparent in Fig. 3), dominate the MIR OH spectrum. There is a steep increase in line intensity with decreasing N shortward of λ =10 μm (N ≃ 35) and then a slow decrease longward of λ = 10 μm.
Figure 4 summarizes the excitation process leading to the observed prompt emission spectrum shown in Fig. 3. Infrared radiative pumping cannot excite these lines due to the high energy of the upper levels. De-excitation by stimulated emission by the IRbackground is also negligible because of the small photon occupation number. Collisional excitation cannot populate the upper levels due to their very high upper-energy level, and collisional de-excitation is negligible due to the very high critical densities of these levels  . Hence, the populations of the levels are only set by the radiative cascade following H2O photodissociation forming OH in high-N states.
In particular, we recover the result of Tabone et al. (2021), namely that the OH MIR line intensities are only proportional to the column density of water photodissociated in the  band (114 nm < λ < 143 nm):
 (6)
(6)
where we recall that Fpd is the (volumic) destruction rate of H2O via photodissociation in the 114–143 nm UVrange (see Eq. (2)). This simple result demonstrates that OH MIR lines give direct access to H2O photodissociation but no (direct) information on the column density of OH, the density, or the temperature. H2O abundance in irradiated media being highly sensitive to the physical conditions (in particular temperature), OH MIR lines are in turn an indirect but very sensitive diagnostics of the physical conditions.
We also recover that the overall shape of the MIR spectrum of OH neither depends on OH column density nor on the pho-todissociated column density of H2O Φb- Indeed, as discussed in Tabone et al. (2021), the relative intensity of the excited lines is only set by the distribution of nascent OH, which is set by the spectral shape of the UV field. However, in this work, we neglect the effect of the shape of the radiation field within the 114–143 nm range and we take the distribution of OH at Ly-α wavelength (121 nm) as a representative wavelength. Therefore, the intensity of each line shown here is, by construction, only proportional to Φb and does not depend on other parameters. In the following, we focus our study on the total intensity of the N = 30 → 29 quadruplet at 10.8 μm as it is the brightest of the spectrum.
In order to locate the emitting region of rotationally excited OH emission in the PDR, we calculate the cumulative intensity2 as a function of the PDR depth. Figure 5 compares the cumulative intensity of the 10.8 μm OH line and rotationally excited H2 lines across the PDR. First, this figure shows that OH emission is confined to a thin layer around Av ≃ 0.4 that corresponds to the H0/H2 transition. It can also be seen that this OH line peaks at the same position as the relatively excited H2 pure rotational lines such as 0–0 S(3) and 0–0 S(4). H2 rotational lines are excited by collision and so their emitting region reflects the temperature gradients across the PDRs. Thus, 0–0 S(3) (Eu/k ~ 2504 K) and 0–0 S(4) (Eu/k ~ 3474 K) peak closer to the edge than less excited lines such as 0–0 S(0) (Eu/k ~ 510 K), which has a lower upper energy level. The H2 1–0 S(1) line (Eu/k ~ 6952 K) is mainly populated by UV pumping. This explains why this line emission peaks closer to the edge at the H0/H2 transition.
We note that H2 rotational lines are a good diagnostic of the gas temperature as they are close to local thermodynamical equilibrium and are optically thin. However, this diagnostic needs high angular resolution to separate the emitting region of each lines; otherwise, the line fluxes are averaged on the PDR. The gas temperature profile can therefore only be measured with the H2 lines in close and sufficiently wide PDRs. In the cases where the observations are not spatially resolved, OH MIR lines can be a unique indirect diagnostic with which to probe temperature at the H0/H2 transition as OH MIR emission is strongly correlated to the thermal balance due to the need for high temperatures for the formation of H2O.
 |
Fig. 4 Schematic of the excitation of OH in the presence of prompt emission. The production of rotationally excited OH (orange arrows) is followed by a N → N – 1 radiative cascade (shown as blue arrows) emitting the series of lines shown in Fig. 3. For lower rotational states (N ≲ 10), OH levels can be excited by IR pumping and collisions that emit in the FIR. In this greatly simplified schematic, only a limited number of rotational levels are shown, ignoring the splitting of rotational levels caused by Λ-doubling and spin-orbit coupling, vibrational levels, and other kinds of weaker radiative transitions. |
 |
Fig. 5 Cumulative intensity (normalized) of the 10.8 μm OH line, and of several rotationnal and ro-vibrational lines of H2 calculated with the Meudon PDR code with a thermal pressure Pth/k = 108 K cm–3 and |

 |
Fig. 6 Summed intensity of the quadruplet at λ =10.8 μm observed with a viewing angle of 60° as a function of the gas pressure for different UV field intensities. The black horizontal lines represent the JWST sensitivity for a corresponding integration time and an S/N of 5. |
3.2 Effects of thermal pressure and UV field
As shown in Sect. 3.1.2, OH MIR emission is directly proportional to the amount of photodissociated water, water abundance being very sensitive to the temperature and the local UV field. Therefore, one would naturally expect a strong dependency of the OH line intensity on the thermal pressure and the strength of the incident UV radiation field. In this section, we study a grid of models with pressure ranging from Pth/k = 105 to 109 K cm–3 and incident UV field intensity in the range of  to 105.
Figure 6 summarizes the evolution of the 10.8 μm line intensity as a function of the thermal pressure for different UV field intensities. It can be seen that OH emission depends strongly on the thermal pressure (see Sect. 3.2.1 for further explanation). On the other hand, for UV field intensity  OH line intensities do not depend significantly on incident UV field intensity (see Sect. 3.2.2 for further explanation). To understand this result, we study the evolution of the temperature and UV field intensity at the warm peak of H2O as a function of the thermal pressure and the intensity of the UV field
  as presented in Fig. 7.
3.2.1 Dependence on pressure
Figure 7a displays the abundance profile of H2 O for different thermal pressures. It shows that we still recover a peak in H2O abundance down to Pth/k = 106 K cm–3, corresponding to the warm and irradiated reservoir of H2O that produces rota-tionally excited OH. As thermal pressure increases, the warm H2O reservoir moves closer to the edge and the corresponding peak abundance of H2O increases dramatically by six orders of magnitude from Pth/k = 106 to 109 K cm–3. This result might be surprising because at high pressure, the warm reservoir is more irradiated (see Fig. 7c, blue curve) and therefore H2O is more efficiently photodissociated. The density also increases with pressure, which directly enhances the formation rate of H2O in proportion. However, this effect is not enough to account for the dramatic increase in H2O abundance. In fact, as pressure increases, the gas at the H0/H2 transition gets warmer (see Fig. 7c, red curve), triggering active OH and H2O formation via neutral-neutral reactions. Therefore, the steep increase in H2O abundance with Pth/k is primarily due to the gas temperature rising. We still notice that the temperature increase is an indirect consequence of the increase in density and local UV field at the H0/H2 transition, because the H2 forms closer to the PDR edge at high densities, and heating by H2 UV pumping and H2 formation are enhanced.
The sensitivity of the formation route of H2O on temperature is further highlighted in Fig. 8, where the calculated abundance of H2 O is compared to our analytic model of oxygen chemistry detailed in Appendix A. We recover the fact that down to Pth/k ≃ 107 K cm–3, H2O is primarily formed by neutral–neutral reactions, and that the efficiency of this route declines for lower thermal pressures due to lower temperatures. Interestingly, at very low pressure, below Pth/k ≃ 106K cm–3, the ion-neutral reaction, which is weakly dependent on temperature, takes over from the neutral–neutral route. This roughly corresponds to the thermal pressure below which the peak in warm H2O abundance disappears.
We recall that MIR OH line intensities are proportional to the quantity of H2O that is photodissociated, which is the product of the H2O density profile and the UV field flux integrated over the cloud. This explains why OH MIR lines are found to increase with thermal pressure (see Fig. 6): H2O is more efficiently formed via neutral-neutral reactions in the warm molecular layer and, to a lesser extent, because that reservoir is more irradiated (see Figs. 7 and 8).
3.2.2 Dependence on incident UV field
Figure 7b displays the H2O abundance profile for different strengths of incident UV field and P/k = 108K cm–3. As the strength of the incident UV field increases, the warm H2O reservoir moves deeper into the cloud. The H0/H2 transition is indeed shifted to larger Ay because the total column density needs to be higher to trigger the H0/H2 transition. The H2O peak abundance is also somewhat reduced for stronger incident UV fields. This is due to both a slight decline in temperature, which quenches H2O formation by the neutral route, and an increase in the local radiation field at the H0/H2 transition (see Fig. 7d).
Based on these results, we come to the conclusion that MIR OH line intensities, which are proportional to the amount of photodissociated water, depend weakly on the incident UV field intensity for  . Indeed, as the incident UV field increases, the amount of H2O decreases slowly but the local radiation field increases accordingly. Both effects tend to act against each other for OH MIR emission, resulting in a weaker dependency on the incident UV field than on thermal pressure, at least for
  where the H2O abundance seems to saturate with increasing incident UV field.
3.2.3 Evolution of the OH/H2 line ratio
The predicted line intensities depend on the inclination of the PDR which is a major source of uncertainty in observations. Therefore, we present a more robust prediction in Fig. 9, namely the ratio between the 10.8 μm OH line and the 2.12 μm H2 ro-vibrational line, which peaks at a position close to that of OH and has already been observed at high angular resolution (e.g., Habart et al. 2022).
Figure 9 shows that the ratio is not constant and that over Pth/k ≥ 106 K cm–3, the ratio increases. The higher the pressure is, the higher the warm gas quantity. This fosters warm H2O formation by neutral-neutral reactions and thus fosters the formation of OH, which emits in the MIR. The H2 1–0 S(1) line increases with pressure as it is proportional to the gas density (for nH/G0 < 40 cm–3 e.g., Burton et al 1990) but it is not dependent on the gas temperature.
 |
Fig. 7 Evolution of H2O abundance, local gas temperature, and local UV field as a function of the thermal pressure and the incident UV field. Top panels: Abundance profile of H2O for different thermal pressures at a given UV field intensity (a) and for different incident UV fields at a given thermal pressure (b). Bottom panels: Evolution of the temperature and the UV field at the first H2O peak as a function of the thermal pressure (c) and the incident UV field intensity (d). |
4 Application to the Orion Bar and other environments
4.1 Orion Bar
The Early Release Science program “PDRs4All: radiative feedback from massive stars” (Berné et al. 2022) for the JWST observations is dedicated to studying the interactions of massive stars with their surroundings. The target of this program is a well-known PDR: the Orion Bar. This region will be observed through NIRSpec, NIRCam, and MIRI, providing IFU spec-troscopy with NIRSpec and MIRI, and imaging with NIRCam and MIRI. In this section, we use predictions for the Orion Bar to illustrate the potential of OH and discuss the main limitations of upcoming JWST observations of interstellar PDRs.
4.1.1 Predicted OH line intensities
The parameters used in the models of the Orion Bar are summarized in Table 2. We consider an isobaric model with a pressure ranging from Pth/k = 5×10⁷ K cm–3 to Pth/k = 5×10⁸ K cm–3, in agreement with previous studies (Allers et al. 2005; Joblin et al. 2018). We adopt an incident UV field coming from an illuminating O7 star with an effective temperature Teff = 40 000 K modeled by a blackbody at Teff.
The UV field intensity is taken equal to 2.104 in Mathis units which is in agreement with previous estimates giving  (Tielens & Hollenbach 1985b; Marconi et al. 1998). We assume the extinction curve HD 38087 of Fitzpatrick & Massa (1990) and Rv = 5.62, which is close to the value determined for the Orion Bar of 5.5 (Marconi et al. 1998). This extinction curve is also in agreement with the recent dust study by Schirmer et al. (2022) who worked with the THEMIS dust model in the Orion Bar with nano-grain depletion.
These models include an exact radiative-transfer calculation for the UV pumping of H2 lines originating from the first 30 levels of H2, while the other lines are treated using the FGK approximation (Federman et al. 1979). This allows mutual shielding effects between overlapping H2 and H UV absorption lines to be accounted for. This approximation can affect the position of the H0/H2 transition as the FGK approximation tends to shift the H°/H2 transition closer to the edge of the cloud, slightly affecting the abundance of H2O in the warm layer. However, the emerging line intensities of OH and H2 are little affected (less than 10%).
To estimate the absolute intensity of the OH MIR lines, we consider the ratio of the OH lines to the H2 1–0 S(l) line at 2.12 μm predicted by the model multiplied by the H2 1–0 S(l) line intensity recently measured by the Keck Telescope (Habart et al. 2022) at an angular resolution (0.1”) similar to that of the JWST. Indeed, OH and H2 lines originate from roughly the same region in the PDR (see Fig. 5) and so the intensity of these lines will be affected in the same way by geometry effects. Through the position of the JWST/NIRSpec–IFU and MIRI–IFU mosaics of the ERS program, the 1–0 S(l) line was measured at an intensity of 8.7×l0–4 erg cm–2 s–1 sr–1 at the dissociation front.
The H2 line intensity at 2.12 μm needs to be corrected for extinction due to the foreground dust and internal dust in the Bar itself. As discussed in Habart et al. (2022), the H2 line is expected to be about 56% brighter in total (16% for the foreground dust and 40% for the internal dust). This is in agreement with the total extinction correction derived by Kaplan et al. (2021). This leads to an extinction-corrected intensity of 1.4× 10⁻³ erg cm–2 s–1 sr–1. OH lines at longer wavelengths are mostly not affected by dust extinction. It is only at shorter wavelengths that dust extinction will significantly attenuate the emission. The different OH/H2 line ratios and the estimated OH line intensity are presented in Table 3.
The line sensitivity of MIRI MRS (medium-resolution spectroscopy) is about l×l0–6 erg cm–2 s–1 sr–1 for a S/N of 5 and an integration time of 111 s, which is granted for the ERS program. The intensities for lines around 10 μm are about l×l0–6 erg cm–2 s–1 sr–1 for the lower limit model at Pth/k = 5×l07K cm–3 and around lxl0–5 erg cm–2 S–1 sr–1 for the upper limit model at Pth/k = 5×l08 K cm–3 (see Table 3). Both lines might be detected for the upper limit model only considering the estimated intensities. However, it is also possible to stack different lines to increase the S/N and detect them even in the lower limit model. Nevertheless, the main limitation for detection of OH MIR lines in PDR is the small contrast between the strong continuum and the weak OH lines, as explained in the following section.
 |
Fig. 8 Analytic calculations of the first H2O peak abundance as a function of the temperature at the first H2O peak (Appendix A, using the thermal rate coefficient from Agúndez et al. 2010; Veselinova et al. 2021). The state-specific rate coefficients are not considered in the analytic calculations. Using the state-specific chemistry enhances the abundance of H2O by a factor 2. The dotted blue line represents the calculation of the abundance of H2O formed by ion-neutral reactions and the dashed red line represents the calculation of the abundance of H2O formed by neutral–neutral reactions. The triangles are the first H2O peak abundances calculated with the Meudon PDR code for models at incident UV field |

 |
Fig. 9 Ratio of the predicted OH line at 10.8 μm over the H2 line 1-0 S(l) at 2.12 μm predicted by the Meudon PDR Code. |
Input parameters of the Meudon PDR code for the Orion Bar model.
4.1.2 Predicted spectrum with continuum and other lines
To study the detectability of OH lines, we estimated the continuum and the other gas lines at the H°/H2 dissociation front where the OH line emission peaks. OH lines could blend with other lines but most importantly could be lost in the continuum noise due to instrumental defaults such as fringing. It is therefore necessary to have OH lines over the continuum greater than the noise expected on the continuum (predicted to be of the order of 1%). To estimate the dust continuum and other lines, we used the synthetic spectro-imaging cube from the ERS program. This cube was computed using the maps of five regions of the PDR and five template spectra of these regions3. The template spectra were determined using the PDR code for atomic and molecular line contributions (Le Petit et al. 2006); CLOUDY for the ionized gas (Ferland et al. 1998); the model PAHTAT for PAH emission (Pilleri et al. 2012) using the template spectra extracted by Foschino et al. (2019) on ISO-SWS data using machine learning algorithms; and finally the THEMIS dust model (Jones et al. 2013, 2017) with the radiative transfer code SOC (Juvela 2019) for the dust continuum emission following the approach of Schirmer et al. (2022). This dust model is based on Spitzer and Herschel observations in five photometric bands (3.6, 4.5, 5.8, 8, and 70 μm). Observations at 24 μm of the Orion Bar exist but are saturated. We compare the model to available observations, namely ISO/SWS observations centered on the PDR with a large beam (20”) and Spitzer-IRAC maps. Spitzer-IRS spectra are only available in the atomic region at the peak of the MIR dust continuum. The model accurately reproduces the Spitzer-IRAC observations at 3.6 and 8 μm. However, longward of 8 μm, the continuum in the synthetic spectrum is three times weaker than that measured in the ISO-SWS spectrum (see Fig. 10). Nevertheless, the ISO-SWS spectrum does not spatially resolve the PDR and mixes the peak of the continuum observed in the atomic zone with Spitzer/IRAC and the peak of the lines of H2 and OH expected at the dissociation front. JWST will spatially resolve the different PDR layers, allowing us to properly verify the model and determine if the continuum is actually underestimated for λ > 8 μm.
Figure 10 displays the spectrum at the H0/H2 dissociation front derived from the synthetic cube. We focus here on the wavelength range 9–13 because as seen in Fig. 3 this is the domain where OH lines are the brightest. Moreover, longward of 15 pm, OH lines might also be excited by other mechanisms such as chemical pumping by O+H2 with ro-vibrationally excited H2 (A. Zanchet, priv. comm., and preliminary results from Maiti & Schatz 2003; Braunstein et al. 2004; Weck et al. 2006) or with the first excited state of oxygen O(1D) (Liu et al. 2000) and not only from water photodissociation.
OH/H2(2.12 μm) line ratio and estimated OH line sum intensity of the quadruplet for different models.
 |
Fig. 10 Synthetic spectrum at the H0/H2 dissociation front from the synthetic cube made for the future MIRI observation in the ERS program (Berné et al. 2022) (R ~ 3000) and ISO-SWS spectrum (R ~ 1500). |
4.1.3 Line-continuum ratio
Figure 11 shows the OH line-to-continuum ratio for models with different thermal pressure. In order to compute this latter, OH line spectra were calculated by considering the integrated intensities divided by the frequency width equal to the spectral resolution element. The spectra were then divided by the simulated spectrum including the continuum and other gas lines as described in the previous subsection. The ratio is much higher for the Pth/k = 5 × 10⁸ K cm–3 model than for the Pth/k = 5 × 10⁷ K cm–3 model, as expected from the analysis of Sect. 3.2.1. The line-to-continuum variation results from the OH line intensity distribution as seen in Fig. 3 and the shape of the dust emission continuum, aromatic bands, and bright lines in this region as seen in Fig. 10. The overall shape is similar for both models because, as explained in Sect. 3.1.2, the relative intensities of the intra-ladder lines depend only on the spectral shape of the UV field, which here is the same for both models. The ratio of OH lines over the continuum is maximum around 10 pm. This is a result of a combined effect between OH line intensities reaching their maximum around 10.8 μm and continuum increasing progressively after 10 μm pm. The lines around 10 μm are therefore those with the highest probability of being detected with the JWST. The value of the maximum ratio varies from 0.6% for a lower limit model at Pth/k = 5× 10⁷ K cm–3 to 7% for an upper limit model at Pth/k = 5×10⁸ K cm–3. The continuum could be underestimated after 8 μm, which can lead to smaller ratios. Therefore, the detection should be possible for the upper limit model at Pth/k = 5× 10⁸ K cm–3, while it will be more challenging for the lower limit model at Pth/k = 5× 10⁷ K cm–3.
4.1.4 Possible blending with other lines
There are also intense lines such as H2 rotational lines (0–0 S(2) and 0–0 S(3)), aromatic bands or lines from the ionized gas (NeII at 12.8 μm, SIV at 10.5 μm, etc.), which could blend with OH lines. Figure 12 displays a zoom onto the 10 μm zone of the spectrum where OH lines are added with a resolving power of 3000. This specific wavelength domain was chosen because this is where the line over continuum ratio is the highest (see Fig. 11). On this figure, the line seen at 9.67 μm is the H2 0– 0 S(3) line. This figure highlights the fact that OH lines are drastically less intense than other lines. Moreover, the 9.9 μm quadruplet is only partially resolved with a resolving power of 3000 (close to the JWST resolving power at this wavelength). Indeed, only two peaks are visible instead of the four expected (at 9.914 μm, 9.916 μm, 9.923 μm and 9.924 μm). However, this figure shows that in the region where the line-to-continuum ratio is the highest, no other lines should blend with OH lines.
In summary, this study shows that in terms of intensity, it is probable that OH lines are detectable as long as the thermal pressure is not too low. The main difficulty in detecting those lines lies in the line-to-continuum ratio. Indeed, as seen in Sect. 4.1.3, even in the best case scenario, the line-to-continuum ratio will not exceed l%-7%. The possible detectability of OH lines relies on the low level of noise. The noise has to be below the line-to-continuum ratio to enable detection.
 |
Fig. 11 Ratio of OH lines over the continuum. Top panel: Pth/k = 5.107 K cm–3 and |


4.2 Application to other environments
4.2.1 Other interstellar PDRs
Figure 6 and Sect. 3.2 show that OH MIR lines can only be detected in very illuminated PDRs with high pressure due to the presence of high temperature. In particular, OH MIR lines are expected to be too weak in regions such as the Horsehead nebula because the thermal pressure, and therefore the gas temperature, is too low. Regions such as NGC 7023 might produce sufficiently bright OH lines but these would be at the limit of detection (about l×l0–6 erg cm–2 s–1 sr–1 for an integration time of 144 s at a S/N of 5, which is granted for the GTO 1192). What is highlighted in this figure is that very high pressure Pth/k ≳ 5.107 K cm–3 and UV field intensity G0 > 103 are necessary to produce supposedly detectable OH MIR lines. Due to this result, the Orion Bar is the best candidate to observe them.
 |
Fig. 12 Spectrum near the dissociation front at the position chosen for the MIRI IFU observation with the ERS (Berné et al. 2022) around 10 μm (blue) with the addition of OH lines (red) for a spectral resolving power R = 3000. The line at 9.67 μm is the H2 0–0 S(3). The sampling, represented with the green line, is half the element of resolution around 10 μm (as Fig. 7 from Glasse et al. 2015); it is about 1.7×l0–3 μm near 10 μm for R = 3000. (Top panel) Pth/k = 5.107 K cm–3 and |


4.2.2 Proplyds
PDRs at the edge of dense molecular clouds are not the only objects where OH lines might be detected by JWST. Our thermo-chemical modeling shows that, as a rule of thumb, denser irradiated environments (high thermal pressure) result in stronger MIR OH line fluxes. This result is in line with the previous detections of bright OH lines with Spitzer-IRS in several protoplanetary disks (Najita et al. 2010; Carr & Najita 2014, Tabone et al., in prep.) and strong protostellar shocks (Tappe et al. 2008, 2012). JWST programs dedicated to interstellar PDRs will encompass proplyds in their field of view (e.g., ERS PDRs4All, Berné et al. 2022). Because they correspond to very dense clumps of gas (nH > 108 cm–3 Champion et al. 2017), and based on the previous detection of nonexternally irradiated disks, OH MIR lines are expected to be well detected with JWST. In these objects, OH MIR emission will still be directly related to the amount of H2O photodissociated per unit of time. However, detailed interpretation of the line flux requires dedicated modeling of proplyds, which is beyond the scope of the present paper.
5 Conclusion
In this work, we explored the potential of OH MIR lines for use in the study of interstellar PDRs. In order to achieve this goal, we amended the Meudon PDR code to include prompt emission induced by H2O photodissociation in the 114–143 nm UV band and a new state-specific formation rate of OH, and analyzed a grid of models.
The main conclusions of this study can be summarized as follows:
OH MIR emission is confined to a thin exposed layer close to the H0/H2 transition where H2O is formed by neutral-neutral reactions and is actively photodissociated;
OH MIR lines are directly proportional to the column density of water photodissociated in the 114–143 nm range. As water requires high temperature to form, OH MIR lines are very sensitive to the temperature at the H0/H2 transition. In particular, we predict that OH MIR lines are brighter in regions with high thermal pressure;
OH MIR lines are less dependent on the strength of the incident UV field for
 . When the incident UV field increases, the H0/H2 transition shifts deeper into the cloud but the temperature and local UV field (and thus water abundance) stay rather constant, explaining the rather small impact on OH lines;
OH lines are predicted to be detectable with JWST only in highly illuminated PDRs
 with high pressure
  . Detection might then be possible in the Orion Bar but not in the Horsehead Nebula. The low line-to-continuum ratio might also be a major limitation for the detection of OH lines because of instrumental effects such as fringes.
In conclusion, our work demonstrates that OH MIR lines are a promising tool for studying the physical processes in PDRs. In particular, OH MIR lines constitute an indirect but sensitive diagnostic of the temperature at the H0/H2 transition, a parameter that is highly uncertain in PDR models (Röllig et al. 2007). Spatially resolved observations of MIR OH and H2 rotational lines will therefore be key to testing PDR models, better calibrating the correlation between OH emission and temperature, and studying the details of oxygen chemistry in irradiated environments. For nonspatially resolved observations of PDRs, where H2 emission gives only an average estimate of the temperature, OH would then be a unique diagnostic to assess the temperature around the H0/H2 transition. We also note that in this study, we focused only on the prompt emission of OH induced by H2O photodissociation at short wavelengths. Prompt emission induced by water photodissociation longward of 143 nm, which excites ro-vibrational lines in the NIR, as well as chemical pumping by O+H2, which excites MIR lines longward of ≃15 μm, if properly modeled, can also bring strong complementary constraints on the physical and chemical processes in dense PDRs.
Public version of August 2021: https://pdr.obspm.fr/pdr_download.html
I(Av)/I(Av = 20) assuming OH and H2 lines are optically thin.
The Orion Bar synthetic spectra are available here https://pdrs4all.org/seps/#0rion-Bar-synthetic-spectra
Acknowledgements
The authors wish to thank John H. Black for insightful comments on the manuscript and Alexandre Zanchet for fruitful discussions about chemical pumping of OH. This work was partially supported by the Programme National “Physique et Chimie du Milieu Interstellaire” (PCMI) of CNRS/INSU with INC/INP and co-funded by CNES. B.T. is a Laureate of the Paris Region fellowship program, which is supported by the Ile-de-France Region and has received funding under the Horizon 2020 innovation framework program and Marie Sklodowska-Curie grant agreement no. 945298.
Appendix A H2O Chemistry
Appendix A.1 Neutral-neutral reactions
In the warm region, at low AV (AV ≤ 1), H2O is formed via neutral-neutral reactions:
 (A.1)
(A.1)
Assuming that the abundance of total oxygen (x0 ≃ 3.19 x 10⁻⁴) is the sum of the abundance of atomic oxygen, water, and hydroxyl, we get a steady-state abundance of H2O of:
 (A.2)
(A.2)
The rate coefficients used in this formula are presented Table A.1. In the Appendix, we use the thermal rates from Agún-dez et al. (2010) and Veselinova et al. (2021). This formula is a generalization of that provided by Kristensen et al. (2017) (see also van Dishoeck et al. 2021) and shows that H2O abundance in warm and dense environments depends primarily on G0/nh, Tk, and H2 abundance.
The abundance is displayed in Fig. A.1 as a function of G0/nH for different temperatures. The abundance increases dramatically with temperature in the Tk = 400–1000 K range whereas it is inversely proportional to G0/nH. This shows that a small change in the temperature results in a large variation in H2O abundance and therefore in OH MIR emission, whereas a change in incident UV radiation field has a somewhat smaller impact.
We also show in Fig. A.3 that our analytical model nicely reproduces the abundance profile computed by the Meudon PDR code, confirming that, in the case of H2 + O reactions, thermal reaction rates can be use to analyze, at least qualitatively, the affects of the physical conditions on the amount of H2O and therefore on OH MIR emission.
We note that in this Appendix, we only use the thermal coefficient rate assuming H2 levels follow a Boltzmann distribution. H2 level distribution can be different in PDRs, in particular due to UV pumping. However, using the state-specific chemistry from Veselinova et al. (2021) only increases the abundance of H2O by a factor 2.
Appendix A.2 ion–neutral reactions
In colder regions, at higher Av (Av > 1), H2O is formed via ionneutral reactions. In atomic regions, the ion-neutral route is:
 (A.3)
(A.3)
where ζ is the cosmic-ray ionisation rate and η is the branching ratio of the electronic recombination forming H2O (η ~ 20 %). Indeed, the electronic recombination of H3O+ can also lead to OH. We further assume that this series of reactions leading to H3O+ has an efficiency ϵ (ϵ ~ 15%):
 (A.4)
(A.4)
 |
Fig. A.1 H2O abundance from the neutral-neutral reactions as a function of |

In molecular regions, the ion–neutral route is slightly different:
 (A.5)
(A.5)
Thus in molecular regions, we have:
 (A.6)
(A.6)
In Fig. A.3, we show that this analytical formula nicely reproduces the abundance profile of H2O in the cold and shielded region of the PDR where the neutral-neutral formation route is inefficient. However, as mentioned in Sect. 2.1, only gas-phase chemistry is taken into account in the Meudon PDR code for water formation. In those regions, formation of solid H2O and subsequent photo-desorption back to the gas phase may alter the position and amplitude of the peak (Hollenbach et al. 2009; Putaud et al. 2019).
Thermal rate coefficient for chemical reactions for O+H2 (Veselinova et al. 2021) and OH+H2 (Agúndez et al. 2010), and the photodissociation rate of OH and H2O Heays et al. (2017).
 |
Fig. A.2 H2O abundance as a function of temperature for different values of G0/nH The dashed lines are the abundances calculated for the ion–neutral route and the solid lines are the abundances calculated for the neutral–neutral route. This figure highlights the transition temperature between ion–neutral and neutral-neutral routes. |
 |
Fig. A.3 Comparison between the Meudon PDR code for a model at Pth/k= 108 K cm–3 and |

Appendix B OH chemistry
Figure B.1 displays the different formation routes of OH; in most of the cloud, the neutral–neutral reactions can be seen to dominate. There is a significant contribution of H2O photodissociation at the OH abundance peak.
 |
Fig. B.1 Percentage of the different formation routes of OH as a function of the visual extinction for the model Pth/k= 108K cm–3 and |

References
- Agúndez, M., Goicoechea, J. R., Cernicharo, J., Faure, A., & Roueff, E. 2010, ApJ, 713, 662 [Google Scholar]
- Allers, K. N., Jaffe, D. T., Lacy, J. H., Draine, B. T., & Richter, M. J. 2005, ApJ, 630, 368 [NASA ADS] [CrossRef] [Google Scholar]
- Bernard-Salas, J., & Tielens, A. G. G. M. 2005, A&A, 431, 523 [NASA ADS] [CrossRef] [EDP Sciences] [Google Scholar]
- Bernard-Salas, J., Peeters, E., Sloan, G. C., et al. 2009, ApJ, 699, 1541 [NASA ADS] [CrossRef] [Google Scholar]
- Berné, O., Habart, É., Peeters, E., et al. 2022, PASP, 134, 054301 [CrossRef] [Google Scholar]
- Black, J. H., & van Dishoeck, E. F. 1987, ApJ, 322, 412 [Google Scholar]
- Braunstein, M., Adler-Golden, S., Maiti, B., & Schatz, G. C. 2004, J. Chem. Phys., 120, 4316 [NASA ADS] [CrossRef] [Google Scholar]
- Brooke, J. S. A., Bernath, P. F., Western, C. M., et al. 2016, J. Quant. Spec. Radiat. Transf., 168, 142 [NASA ADS] [CrossRef] [Google Scholar]
- Burton, M. G., Hollenbach, D. J., & Tielens, A. G. G. M. 1990, ApJ, 365, 620 [NASA ADS] [CrossRef] [Google Scholar]
- Carr, J. S., & Najita, J. R. 2014, ApJ, 788, 66 [NASA ADS] [CrossRef] [Google Scholar]
- Champion, J., Berné, O., Vicente, S., et al. 2017, A&A, 604, A69 [NASA ADS] [CrossRef] [EDP Sciences] [Google Scholar]
- Choi, Y., van der Tak, F. F. S., Bergin, E. A., & Plume, R. 2014, A&A, 572, A10 [NASA ADS] [CrossRef] [EDP Sciences] [Google Scholar]
- Compiègne, M., Verstraete, L., Jones, A., et al. 2011, A&A, 525, A103 [Google Scholar]
- Cox, N. L. J., Pilleri, P., Berné, O., Cernicharo, J., & Joblin, C. 2016, MNRAS, 456, L89 [NASA ADS] [CrossRef] [Google Scholar]
- Federman, S. R., Glassgold, A. E., & Kwan, J. 1979, ApJ, 227, 466 [NASA ADS] [CrossRef] [Google Scholar]
- Ferland, G. J., Korista, K. T., Verner, D. A., et al. 1998, PASP, 110, 761 [Google Scholar]
- Fitzpatrick, E. L., & Massa, D. 1988, ApJ, 328, 734 [NASA ADS] [CrossRef] [Google Scholar]
- Fitzpatrick, E. L., & Massa, D. 1990, ApJS, 72, 163 [NASA ADS] [CrossRef] [Google Scholar]
- Flower, D. R., & Roueff, E. 1998, J. Phys. B At. Mol. Phys., 31, 2935 [NASA ADS] [CrossRef] [Google Scholar]
- Flower, D. R., & Roueff, E. 1999, J. Phys. B At. Mol. Phys., 32, 3399 [NASA ADS] [CrossRef] [Google Scholar]
- Foschino, S., Berné, O., & Joblin, C. 2019, A&A, 632, A84 [EDP Sciences] [Google Scholar]
- Glasse, A., Rieke, G. H., Bauwens, E., et al. 2015, PASP, 127, 686 [NASA ADS] [CrossRef] [Google Scholar]
- Goicoechea, J. R., & Roncero, O. 2022, A&A, 664, A190 [NASA ADS] [CrossRef] [EDP Sciences] [Google Scholar]
- Goicoechea, J. R., Joblin, C., Contursi, A., et al. 2011, A&A, 530, L16 [CrossRef] [EDP Sciences] [Google Scholar]
- Goicoechea, J. R., Pety, J., Cuadrado, S., et al. 2016, Nature, 537, 207 [Google Scholar]
- Gonzalez Garcia, M., Le Bourlot, J., Le Petit, F., & Roueff, E. 2008, A&A, 485, 127 [NASA ADS] [CrossRef] [EDP Sciences] [Google Scholar]
- Habart, E., Walmsley, M., Verstraete, L., et al. 2005, Space Sci. Rev., 119, 71 [Google Scholar]
- Habart, E., Abergel, A., Boulanger, F., et al. 2011, A&A, 527, A122 [NASA ADS] [CrossRef] [EDP Sciences] [Google Scholar]
- Habart, E., Le Gal, R., Alvarez, C., et al. 2022, arXiv e-prints, [arXiv:2206.08245] [Google Scholar]
- Heays, A. N., Bosman, A. D., & van Dishoeck, E. F. 2017, A&A, 602, A105 [NASA ADS] [CrossRef] [EDP Sciences] [Google Scholar]
- Hogerheijde, M. R., de Geus, E. J., Spaans, M., van Langevelde, H. J., & van Dishoeck, E. F. 1995, ApJ, 441, L93 [NASA ADS] [CrossRef] [Google Scholar]
- Hollenbach, D., & Natta, A. 1995, ApJ, 455, 133 [NASA ADS] [CrossRef] [Google Scholar]
- Hollenbach, D. J., & Tielens, A. G. G. M. 1999, Rev. Mod. Phys., 71, 173 [Google Scholar]
- Hollenbach, D., Kaufman, M. J., Bergin, E. A., & Melnick, G. J. 2009, ApJ, 690, 1497 [NASA ADS] [CrossRef] [Google Scholar]
- Inoguchi, M., Hosokawa, T., Mineshige, S., & Kim, J.-G. 2020, MNRAS, 497, 5061 [NASA ADS] [CrossRef] [Google Scholar]
- Joblin, C., Bron, E., Pinto, C., et al. 2018, A&A, 615, A129 [NASA ADS] [CrossRef] [EDP Sciences] [Google Scholar]
- Jones, A. P., Fanciullo, L., Köhler, M., et al. 2013, A&A, 558, A62 [NASA ADS] [CrossRef] [EDP Sciences] [Google Scholar]
- Jones, A. P., Köhler, M., Ysard, N., Bocchio, M., & Verstraete, L. 2017, A&A, 602, A46 [NASA ADS] [CrossRef] [EDP Sciences] [Google Scholar]
- Juvela, M. 2019, A&A, 622, A79 [NASA ADS] [CrossRef] [EDP Sciences] [Google Scholar]
- Kaplan, K. F., Dinerstein, H. L., Oh, H., et al. 2017, ApJ, 838, 152 [CrossRef] [Google Scholar]
- Kaplan, K. F., Dinerstein, H. L., Kim, H., & Jaffe, D. T. 2021, ApJ, 919, 27 [NASA ADS] [CrossRef] [Google Scholar]
- Kaufman, M. J., Wolfire, M. G., & Hollenbach, D. J. 2006, ApJ, 644, 283 [Google Scholar]
- Kłos, J., Lique, F., & Alexander, M. H. 2007, Chem. Phys. Lett., 445, 12 [CrossRef] [Google Scholar]
- Kristensen, L. E., van Dishoeck, E. F., Mottram, J. C., et al. 2017, A&A, 605, A93 [CrossRef] [EDP Sciences] [Google Scholar]
- Le Petit, F., Nehmé, C., Le Bourlot, J., & Roueff, E. 2006, ApJ, 164, 506 [Google Scholar]
- Liu, X., Lin, J. J., Harich, S., Schatz, G. C., & Yang, X. 2000, Science, 289, 1536 [CrossRef] [Google Scholar]
- Luhman, M. L., Jaffe, D. T., Keller, L. D., & Pak, S. 1994, ApJ, 436, L185 [NASA ADS] [CrossRef] [Google Scholar]
- Maiti, B., & Schatz, G. C. 2003, J. Chem. Phys., 119, 12360 [NASA ADS] [CrossRef] [Google Scholar]
- Marconi, A., Testi, L., Natta, A., & Walmsley, C. M. 1998, A&A, 330, 696 [NASA ADS] [Google Scholar]
- Mathis, J. S., Mezger, P. G., & Panagia, N. 1983, A&A, 500, 259 [NASA ADS] [Google Scholar]
- Nagy, Z., Choi, Y., Ossenkopf-Okada, V., et al. 2017, A&A, 599, A22 [NASA ADS] [CrossRef] [EDP Sciences] [Google Scholar]
- Najita, J. R., Carr, J. S., Strom, S. E., et al. 2010, ApJ, 712, 274 [NASA ADS] [CrossRef] [Google Scholar]
- Offer, A. R., van Hemert, M. C., & van Dishoeck, E. F. 1994, J. Chem. Phys., 100, 362 [NASA ADS] [CrossRef] [Google Scholar]
- Pabst, C. H. M., Goicoechea, J. R., Teyssier, D., et al. 2020, A&A, 639, A2 [NASA ADS] [CrossRef] [EDP Sciences] [Google Scholar]
- Parikka, A., Habart, E., Bernard-Salas, J., et al. 2017, A&A, 599, A20 [NASA ADS] [CrossRef] [EDP Sciences] [Google Scholar]
- Parikka, A., Habart, E., Bernard-Salas, J., Köhler, M., & Abergel, A. 2018, A&A, 617, A77 [NASA ADS] [CrossRef] [EDP Sciences] [Google Scholar]
- Parmar, P. S., Lacy, J. H., & Achtermann, J. M. 1991, ApJ, 372, L25 [CrossRef] [Google Scholar]
- Pellegrini, E.W., Baldwin, J. A., Ferland, G. J., Shaw, G., & Heathcote, S. 2009, ApJ, 693, 285 [CrossRef] [Google Scholar]
- Pilleri, P., Montillaud, J., Berné, O., & Joblin, C. 2012, A&A, 542, A69 [NASA ADS] [CrossRef] [EDP Sciences] [Google Scholar]
- Putaud, T., Michaut, X., Le Petit, F., Roueff, E., & Lis, D. C. 2019, A&A, 632, A8 [NASA ADS] [CrossRef] [EDP Sciences] [Google Scholar]
- Röllig, M., Abel, N. P., Bell, T., et al. 2007, A&A, 467, 187 [Google Scholar]
- Schirmer, T., Abergel, A., Verstraete, L., et al. 2020, A&A, 639, A144 [NASA ADS] [CrossRef] [EDP Sciences] [Google Scholar]
- Schirmer, T., Ysard, N., Habart, E., et al. 2022, A&A, 666, A49 [NASA ADS] [CrossRef] [EDP Sciences] [Google Scholar]
- Sheffer, Y., Wolfire, M. G., Hollenbach, D. J., Kaufman, M. J., & Cordier, M. 2011, ApJ, 741, 45 [NASA ADS] [CrossRef] [Google Scholar]
- Sternberg, A., & Dalgarno, A. 1995, ApJS, 99, 565 [NASA ADS] [CrossRef] [Google Scholar]
- Stutzki, J., & Guesten, R. 1990, ApJ, 356, 513 [Google Scholar]
- Tabone, B., van Hemert, M. C., van Dishoeck, E. F., & Black, J. H. 2021, A&A, 650, A192 [NASA ADS] [CrossRef] [EDP Sciences] [Google Scholar]
- Tappe, A., Lada, C. J., Black, J. H., & Muench, A. A. 2008, ApJ, 680, L117 [Google Scholar]
- Tappe, A., Forbrich, J., Martín, S., Yuan, Y., & Lada, C. J. 2012, ApJ, 751, 9 [NASA ADS] [CrossRef] [Google Scholar]
- Tauber, J. A., Tielens, A. G. G. M., Meixner, M., & Goldsmith, P. F. 1994, ApJ, 422, 136 [NASA ADS] [CrossRef] [Google Scholar]
- Tielens, A. G. G. M. 1993, in Dust and Chemistry in Astronomy, eds. T. J. Millar, & D. A. Williams (Routledge), 103 [Google Scholar]
- Tielens, A. G. G. M., & Hollenbach, D. 1985a, ApJ, 291, 722 [Google Scholar]
- Tielens, A. G. G. M., & Hollenbach, D. 1985b, ApJ, 291, 747 [NASA ADS] [CrossRef] [Google Scholar]
- Truong, T. N. 1995, J. Chem. Phys., 102, 5335 [NASA ADS] [CrossRef] [Google Scholar]
- van der Werf, P. P., Stutzki, J., Sternberg, A., & Krabbe, A. 1996, A&A, 313, 633 [NASA ADS] [Google Scholar]
- van Dishoeck, E. F., & Black, J. H. 1986, ApJS, 62, 109 [Google Scholar]
- van Dishoeck, E. F., Herbst, E., & Neufeld, D. A. 2013, Chem. Rev., 113, 9043 [Google Scholar]
- van Dishoeck, E. F., Kristensen, L. E., Mottram, J. C., et al. 2021, A&A, 648, A24 [NASA ADS] [CrossRef] [EDP Sciences] [Google Scholar]
- van Harrevelt, R., & van Hemert, M. C. 2000, J. Chem. Phys., 112, 5787 [NASA ADS] [CrossRef] [Google Scholar]
- van Harrevelt, R., & van Hemert, M. C. 2001, J. Chem. Phys., 114, 9453 [NASA ADS] [CrossRef] [Google Scholar]
- Veselinova, A., Agúndez, M., Goicoechea, J. R., et al. 2021, A&A, 648, A76 [NASA ADS] [CrossRef] [EDP Sciences] [Google Scholar]
- Visser, R., Geers, V. C., Dullemond, C. P., et al. 2007, in Molecules in Space and Laboratory, eds. J. L. Lemaire, & F. Combes (S. Diana), 102 [Google Scholar]
- Walmsley, C. M., Natta, A., Oliva, E., & Testi, L. 2000, A&A, 364, 301 [NASA ADS] [Google Scholar]
- Weck, P. F., Balakrishnan, N., Brandão, J., Rosa, C., & Wang, W. 2006, J. Chem. Phys., 124, 074308 [Google Scholar]
- Woitke, P., Kamp, I., & Thi, W. F. 2009, A&A, 501, 383 [NASA ADS] [CrossRef] [EDP Sciences] [Google Scholar]
- Wolfire, M. G., Vallini, L., & Chevance, M. 2022, ARA&A, 60, 247 [NASA ADS] [CrossRef] [Google Scholar]
- Wrathmall, S. A., & Flower, D. R. 2007, J. Phys. B At. Mol. Phys., 40, 3221 [NASA ADS] [CrossRef] [Google Scholar]
- Zellner, R., & Steinert, W. 1981, Chem. Phys. Lett., 81, 568 [NASA ADS] [CrossRef] [Google Scholar]
- Zhang, D. H., & Zhang, J. Z. H. 1994, J. Chem. Phys., 100, 2697 [NASA ADS] [CrossRef] [Google Scholar]
- Zhang, Z. E., Cummings, S. J., Wan, Y., Yang, B., & Stancil, P. C. 2021, ApJ, 912, 116 [NASA ADS] [CrossRef] [Google Scholar]
All Tables
OH/H2(2.12 μm) line ratio and estimated OH line sum intensity of the quadruplet for different models.
Thermal rate coefficient for chemical reactions for O+H2 (Veselinova et al. 2021) and OH+H2 (Agúndez et al. 2010), and the photodissociation rate of OH and H2O Heays et al. (2017).
All Figures
|
Fig. 1 Results of our fiducial model with Pth/k =108 K cm–3 and |
| In the text | |
|
Fig. 2 Percentage of the different formation routes of H2O as a function of the visual extinction for the model Pth/k= 108 K cm–3 and |
| In the text | |
|
Fig. 3 Intensities of OH MIR lines observed with a viewing angle of 60° as a function of wavelength for a model Pth/k= 108 K cm–3 and |
| In the text | |
|
Fig. 4 Schematic of the excitation of OH in the presence of prompt emission. The production of rotationally excited OH (orange arrows) is followed by a N → N – 1 radiative cascade (shown as blue arrows) emitting the series of lines shown in Fig. 3. For lower rotational states (N ≲ 10), OH levels can be excited by IR pumping and collisions that emit in the FIR. In this greatly simplified schematic, only a limited number of rotational levels are shown, ignoring the splitting of rotational levels caused by Λ-doubling and spin-orbit coupling, vibrational levels, and other kinds of weaker radiative transitions. |
| In the text | |
|
Fig. 5 Cumulative intensity (normalized) of the 10.8 μm OH line, and of several rotationnal and ro-vibrational lines of H2 calculated with the Meudon PDR code with a thermal pressure Pth/k = 108 K cm–3 and |
| In the text | |
|
Fig. 6 Summed intensity of the quadruplet at λ =10.8 μm observed with a viewing angle of 60° as a function of the gas pressure for different UV field intensities. The black horizontal lines represent the JWST sensitivity for a corresponding integration time and an S/N of 5. |
| In the text | |
|
Fig. 7 Evolution of H2O abundance, local gas temperature, and local UV field as a function of the thermal pressure and the incident UV field. Top panels: Abundance profile of H2O for different thermal pressures at a given UV field intensity (a) and for different incident UV fields at a given thermal pressure (b). Bottom panels: Evolution of the temperature and the UV field at the first H2O peak as a function of the thermal pressure (c) and the incident UV field intensity (d). |
| In the text | |
|
Fig. 8 Analytic calculations of the first H2O peak abundance as a function of the temperature at the first H2O peak (Appendix A, using the thermal rate coefficient from Agúndez et al. 2010; Veselinova et al. 2021). The state-specific rate coefficients are not considered in the analytic calculations. Using the state-specific chemistry enhances the abundance of H2O by a factor 2. The dotted blue line represents the calculation of the abundance of H2O formed by ion-neutral reactions and the dashed red line represents the calculation of the abundance of H2O formed by neutral–neutral reactions. The triangles are the first H2O peak abundances calculated with the Meudon PDR code for models at incident UV field |
| In the text | |
|
Fig. 9 Ratio of the predicted OH line at 10.8 μm over the H2 line 1-0 S(l) at 2.12 μm predicted by the Meudon PDR Code. |
| In the text | |
|
Fig. 10 Synthetic spectrum at the H0/H2 dissociation front from the synthetic cube made for the future MIRI observation in the ERS program (Berné et al. 2022) (R ~ 3000) and ISO-SWS spectrum (R ~ 1500). |
| In the text | |
|
Fig. 11 Ratio of OH lines over the continuum. Top panel: Pth/k = 5.107 K cm–3 and |
| In the text | |
|
Fig. 12 Spectrum near the dissociation front at the position chosen for the MIRI IFU observation with the ERS (Berné et al. 2022) around 10 μm (blue) with the addition of OH lines (red) for a spectral resolving power R = 3000. The line at 9.67 μm is the H2 0–0 S(3). The sampling, represented with the green line, is half the element of resolution around 10 μm (as Fig. 7 from Glasse et al. 2015); it is about 1.7×l0–3 μm near 10 μm for R = 3000. (Top panel) Pth/k = 5.107 K cm–3 and |
| In the text | |
|
Fig. A.1 H2O abundance from the neutral-neutral reactions as a function of |
| In the text | |
|
Fig. A.2 H2O abundance as a function of temperature for different values of G0/nH The dashed lines are the abundances calculated for the ion–neutral route and the solid lines are the abundances calculated for the neutral–neutral route. This figure highlights the transition temperature between ion–neutral and neutral-neutral routes. |
| In the text | |
|
Fig. A.3 Comparison between the Meudon PDR code for a model at Pth/k= 108 K cm–3 and |
| In the text | |
|
Fig. B.1 Percentage of the different formation routes of OH as a function of the visual extinction for the model Pth/k= 108K cm–3 and |
| In the text | |
Current usage metrics show cumulative count of Article Views (full-text article views including HTML views, PDF and ePub downloads, according to the available data) and Abstracts Views on Vision4Press platform.
Data correspond to usage on the plateform after 2015. The current usage metrics is available 48-96 hours after online publication and is updated daily on week days.
Initial download of the metrics may take a while.