Fig. 8
Download original image
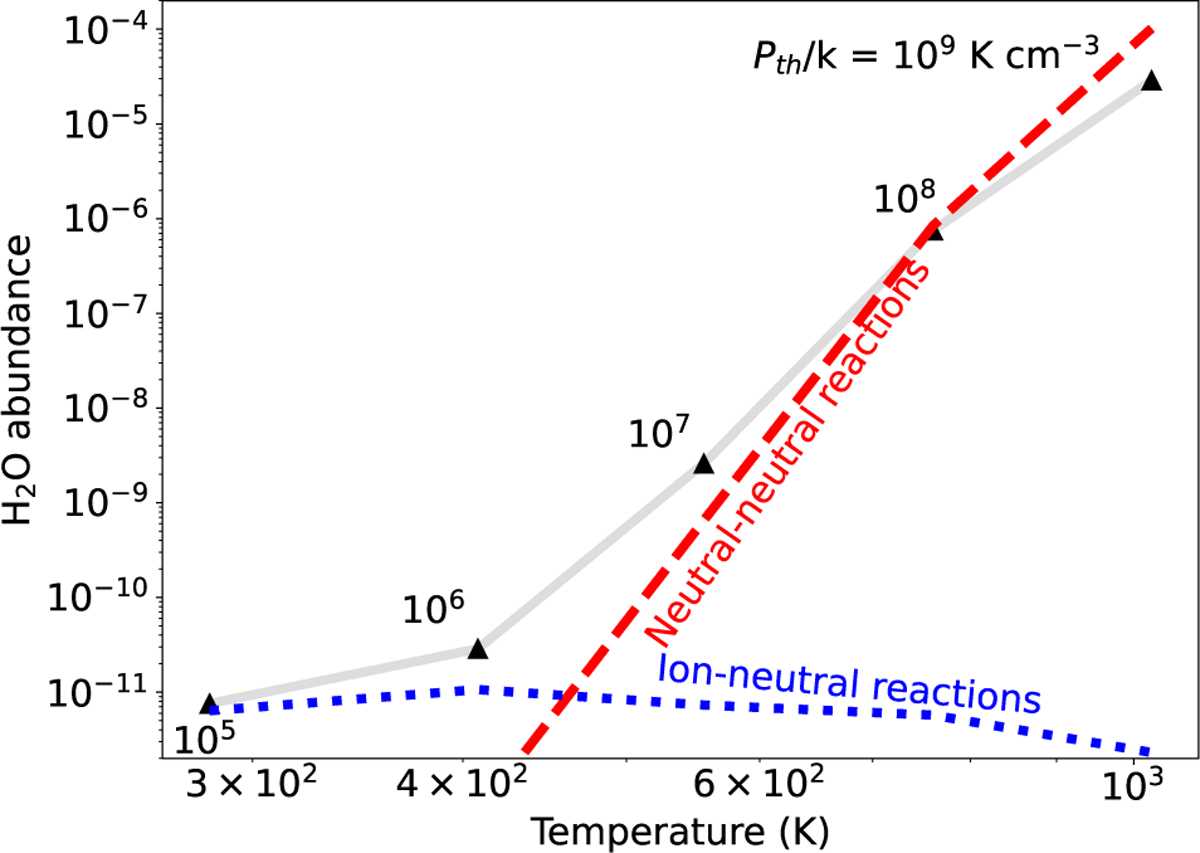
Analytic calculations of the first H2O peak abundance as a function of the temperature at the first H2O peak (Appendix A, using the thermal rate coefficient from Agúndez et al. 2010; Veselinova et al. 2021). The state-specific rate coefficients are not considered in the analytic calculations. Using the state-specific chemistry enhances the abundance of H2O by a factor 2. The dotted blue line represents the calculation of the abundance of H2O formed by ion-neutral reactions and the dashed red line represents the calculation of the abundance of H2O formed by neutral–neutral reactions. The triangles are the first H2O peak abundances calculated with the Meudon PDR code for models at incident UV field ![]() and different thermal pressure.
and different thermal pressure.
Current usage metrics show cumulative count of Article Views (full-text article views including HTML views, PDF and ePub downloads, according to the available data) and Abstracts Views on Vision4Press platform.
Data correspond to usage on the plateform after 2015. The current usage metrics is available 48-96 hours after online publication and is updated daily on week days.
Initial download of the metrics may take a while.