Open Access
Fig. A.2
Download original image
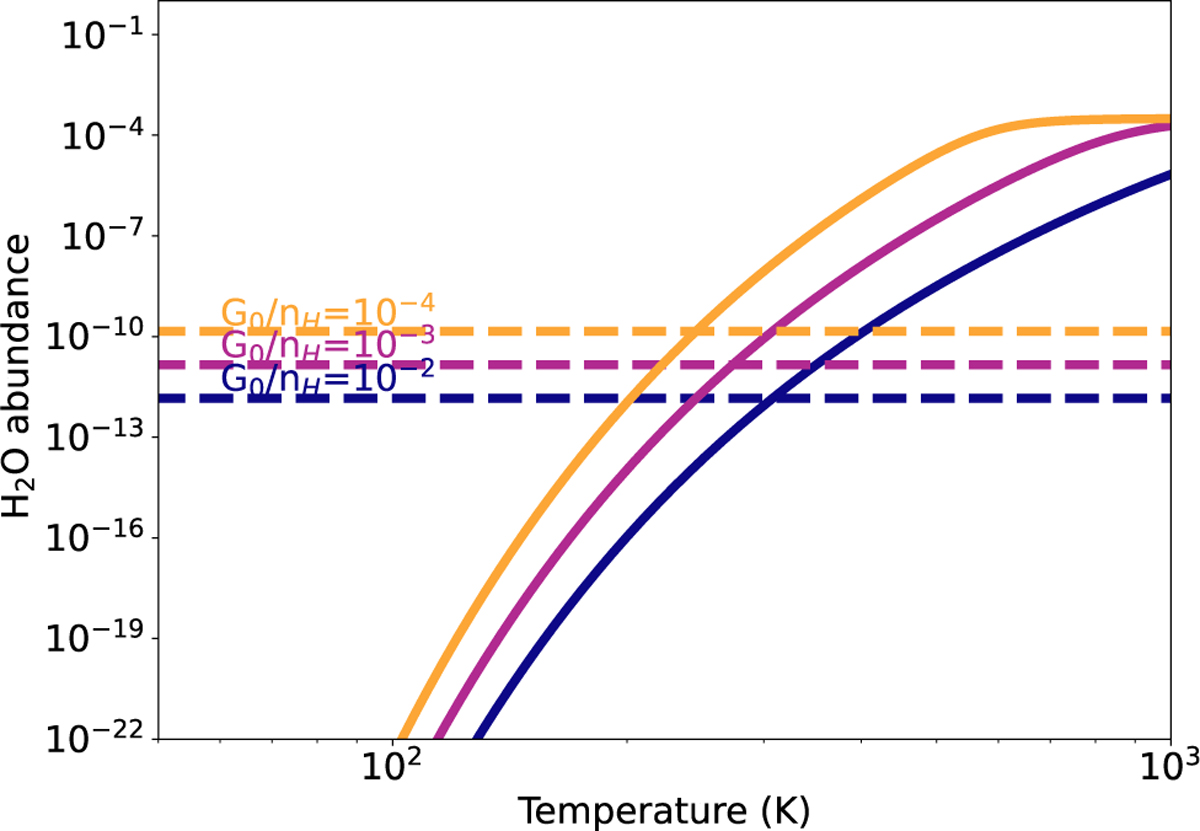
H2O abundance as a function of temperature for different values of G0/nH The dashed lines are the abundances calculated for the ion–neutral route and the solid lines are the abundances calculated for the neutral–neutral route. This figure highlights the transition temperature between ion–neutral and neutral-neutral routes.
Current usage metrics show cumulative count of Article Views (full-text article views including HTML views, PDF and ePub downloads, according to the available data) and Abstracts Views on Vision4Press platform.
Data correspond to usage on the plateform after 2015. The current usage metrics is available 48-96 hours after online publication and is updated daily on week days.
Initial download of the metrics may take a while.