Fig. 8
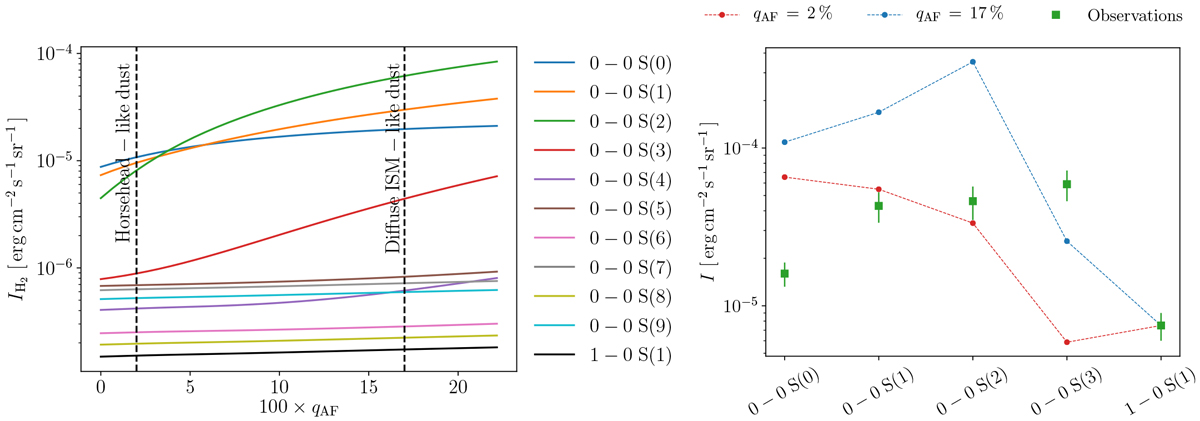
Left: modelled integrated intensities (i.e. intensity integrated along a line-of-sight considering a face-on PDR) of H2 lines as a function of qAF. Right: modelled integrated intensities of H2 lines for qAF = 2% (red dots) and qAF = 17% (blue dots). Observed integrated intensity (the spectra are averaged in an area centred at the emission peak (see black boxes in Fig. 3 in Habart et al. 2011)) in the Horsehead with uncertainties (1σ) is shown by the green squares. Models have been scaled on the 1–0 S(1) H2 observed line.
Current usage metrics show cumulative count of Article Views (full-text article views including HTML views, PDF and ePub downloads, according to the available data) and Abstracts Views on Vision4Press platform.
Data correspond to usage on the plateform after 2015. The current usage metrics is available 48-96 hours after online publication and is updated daily on week days.
Initial download of the metrics may take a while.