Open Access
Fig. 7
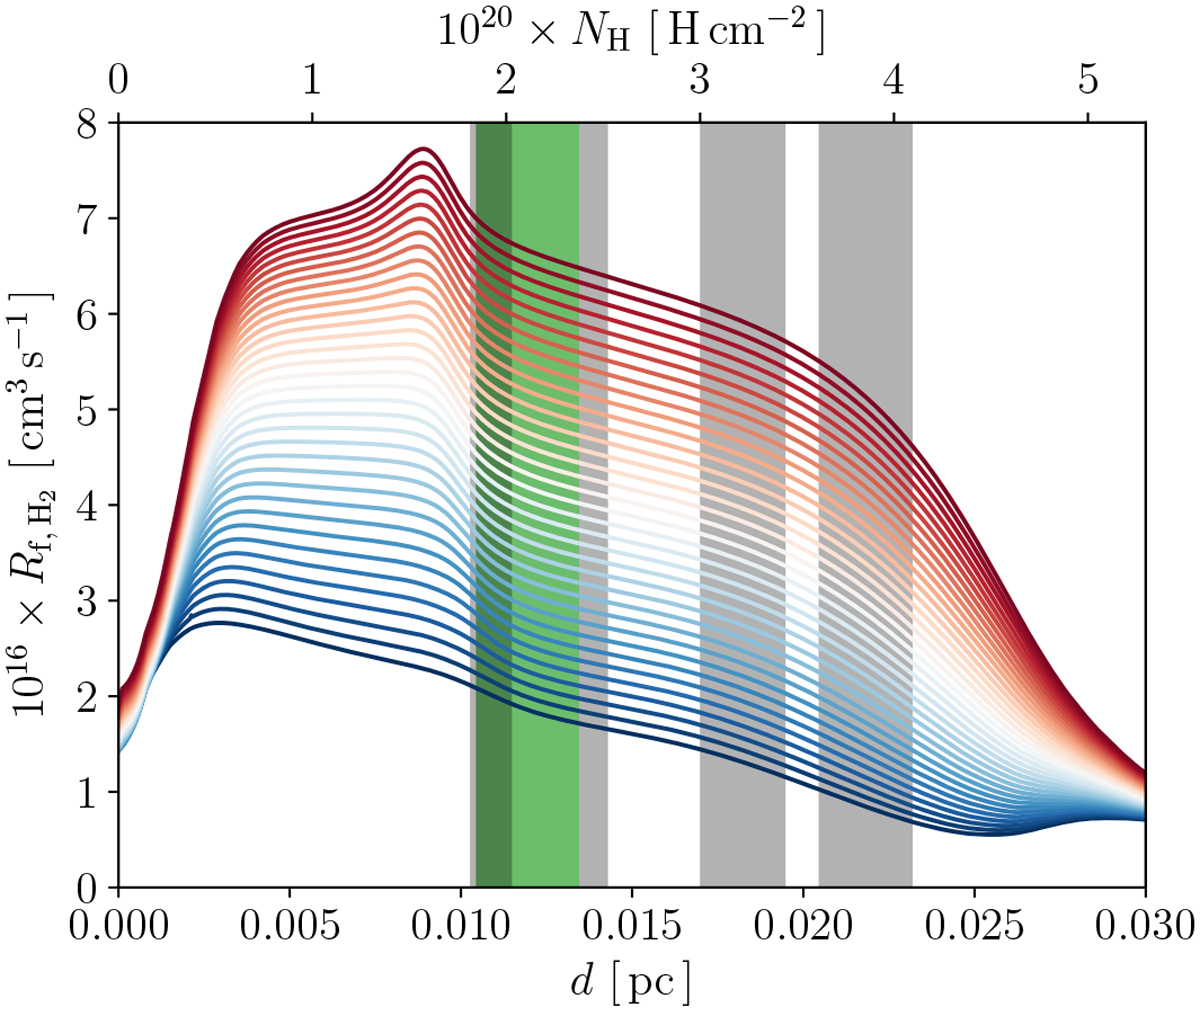
Total H2 formation rate across the PDR for qAF varying from 0% (blue line) to22% (red line). The meaning of the green and grey stripes is explained in Fig. 3.
Current usage metrics show cumulative count of Article Views (full-text article views including HTML views, PDF and ePub downloads, according to the available data) and Abstracts Views on Vision4Press platform.
Data correspond to usage on the plateform after 2015. The current usage metrics is available 48-96 hours after online publication and is updated daily on week days.
Initial download of the metrics may take a while.