Fig. 3
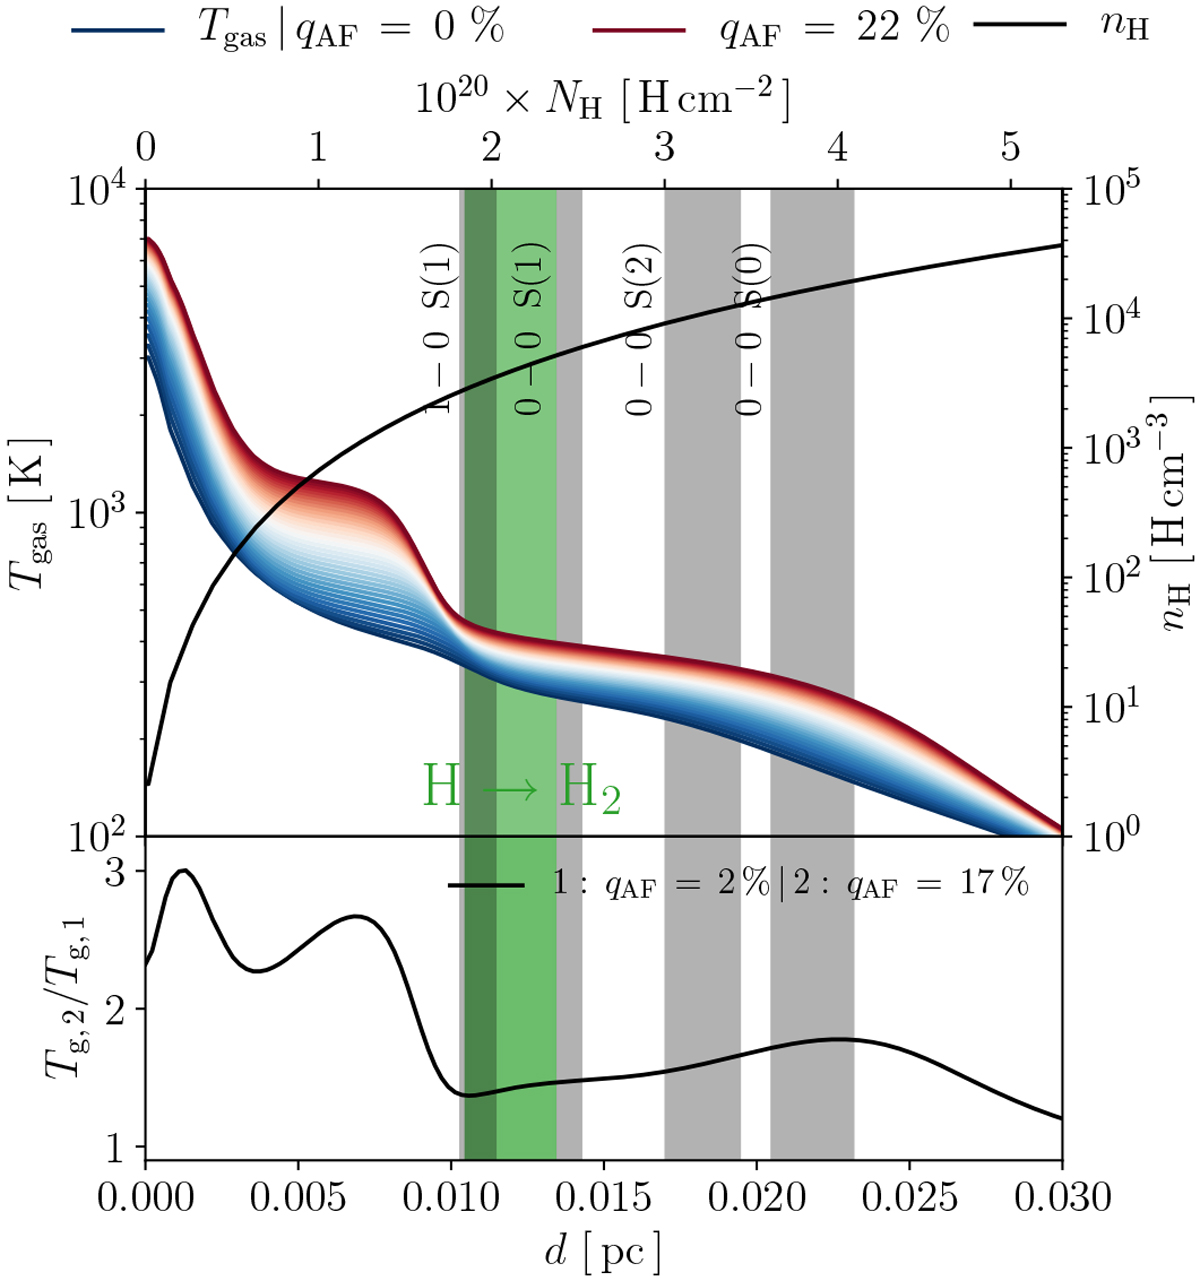
Top: gas temperature across the PDR for qAF varying from 0% (blue line) to22% (red line). The density profile is shown with a black line. Bottom: ratio between the gas temperature across the PDR using the diffuse ISM-like dust (qAF = 17%) and the Horsehead-like dust (qAF = 2%). The green stripe corresponds to the position of the H → H2 transition (see Fig. 6) for qAF varying from 2% (Horsehead-like dust) to 17% (diffuse ISM-like dust). The four grey bands successively correspond to the position of the maximum emission of the H2 1–0 S(1) line (see Fig. B.4), the H2 0–0 S(1) line (see Fig. B.2), the H2 0–0 S(2) line (see Fig. B.3), and the H2 0–0 S(0) line (see Fig. B.1) for 2 ≤ qAF ≤ 17%.
Current usage metrics show cumulative count of Article Views (full-text article views including HTML views, PDF and ePub downloads, according to the available data) and Abstracts Views on Vision4Press platform.
Data correspond to usage on the plateform after 2015. The current usage metrics is available 48-96 hours after online publication and is updated daily on week days.
Initial download of the metrics may take a while.