| Issue |
A&A
Volume 649, May 2021
|
|
|---|---|---|
| Article Number | A139 | |
| Number of page(s) | 8 | |
| Section | Interstellar and circumstellar matter | |
| DOI | https://doi.org/10.1051/0004-6361/202039974 | |
| Published online | 28 May 2021 | |
Multiple molecular outflows and fragmentation in the IRDC core G34.43+00.24 MM1
CONICET - Universidad de Buenos Aires. Instituto de Astronomía y Física del Espacio CC 67,
Suc. 28,
1428
Buenos Aires,
Argentina
e-mail: This email address is being protected from spambots. You need JavaScript enabled to view it.
Received:
23
November
2020
Accepted:
8
March
2021
Abstract
Context. The fragmentation of a molecular cloud that leads to the formation of high-mass stars occurs on a hierarchy of different spatial scales. The large molecular clouds harbor massive molecular clumps with massive cores embedded in them. The fragmentation of these cores may determine the initial mass function and the masses of the final stars. Therefore, studying the fragmentation processes in the cores is crucial to understanding how massive stars form.
Aims. Detailed studies toward particular objects are needed to collect observational evidence that shed light on star formation processes on the smallest spatial scales. The hot molecular core G34–MM1, embedded in the filamentary infrared dark cloud (IRDC) G34.34+00.24 located at a distance of 3.6 kpc, is a promising object for studying fragmentation and outflow processes.
Methods. Using data at 93 and 334 GHz obtained from the Atacama Large Millimeter Array (ALMA) database we studied in great detail the hot molecular core G34–MM1. The angular resolution of the data at 334 GHz is about 0.′′8, which allows us to resolve structures of about 0.014 pc (~2900 au).
Results. We found evidence of fragmentation toward the molecular hot core G34–MM1 on two different spatial scales. The dust condensation MM1–A (about 0.06 pc in size) harbors three molecular subcore candidates (SC1 through SC3) detected in 12CO J = 3–2 emission, with typical sizes of about 0.02 pc and an average spatial separation among them of about 0.03 pc. From the HCO+ J = 1–0 emission, we identify, with better angular resolution than previous observations, two perpendicular molecular outflows arising from MM1–A. We suggest that subcores SC1 and SC2, embedded in MM1–A, respectively harbor the sources responsible for the main and the secondary molecular outflow. Finally, from the radio continuum emission at 334 GHz, we marginally detected another dust condensation, named MM1–E, from which a young (tdyn ~ 1.6 × 10³ yr), massive (M ~ 5 M⊙), and energetic (E ~ 6 × 1046 ergs) molecular outflow arises.
Conclusions. The fragmentation of the hot molecular core G34–MM1 at two different spatial scales, together with the presence of multiple molecular outflows associated with it, would support a competitive accretion scenario. Studies like this shed light on the relation between fragmentation and star formation processes occurring within hot molecular cores, only accessible through high angular resolution interferometric observations.
Key words: stars: formation / stars: protostars / ISM: jets and outflows
© ESO 2021
1 Introduction
Given that massive stars (M > 8 M⊙) form deeply in the molecular clouds and that they reach the pre-main sequence stage before the dense envelope is removed, the formation and presence of young massive stars are usually inferred from the effects that they have on the surrounding interstellar material. The presence of hot molecular cores (HMCs), ultra-compact (UC) H II regions, and massive molecular outflows indicate that high-mass star formation is indeed taking place (Rathborne et al. 2011).
Hot molecular cores are compact (≤0.1 pc), dense (~105− 108 cm−3), and massive (~102 M⊙) molecular structures that are heated (>100 K) in the immediate vicinity of the recently formed high-mass protostar (Cesaroni 2005; Beuther et al. 2007; Motte et al. 2018). Additionally, HMCs are the most important reservoirs of complex organic molecules (COMs), including key species for prebiotic processes (Beltrán & Rivilla 2018), and thus are very important interstellar objects in that they contribute to our knowledge of astrochemistry (Jørgensen et al. 2020). While some HMCs are associated with UC H II regions, many have weak or no observable radio continuum emission (Hoare et al. 2007). Hence, HMCs are thought to be the precursors of UC H II, and are thus appropriate features to study the earliest phases of high-mass star formation and the related chemistry. Molecular outflows have also been observed during the HMC phase, which suggests the presence of accretion disks within the cores (Hernández-Hernández et al. 2014).
Hot molecular cores are usually embedded in massive molecular clumps, which in turn are substructures of infrared dark clouds (IRDCs), which are identified as high-extinction filamentary features against the bright Galactic mid-IR background (Rathborne et al. 2006; Ragan et al. 2015; Lu et al. 2018). This hierarchical fragmentation seems to be a ubiquitous process in the massive star formation that occurs from the scale of the filaments down to the scale of individual dense cores and protostars (Sadaghiani et al. 2020). It is thought that cores tend to further fragment, indicating that massive stars form in close groups (Liu et al. 2013; Zhang et al. 2015). Thus, studying the deepest level of fragmentation is crucial to understanding not only the formation of individual stars, but also of stellar clusters.
In this work, based on high-resolution data extracted from the ALMA Science Archive, we present a kinematic and morphological study of the hot molecular core G34–MM1 in order to characterize in detail its internal structure. The paper is organized asfollows: in Sect. 2 we present the IRDC and the analyzed hot molecular core; in Sect. 3 we describe the data used; in Sects. 4 and 5 we present and discuss the results; and finally, in Sect. 6 we make our concluding remarks.
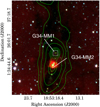 |
Fig. 1 Overview of the IRDC G34.43+00.24 region containing cores G34–MM1 and G34–MM2 on a GLIMPSE three-color image with 3.6 (blue), 4.5 (green), and 8.0 μm (red). The green contours represent the ATLASGAL emission at 870 μm. Levels are at 0.4, 0.7, 1.5, 4, 5, and 6 Jy beam−1. The white square indicates the region mapped at 334 GHz. |
2 Presentation of the region and the analyzed core
IRDC G34.43+00.24 (hereafter IRDC G34) is a filamentary infrared dark cloud located at a kinematic distance of about 3.6 kpc (Tang et al. 2019) harboring several molecular cores; Rathborne et al. (2006) labeled them G34-MM1 to G34-MM9, and they are likely at different evolutionary stages (Chen et al. 2011). For instance, among these cores, G34-MM2 has an associated UCH II region (Shepherd et al. 2004). The authors also detected marginal radio continuum emission toward G34-MM1, and suggested that the embedded object appears to be a massive B2 protostar at an early stage of evolution, which is supported by the absence of associated near-infrared emission. Later, Rosero et al. (2016) confirmed radio continuum emission at 1.3 and 6 cm toward G34-MM1.
Figure 1 shows a three-color Spitzer image of a region of the IRDC G34 seen as a dark filament against the 8 μm diffuse emission. The green contours represent the continuum emission at 870 μm obtained from ATLASGAL. Two striking dust condensations can be seen, ATLASGAL sources G034.4112+0.2344 and G034.4005+0.2262, which are respectively labeled G34–MM1 and G34–MM2, following Rathborne et al. (2006). The core G34–MM1, which is the less evolved one, shows conspicuous extended emission at 4.5 μm and is associated with the position of the EGO G34.41+0.24 (catalogued by Cyganowski et al. 2008). Instead, the core G34–MM2, which is brighter at 8 μm, is associated with the UC H II region G34.4+0.23.
Several authors have found molecular outflow activity toward the cores G34-MM1, MM2, and MM3, showing that at least three molecular condensations embedded in IRDC G34 are active star-forming sites (Shepherd et al. 2007; Rathborne et al. 2008; Sanhueza et al. 2010; Sakai et al. 2018). Shepherd et al. (2007) found two perpendicular molecular outflows arising from the core G34–MM1; however, limitation in the spatial resolution of the data prevented them from identifying the driving individual sources. Finally, based on a comparison between the gravitational binding energy and the outflow kinetic energy, the authors suggested that the core G34–MM1 is been destroyed by the intense outflow activity.
Rathborne et al. (2008, 2011) pointed out that G34–MM1 is a hot molecular core with a rotating gaseous structure surrounding a central protostar. The authors detected the emission of several COMs lines toward this core, including CH3CN (186–176), from which they estimated a rotational temperature between 110 and 210 K. In addition, based on the ratio between the gas and virial masses of core G34–MM1, Rathborne et al. (2008) found that the molecular condensation is likely to be fragmented, although no evidence of fragmentation was observed.
More recently, Tang et al. (2019) carried out a study on the impact of the fragmentation of cores G34–MM1, G34–MM2, and G34–MM3, based on a comparison between the effects of gravity, magnetic field, and turbulence. The authors suggested that the absence of fragmentation in the core G34–MM1 could be due to the high ratio between the gravitational energy density and the turbulent pressure. However, the presence of two perpendicular molecular outflows toward G34–MM1 detected by Shepherd et al. (2007) might indicate an internal fragmentation of the core that deserves to be studied with higher angular resolution data.
3 Data
Data cubes with central frequencies at 93 and 334 GHz were obtained from the ALMA Science Archive1 (Project codes: 2015.1.00369, and 2013.1.00960, PIs: Rosero, V., and Csengri, T., respectively) to analyze the core G34–MM1. The Common Astronomy Software Applications (CASA) 5.4.1 was used to handle and analyze the data. Table 1 presents the main data parameters. The single pointing observations were carried out using the following telescope configurations: Min/Max Baseline(m) of 150/460 and extended for 93 and 334 GHz, respectively, in the 12 m array in both cases. The maximum recoverable scales at 93 and 334 GHz are 14.5 and 6.7 arcsec, respectively.
Given that high spatial resolution is required to perform this study, it is important to note that the beam size of the 334 GHz data cube provides a spatial resolution of about 0.014 pc (~ 2900 au) at the distance of 3.6 kpc, which is appropriate for investigating the fragmentation of core G34–MM1.
4 Results
In the following subsections we present the results obtained based on the analysis of the ALMA data toward the core G34–MM1.
4.1 Continuum emission at 93 and at 334 GHz
Figure 2 shows the radio continuum emission at 93 GHz. The lower contour is at 1.5 mJy beam−1 (about 5σ rms noise level). The peak of the emission at 93 GHz (λ ~ 3.2 mm) is positionally coincident with the peaks observed at 1.3 and 6 cm by Rosero et al. (2016; red filled circle in the figure).
The figure shows a main condensation, labeled MM1–A, which exhibits a conspicuous bulge toward the east (increasing RA) and seems to be connected to a smaller condensation, labeled MM1–B, that extends to the southeast (decreasing Dec). There are also two minor condensations (MM1–C and MM1–D marginally detected at 5σ rms noise level), which appear detached from the main core and are located toward the southeast.
Figure 3 shows the radio continuum emission at 334 GHz in comparison with the emission at 93 GHz. The peak of the emissionat 3 cm detected by Rosero et al. (2016) is marked with a red filled circle and coincides with the peak of the emission at 334 GHz (λ ~ 0.89 mm).
Despite the differences in sensitivity and angular resolution between images at 93 and 334 GHz, some common features can be noticed. For instance, the condensation labeled MM1–B, which at 334 GHz appears detached from the main core, coincides with an elongated protuberance at 93 GHz extending southeastward from the core. On the other hand, at 334 GHz, a bridge-like structure can be seen extending to the east of the core and ending in a small condensation (hereafter MM1–E), which is unresolved at 93 GHz. In conclusion, the continuum emission at 334 GHz, which essentially traces the core dust emission, spatially resolves structures within the core G34–MM1 that were not resolved in previous works, strongly suggesting that the core is indeed fragmented.
In what follows we analyze the nature of the continuum emission at both frequencies. Shepherd et al. (2004) estimated a total flux density of 56.8 and 0.7 mJy at 3 mm and 6 cm, respectively, toward G34–MM1. Considering that continuum emission at 6 cm arises completely from ionized gas and assuming that its emission is optically thin between 6 cm and 3 mm (Sν ∝ ν−0.1), the authors estimated a contribution of 0.52 mJy of the ionized gas to the continuum emission at 3 mm (about 1%).
Later, Rosero et al. (2016) estimated a total flux density of about 0.4 and 1.5 mJy at 4.9 GHz (λ ~ 6 cm) and 25.5 GHz (λ ~ 1.3 cm), respectively, with a spectral index of +0.7, which is in agreement with optically thick thermal emission. Taking into account the location of this ionized gas (red filled circle in Fig. 3), it is reasonable to assume that its contribution to the continuum emission at 93 and 334 GHz will only be relevant toward the center of the condensation MM1–A. Considering a region of the size of a beam (at each frequency) centered at the position of the 1.3 cm emission, we estimated a total flux density of about 20 and 710 mJy at 93 and 334 GHz, respectively. Assuming that the turn-over frequency of the radio continuum emission for these young H II regions can reach 100 GHz (Yang et al. 2021), and considering the spectral index obtained by Rosero et al. (2016), we estimated a flux density (related to the emission of the ionized gas) of about 3 mJy for both frequencies. Therefore, the upper limit for the contribution of the emission of the ionized gas to the continuum emission at 93 GHz is about 15% (toward the center of MM1–A) and is negligible at 334 GHz.
Main data parameters.
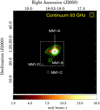 |
Fig. 2 Radio continuum emission at 93 GHz. The color scale goes from 1.5 (about 5σ rms noise level) to 16.5 mJy beam−1. The contour levels are at 1.5, 2.5, 4, 5, 12, 30 mJy beam−1. The red filled circle indicates the position and extension (up to 3σ rms noise level) of the radio continuum emission at 1.3 cm detected by Rosero et al. (2016). The white box indicates the region mapped at 334 GHz. The beam is indicated in the top right corner. |
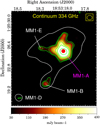 |
Fig. 3 Radio continuum emission at 334 GHz. The color scale goes from 30 (about 3σ rms noise level) to 430 mJy beam−1. The green contour levels are at 30, 50 (about 5σ rms noise level), 100, 150, 250, and 700 mJy beam−1. The white contour corresponds to the 5σ rms noise level of the radio continuum emission at 93 GHz. The red filled circle indicates the position and extension (up to 3σ rms noise level) of the radio continuum emission at 1.3 cm detected by Rosero et al. (2016). The beam is indicated in the top right corner. |
 |
Fig. 4 Left panel: HCO+ J = 1–0 line emission distribution integrated between 40 and 75 km s−1. The gray scale goes from 0.1 to 0.6 Jy beam−1 km s−1. The blue contours are at 0.1, 0.2, 0.3, 0.5, 0.6, and 0.9 Jy beam−1 km s−1. Right panel: three-color image of the HCO+ J = 1–0 line emission integrated over three velocity intervals: [43, 53], [53, 63], and [63, 73] km s−1, shown in blue, green, and red, respectively. The solid and dashed lines indicate the direction of the main outflow and the perpendicular outflow, respectively. White contours represent the radio continuum emission at 93 GHz. Levels are at 1, 2, 4, 5, 12, and 30 mJy beam−1. The red filled circle indicates the position of the radio continuum emission at 1.3 cm detected by Rosero et al. (2016). The beam isindicated in the top right corner of each panel. |
4.2 HCO+ J = 1–0 line emission
Figure 4, left, shows the HCO+ 5 = 1–0 lineemission distribution integrated between 40 and 75 km s−1. The figure shows a main HCO+ condensation centered at RA = 18:53:18.0, Dec = +1:25:27.0, on whose border is located the ionized gas (red filled circle) related to the B2-type protostar. This HCO+ condensation, which seems to be positionally related to MM1–A, appears in connection with several gaseous elongated structures. Taking into account that the HCO+ J = 1–0 line is a good tracer of dense gas and molecular outflows (e.g., Rawlings et al. 2004) and based on the morphology of the emission, weconclude that what it is displayed in Fig. 4, left, clearly indicates the presence of two perpendicular outflows arising from MM1–A. These outflows coincide with those previously detected at lower angular resolution (~4′′) by Shepherd et al. (2007) using the 12CO J = 1–0 transition. The main molecular outflow, which goes in the southwest–northeast direction, exhibits an asymmetric morphology with respect to its lobes, and reveals a lower degree of collimation than the secondary and perpendicular outflows extending from southeast to northwest. This secondary outflow also shows a striking asymmetry between its lobes. In particular, the southeastern outflow exhibits a discontinuous structure composed of at least two fragments.
After a careful analysis of the HCO+ data cube with the aim of identifying different velocity components, we present in Figure 4, right, a three-color image of the HCO+ J = 1–0 integrated over three velocity intervals: [43, 53], [53, 63], and [63, 73] km s−1. The central velocity of the second interval corresponds to the systemic velocity of the gas related to G34–MM1 (~58 km s−1). The main outflow shows a red-shifted lobe with a cone-like morphology extending to the southwest. Interestingly, this lobe shows the presence of systemic velocity gas (in green) probably associated with the walls of a cavity excavated in the surrounding dense gas by the action of the outflow (e.g., Weigelt et al. 2006; Arce et al. 2007). As mentioned above, this lobe is noticeably brighter than the northeastern one, which shows the presence of a more collimated, and curved blue-shifted feature, and also some diffuse red-shifted gas almost coexisting in the same spatial region.
The secondary outflow exhibits a southeast–northwest direction. The northwest direction shows two aligned structures: an extended and less collimated blue-shifted emission, which positionally coincides with the blue lobe detected by Shepherd et al. (2007), and a more collimated red-shifted filament embedded in the former emission. In turn, two structures appear toward the southeast, one blue-shifted and one red-shifted, which are aligned with the outflow axis and detached from the molecular core.
Figure 5 shows an averaged HCO+ J = 1–0 spectrum obtained toward the position of the radio continuum emission at 1.3 cm. Four conspicuous self-absorption features can be appreciated, and the velocity of the main self-absorption dip coincides with the systemic velocity of the gas related to G34–MM1 (blue vertical line).
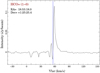 |
Fig. 5 Averaged HCO+ J = 1–0 spectrum obtained toward the position of the radio continuum emission at 1.3 cm in a circular region of 2 arcsec radius. The blue vertical line indicates the systemic velocity of the gas associated with G34–MM1. |
4.3 12CO J = 3–2 line emission
Figure 6 shows in gray scale the integrated velocity channel maps of the 12CO J = 3−2 emission with the radio continuum emission at 93 and 334 GHz superimposed in contours.
Panel 1 shows a straight filament-like structure (labeled OF1) about 0.2 pc in size, which extends from the MM1–E position (see Fig. 3) to the southeast. In panel 2 the feature OF1 exhibits a curved morphology, which seems to connect condensations MM1–E and MM1–B. The molecular gas related to MM1–A can also be seen. Panel 3 shows the presence of gas very likely related to the blue-shifted lobe associated with the main molecular outflow, which at this velocity range appears disconnected from the main core. The gaseous structure OF1 exhibits a cone-like morphology ending in two separated branches. The absence of molecular gas toward the location of the radio continuum emission peak at this velocity range is due to self-absorption effects, as can be seen in Fig. 7. Panel 4, whose velocity range includes the systemic velocity of G34–MM1, shows the bulk of the 12CO J = 3–2 emission related to MM1–A. The region delimited by the dashed blue lines (blue lobe region) shows the presence of two structures: the low-velocity gas component of the blue-shifted lobe belonging to the main outflow, which appears to be connected to the bulk of the emission, and diffuse emission, which seems to arise from MM1–E. The red-shifted lobe of the main outflow can also be seen in this panel.
In panel 5 there are several interesting features: (1) the high-velocity gas component of the red-shifted lobe of the main outflow; (2) a cone-like gaseous structure (labeled OF2), which seems to arise from the condensation MM1–E (see Fig. 3); (3) four molecular condensations, likely subcores, labeled SC1 through SC4, with SC1 in positional coincidence with the radio continuum emission peak of MM1–A; and (4) a discontinuous filament related to the secondary outflow whose direction is indicated by the dashed black line, which seems to arise from the intermediate region between subcores SC2 and SC3. Finally, panel 6 shows the gaseous structure OF2, which appears more collimated than in panel 5. Given their morphology and kinematics, both gaseous structures OF1 and OF2, appear to be high-velocity molecular outflows related to the dust condensation MM1–E. It is important to note that these new molecular outflows were not identified in the HCO+ J = 1–0 emission.
Figure 7 shows the averaged 12CO J = 3–2 spectrum obtained toward the position of the radio continuum emission at 1.3 cm. As in the case of the HCO+ J = 1–0 spectrum, several self-absorption features can be seen. In particular, the velocity of the main self-absorption dip coincides with the systemic velocity of the gas related to G34–MM1. It is important to note that these pronounced self-absorption features are only detected toward the center of the MM1–A condensation.
Figure 8 displays the 12CO J = 3–2 emission distribution integrated over two velocity ranges with the continuum emission at 334 GHz (green contours) superimposed. Two conspicuous filament-like features are shown: OF1 in blue and OF2 in red, associated with the velocity ranges −10 to +50 km s−1 and +65 to +105 km s−1, respectively.Both gaseous structures seem to arise from MM1–E. We suggest that they correspond to the misaligned blue- and red-shifted lobes of a high-velocity molecular outflow. Therefore, MM1–E would be another active star formation condensation within G34–MM1.
In order to roughly estimate the mass of the outflow candidates arising from MM1–E, following Bertsch et al. (1993), we calculated the H2 column density as
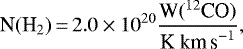 (1)
(1)
where W(12CO) is the 12CO J = 3–2 integrated intensity at the corresponding velocity intervals. The W(12CO) units were converted using
![Mathematical equation: \begin{equation*} T\textrm{[K]}\,{=}\,1.22 \times 10^3 \frac{{I}[\textrm{mJy\,beam}^{-1}]}{\nu^2\textrm{[GHz]} ~\theta_{\textrm{maj}}[\textrm{arcsec}]~\theta_{\textrm{min}}[\textrm{arcsec}]},\end{equation*}](/articles/aa/full_html/2021/05/aa39974-20/aa39974-20-eq2.png) (2)
(2)
where θmaj and θmin correspond to the major and minor axis of the beam, respectively. Then, the mass of each outflow was derived from
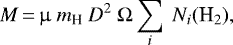 (3)
(3)
where Ω is the solid angle subtended by the beam size; mH is the hydrogen mass; μ is the mean molecular weight, assumed to be 2.8 by taking into account a relative helium abundance of 25%; and D is the distance. Summation was performed over all beam positions belonging to the lobes shown in Fig. 8. Table 2 shows the length, the mass, the momentum ( ), the energy (
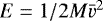 ), the dynamical age (tdyn = Length∕vmax), and the outflow rate (Ṁ = M∕tdyn) of each lobe, where
  and vmax are respectively the median and maximum velocities of each interval velocity with respect to the systemic velocity of the gas associated with G34-MM1.
Finally, taking into account the non-detection of molecular gas related to MM1–E in the 12CO J = 3–2 emission, and considering that this dust condensation is marginally detected at 334 GHz, we cannot discard the possibility that gaseous structures OF1 and OF2 actually correspond to filaments of molecular gas converging to MM1–E from the unbound gas of the clump, as several works have suggested, toward other cores (e.g., Schwörer et al. 2019).
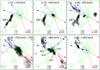 |
Fig. 6 Integrated velocity channel maps of the 12CO J = 3−2 emission. The integration velocity range is exhibited at the top of each panel. The gray scale goes from 2 Jy beam−1 km s−1 (about 3σ rms noise of an averaged channel map) to 10 Jy beam−1 km s−1. The green contours represent the continuum emission at 334 GHz; the levels are at 30, 200, and 400 mJy beam−1. The dashed contour represents the 3σ rms noise level of the radio continuum emission at 93 GHz. The beam is indicated in the bottom right corner of each map. |
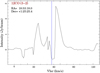 |
Fig. 7 Averaged 12CO J = 3–2 spectrum obtained toward the position of the radio continuum emission at 1.3 cm in a circular region of 1 arcsec radius. The blue vertical line indicates the systemic velocity of the gas associated with G34–MM1. |
Main parameters of the molecular outflow related to MM1–E.
5 Discussion
In this section we discuss the main results of our analysis regarding evidences of fragmentation within the molecular core G34–MM1, and the star formation activity in the region.
Previous studies have not found any sign of fragmentation associated with G34–MM1 (e.g., Shepherd et al. 2004; Rathborne et al. 2008; Sanhueza et al. 2010). In this work, using the high sensitivity and angular resolution of the ALMA data, we suggest that the fragmentation process could have occurred within this molecular core, at least, on two different spatial scales. The larger spatial scalefragmentation within the core G34–MM1 can be seen in the radio continuum image at 93 GHz (see Fig. 2), which shows evidence of fragmentation at core scale with a main condensation MM1–A and three minor fragments (MM1–B, MM1–C, and MM1–D, with the last two marginally resolved). The average spatial separation among the main condensation and these fragments is about 0.2 pc. This main condensation seen at 93 GHz is resolved into two dust condensations at 334 GHz, MM1–A and MM1–E (see Fig. 3).
In Sect. 4.3 the main parameters of the molecular outflow associated with MM1–E were estimated. A comparison of our results with those presented in recent works carried out with ALMA (e.g., Cyganowski et al. 2017; Hervías-Caimapo et al. 2019; Li et al. 2020), suggests that the source embedded in MM1–E is generating a young (tdyn ~ 1.6 × 10³ yr), massive (M~ 5 M⊙), and energetic (E ~ 6 × 1046 ergs) molecular outflow.
From the analysis of the 12CO J = 3–2 emission, we also found possible evidence of internal fragmentation within MM1–A (see panel 5 in Fig. 6). To better appreciate such fragmentation, in Fig. 9 we show the 12CO J = 3–2 emission distribution integrated between 70 and 75 km s−1, the velocity range in which the presence of subcore candidates (SC1 to SC4) is more evident. The average size of these subcores is about 0.02 pc and the average spatial separation among them is about 0.03 pc.
The subcore SC1 positionally coincides with the peak of the emission at 1.3 cm (red cross, from Rosero et al. 2016). Hence, we suggest that the driving source of the main molecular outflow observed at the HCO+ and 12CO emissions may be embedded in SC1.
Regarding the other three molecular condensations we found that the position of the peaks of SC2 and SC3 does not shift by more than a beam throughout their velocity range, which suggests that both subcores are indeed evidence of the internal fragmentation of MM1–A. In particular, SC2 is the closest subcore to the main HCO+ central feature (blue cross in Fig. 9). Additionally, it seems to be connected with a conspicuous filament-like structure extending toward the northwest, in spatial coincidence with the lobe of the secondary outflow traced by the HCO+ emission. Thus, we suggest that the source of the secondary molecular outflow may be embedded in the subcore SC2.
Finally, given that there is no evidence of molecular outflow activity toward subcore SC3, we cannot discard that this condensation corresponds to shocked gas associated with the secondary molecular outflow. In the case of SC4, Fig. 9 shows that it has a slightly elongated morphology aligned with the symmetry axis of the red lobe of the main molecular outflow, and it spatially coincides with the region in which the outflow lobe originates. The position of the emission peak of SC4 shifts by about 0.8 arcsec (the beam size) along its symmetry axis, throughout the velocity range, suggesting that it is associated with shocked gas in the region where the outflow arises.
The evidence of fragmentation within a hot molecular core is something scarce in the literature. We mention, for instance, the work of Dall’Olio et al. (2019), who observed and analyzed many cores and subcores in the star-forming complex G9.62+0.19. In our work the hot core G34–MM1 shows strong evidence of fragmentation with some of the molecular condensations exhibiting molecular outflow activity (SC1, SC2, and MM1–E), suggesting the presence of several protostars embedded within it.
Our results, as was suggested by Dierickx et al. (2015) for the region of Mon R2, would support the competitive accretion scenario of star formation, which can explain the distribution of stellar masses, the mass segregation of young stellar clusters, and the high binary frequency and properties of massive stars (Bonnell 2008).
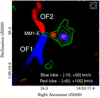 |
Fig. 8 12CO J = 3–2 emission distribution integrated between −10 and +50 kms−1 (OF1, in blue) and between +65 and +105 km s−1 (OF2, in red). The green contours represent the radio continuum emission at 334 GHz; the levels are at 30, 50, 100, 250, and 700 mJy beam−1. The beam isindicated in the top right corner. |
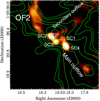 |
Fig. 9 12CO J = 3–2 emission distribution integrated between +70 and +75 km s−1. This velocity range was chosen to highlight the secondary outflow arising from SC2. Contours correspond to the HCO+ J = 1–0 emission distribution integrated between 40 and 75 km s−1. Levels are at 0.1, 0.2, 0.3, 0.5, 0.6, and 0.9 Jy beam−1 km s−1. The red cross indicates the peak of the radio continuum emission at 1.3 cm (Rosero et al. 2016). The blue cross represents the position of the emission peak of the integrated HCO+ J = 1–0 emission. |
6 Concluding remarks
We carried out a study of the internal structure of the hot molecular core G34–MM1 embedded in IRDC G34.43+00.24, using high-resolution ALMA data centered at 93 and 334 GHz.
We found evidence of core fragmentation at two different spatial scales. In particular, the internal fragmentation of the condensation MM1–A allows us to identify the molecular subcore candidates that harbor the protostars responsible for the generation of two perpendicular molecular outflows.
The marginally detected dust condensation MM1–E appears to be connected with two filament-like gaseous structures, which are possibly tracing a young, massive, and energetic molecular outflow.
The fragmentation of the hot molecular core G34–MM1 at two different spatial scales, together with the presence of multiple molecular outflow associated with it, would support the competitive accretion hypothesis of star formation.
Acknowledgements
We acknowledge the anonymous referee for her/his helpful comments and suggestions. N.I. and M.B.A. are posdoctoral and doctoral fellows of CONICET, Argentina, respectively. S.P. and M.O. are members of the Carrera del InvestigadorCientífico of CONICET, Argentina. This work is based on the following ALMA data: ADS/JAO.ALMA # 2015.1.00369, and 2013.1.00960. ALMA is a partnership of ESO (representing its member states), NSF (USA) and NINS (Japan), together with NRC (Canada), MOST and ASIAA (Taiwan), and KASI (Republic of Korea), in cooperation with the Republic of Chile. The Joint ALMA Observatory is operated by ESO, AUI/NRAO and NAOJ.
References
- Arce, H. G., Shepherd, D., Gueth, F., et al. 2007, in Protostars and Planets V, eds. B. Reipurth, D. Jewitt, & K. Keil (Tucson: University of Arizona Press), 245 [Google Scholar]
- Beltrán, M. T., & Rivilla, V. M. 2018, ASP Conf. Ser., 517, 249 [Google Scholar]
- Bertsch, D. L., Dame, T. M., Fichtel, C. E., et al. 1993, ApJ, 416, 587 [NASA ADS] [CrossRef] [Google Scholar]
- Beuther, H., Churchwell, E. B., McKee, C. F., & Tan, J. C. 2007, in Protostars and Planets V, eds. B. Reipurth, D. Jewitt, & K. Keil (Tucson: University of Arizona Press), 165 [Google Scholar]
- Bonnell, I. A. 2008, ASP Conf. Ser., 390, 26 [Google Scholar]
- Cesaroni, R. 2005, IAU Symp, 227, 59 [Google Scholar]
- Chen, H.-R., Liu, S.-Y., Su, Y.-N., & Wang, M.-Y. 2011, ApJ, 743, 196 [NASA ADS] [CrossRef] [Google Scholar]
- Cyganowski, C. J., Whitney, B. A., Holden, E., et al. 2008, AJ, 136, 2391 [NASA ADS] [CrossRef] [Google Scholar]
- Cyganowski, C. J., Brogan, C. L., Hunter, T. R., et al. 2017, MNRAS, 468, 3694 [NASA ADS] [CrossRef] [Google Scholar]
- Dall’Olio, D., Vlemmings, W. H. T., Persson, M. V., et al. 2019, A&A, 626, A36 [NASA ADS] [CrossRef] [EDP Sciences] [Google Scholar]
- Dierickx, M., Jiménez-Serra, I., Rivilla, V. M., & Zhang, Q. 2015, ApJ, 803, 89 [NASA ADS] [CrossRef] [Google Scholar]
- Hernández-Hernández, V., Zapata, L., Kurtz, S., & Garay, G. 2014, ApJ, 786, 38 [NASA ADS] [CrossRef] [Google Scholar]
- Hervías-Caimapo, C., Merello, M., Bronfman, L., et al. 2019, ApJ, 872, 200 [Google Scholar]
- Hoare, M. G., Kurtz, S. E., Lizano, S., Keto, E., & Hofner, P. 2007, in Protostars and Planets V, eds. B. Reipurth, D. Jewitt, & K. Keil (Tucson: University of Arizona Press), 181 [Google Scholar]
- Jørgensen, J. K., Belloche, A., & Garrod, R. T. 2020, ARA&A, 58, 727 [Google Scholar]
- Li, S., Sanhueza, P., Zhang, Q., et al. 2020, ApJ, 903, 119 [Google Scholar]
- Liu, T., Wu, Y., Wu, J., Qin, S.-L., & Zhang, H. 2013, MNRAS, 436, 1335 [NASA ADS] [CrossRef] [Google Scholar]
- Lu, X., Zhang, Q., Liu, H. B., et al. 2018, ApJ, 855, 9 [NASA ADS] [CrossRef] [Google Scholar]
- Motte, F., Bontemps, S., & Louvet, F. 2018, ARA&A, 56, 41 [NASA ADS] [CrossRef] [Google Scholar]
- Ragan, S. E., Henning, T., Beuther, H., Linz, H., & Zahorecz, S. 2015, A&A, 573, A119 [NASA ADS] [CrossRef] [EDP Sciences] [Google Scholar]
- Rathborne, J. M., Jackson, J. M., & Simon, R. 2006, ApJ, 641, 389 [Google Scholar]
- Rathborne, J. M., Jackson, J. M., Zhang, Q., & Simon, R. 2008, ApJ, 689, 1141 [NASA ADS] [CrossRef] [Google Scholar]
- Rathborne, J. M., Garay, G., Jackson, J. M., et al. 2011, ApJ, 741, 120 [NASA ADS] [CrossRef] [Google Scholar]
- Rawlings, J. M. C., Redman, M. P., Keto, E., & Williams, D. A. 2004, MNRAS, 351, 1054 [NASA ADS] [CrossRef] [Google Scholar]
- Rosero, V., Hofner, P., Claussen, M., et al. 2016, ApJS, 227, 25 [NASA ADS] [CrossRef] [Google Scholar]
- Sadaghiani, M., Sánchez-Monge, Á., Schilke, P., et al. 2020, A&A, 635, A2 [CrossRef] [EDP Sciences] [Google Scholar]
- Sakai, T., Yanagida, T., Furuya, K., et al. 2018, ApJ, 857, 35 [NASA ADS] [CrossRef] [Google Scholar]
- Sanhueza, P., Garay, G., Bronfman, L., et al. 2010, ApJ, 715, 18 [NASA ADS] [CrossRef] [Google Scholar]
- Schwörer, A., Sánchez-Monge, Á., Schilke, P., et al. 2019, A&A, 628, A6 [NASA ADS] [CrossRef] [EDP Sciences] [Google Scholar]
- Shepherd, D. S., Nürnberger, D. E. A., & Bronfman, L. 2004, ApJ, 602, 850 [NASA ADS] [CrossRef] [Google Scholar]
- Shepherd, D. S., Povich, M. S., Whitney, B. A., et al. 2007, ApJ, 669, 464 [NASA ADS] [CrossRef] [Google Scholar]
- Tang, Y.-W., Koch, P. M., Peretto, N., et al. 2019, ApJ, 878, 10 [CrossRef] [Google Scholar]
- Weigelt, G., Beuther, H., Hofmann, K. H., et al. 2006, A&A, 447, 655 [NASA ADS] [CrossRef] [EDP Sciences] [Google Scholar]
- Yang, A. Y., Urquhart, J. S., Thompson, M. A., et al. 2021, A&A, 645, A110 [EDP Sciences] [Google Scholar]
- Zhang, Q., Wang, K., Lu, X., & Jiménez-Serra, I. 2015, ApJ, 804, 141 [NASA ADS] [CrossRef] [Google Scholar]
All Tables
All Figures
|
Fig. 1 Overview of the IRDC G34.43+00.24 region containing cores G34–MM1 and G34–MM2 on a GLIMPSE three-color image with 3.6 (blue), 4.5 (green), and 8.0 μm (red). The green contours represent the ATLASGAL emission at 870 μm. Levels are at 0.4, 0.7, 1.5, 4, 5, and 6 Jy beam−1. The white square indicates the region mapped at 334 GHz. |
| In the text | |
|
Fig. 2 Radio continuum emission at 93 GHz. The color scale goes from 1.5 (about 5σ rms noise level) to 16.5 mJy beam−1. The contour levels are at 1.5, 2.5, 4, 5, 12, 30 mJy beam−1. The red filled circle indicates the position and extension (up to 3σ rms noise level) of the radio continuum emission at 1.3 cm detected by Rosero et al. (2016). The white box indicates the region mapped at 334 GHz. The beam is indicated in the top right corner. |
| In the text | |
|
Fig. 3 Radio continuum emission at 334 GHz. The color scale goes from 30 (about 3σ rms noise level) to 430 mJy beam−1. The green contour levels are at 30, 50 (about 5σ rms noise level), 100, 150, 250, and 700 mJy beam−1. The white contour corresponds to the 5σ rms noise level of the radio continuum emission at 93 GHz. The red filled circle indicates the position and extension (up to 3σ rms noise level) of the radio continuum emission at 1.3 cm detected by Rosero et al. (2016). The beam is indicated in the top right corner. |
| In the text | |
|
Fig. 4 Left panel: HCO+ J = 1–0 line emission distribution integrated between 40 and 75 km s−1. The gray scale goes from 0.1 to 0.6 Jy beam−1 km s−1. The blue contours are at 0.1, 0.2, 0.3, 0.5, 0.6, and 0.9 Jy beam−1 km s−1. Right panel: three-color image of the HCO+ J = 1–0 line emission integrated over three velocity intervals: [43, 53], [53, 63], and [63, 73] km s−1, shown in blue, green, and red, respectively. The solid and dashed lines indicate the direction of the main outflow and the perpendicular outflow, respectively. White contours represent the radio continuum emission at 93 GHz. Levels are at 1, 2, 4, 5, 12, and 30 mJy beam−1. The red filled circle indicates the position of the radio continuum emission at 1.3 cm detected by Rosero et al. (2016). The beam isindicated in the top right corner of each panel. |
| In the text | |
|
Fig. 5 Averaged HCO+ J = 1–0 spectrum obtained toward the position of the radio continuum emission at 1.3 cm in a circular region of 2 arcsec radius. The blue vertical line indicates the systemic velocity of the gas associated with G34–MM1. |
| In the text | |
|
Fig. 6 Integrated velocity channel maps of the 12CO J = 3−2 emission. The integration velocity range is exhibited at the top of each panel. The gray scale goes from 2 Jy beam−1 km s−1 (about 3σ rms noise of an averaged channel map) to 10 Jy beam−1 km s−1. The green contours represent the continuum emission at 334 GHz; the levels are at 30, 200, and 400 mJy beam−1. The dashed contour represents the 3σ rms noise level of the radio continuum emission at 93 GHz. The beam is indicated in the bottom right corner of each map. |
| In the text | |
|
Fig. 7 Averaged 12CO J = 3–2 spectrum obtained toward the position of the radio continuum emission at 1.3 cm in a circular region of 1 arcsec radius. The blue vertical line indicates the systemic velocity of the gas associated with G34–MM1. |
| In the text | |
|
Fig. 8 12CO J = 3–2 emission distribution integrated between −10 and +50 kms−1 (OF1, in blue) and between +65 and +105 km s−1 (OF2, in red). The green contours represent the radio continuum emission at 334 GHz; the levels are at 30, 50, 100, 250, and 700 mJy beam−1. The beam isindicated in the top right corner. |
| In the text | |
|
Fig. 9 12CO J = 3–2 emission distribution integrated between +70 and +75 km s−1. This velocity range was chosen to highlight the secondary outflow arising from SC2. Contours correspond to the HCO+ J = 1–0 emission distribution integrated between 40 and 75 km s−1. Levels are at 0.1, 0.2, 0.3, 0.5, 0.6, and 0.9 Jy beam−1 km s−1. The red cross indicates the peak of the radio continuum emission at 1.3 cm (Rosero et al. 2016). The blue cross represents the position of the emission peak of the integrated HCO+ J = 1–0 emission. |
| In the text | |
Current usage metrics show cumulative count of Article Views (full-text article views including HTML views, PDF and ePub downloads, according to the available data) and Abstracts Views on Vision4Press platform.
Data correspond to usage on the plateform after 2015. The current usage metrics is available 48-96 hours after online publication and is updated daily on week days.
Initial download of the metrics may take a while.