Free Access
Fig. 7
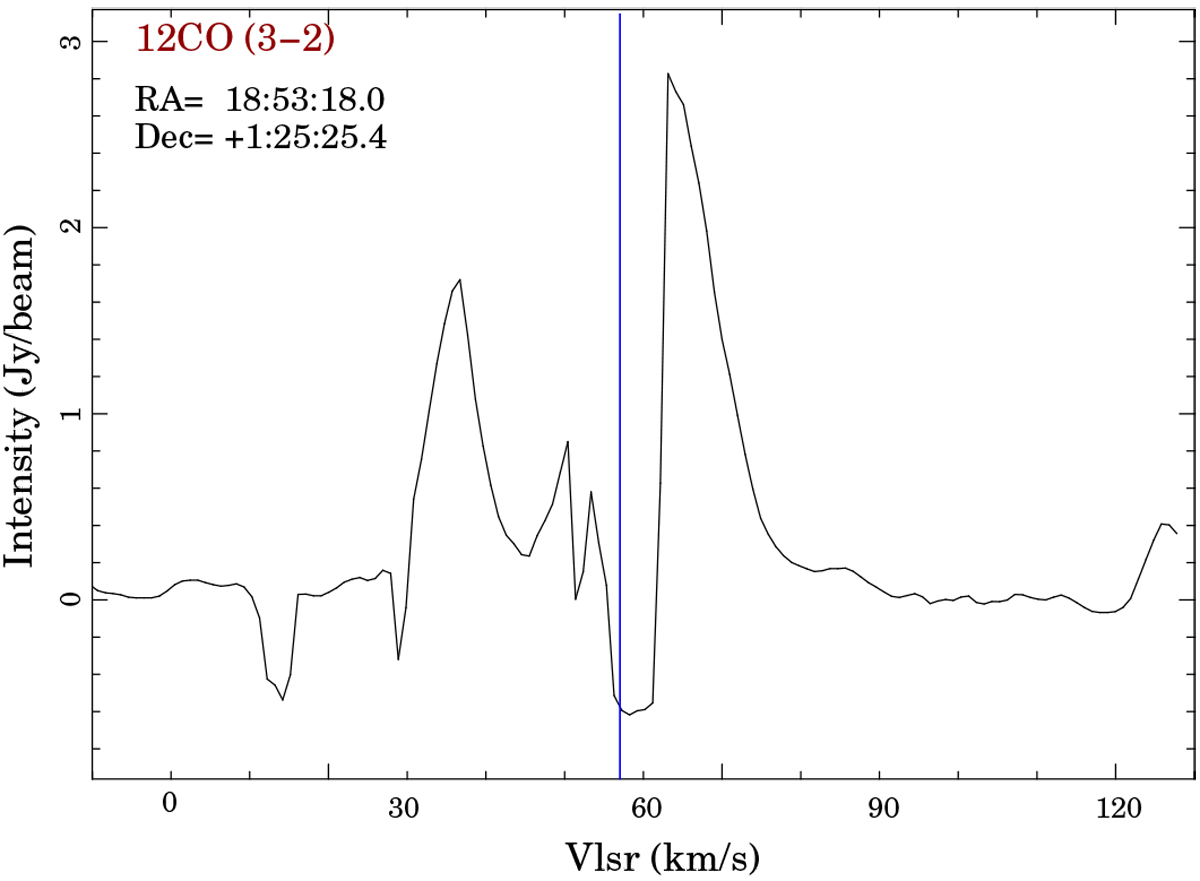
Averaged 12CO J = 3–2 spectrum obtained toward the position of the radio continuum emission at 1.3 cm in a circular region of 1 arcsec radius. The blue vertical line indicates the systemic velocity of the gas associated with G34–MM1.
Current usage metrics show cumulative count of Article Views (full-text article views including HTML views, PDF and ePub downloads, according to the available data) and Abstracts Views on Vision4Press platform.
Data correspond to usage on the plateform after 2015. The current usage metrics is available 48-96 hours after online publication and is updated daily on week days.
Initial download of the metrics may take a while.