Free Access
Fig. 8
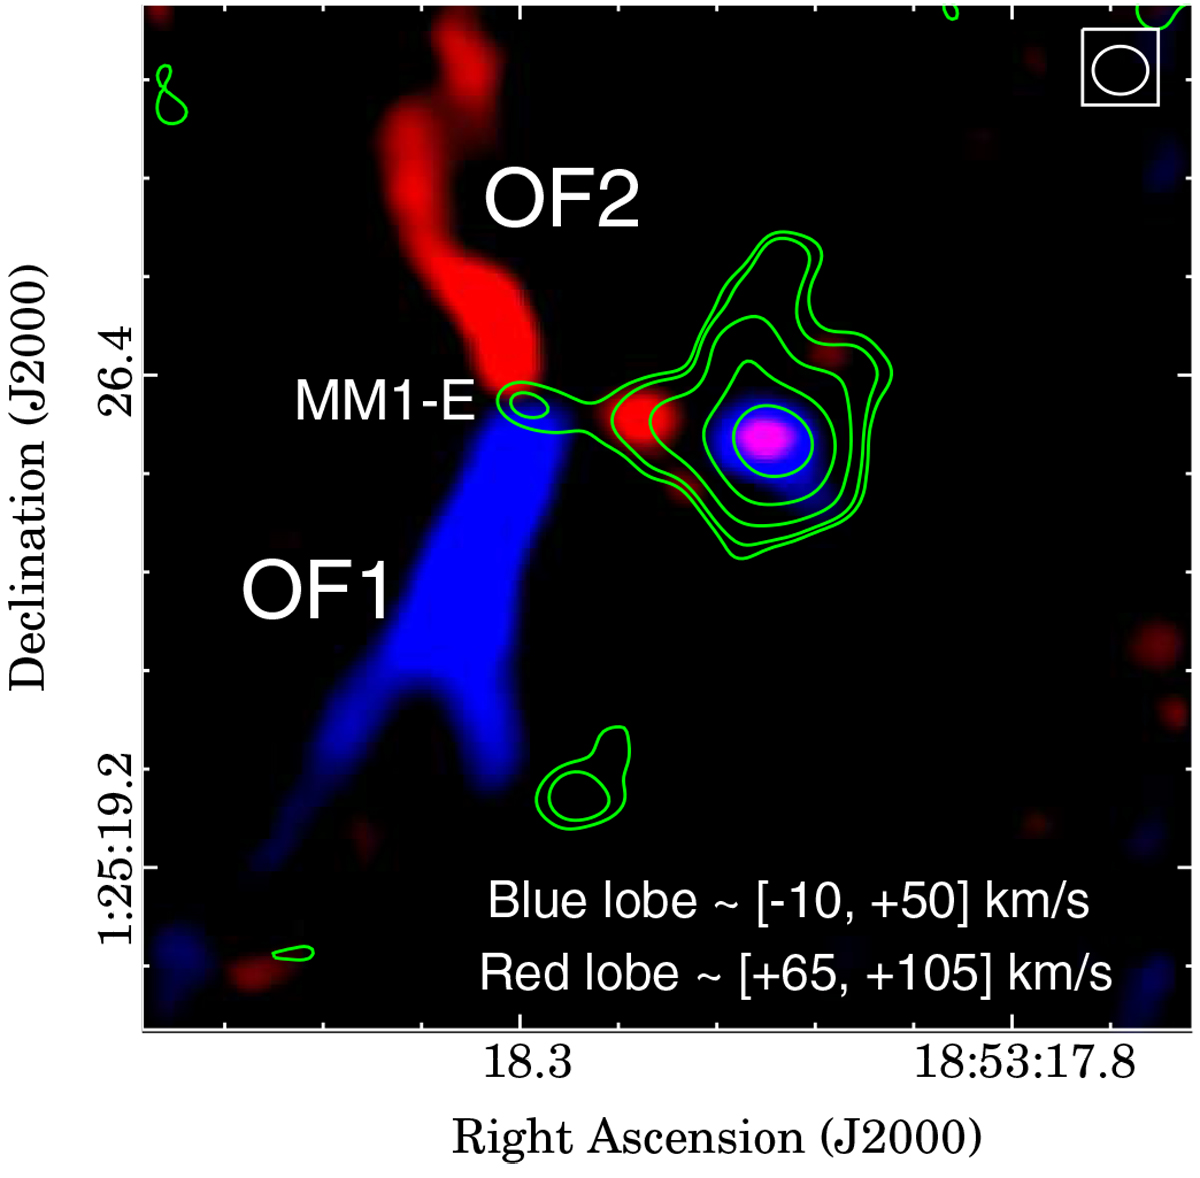
12CO J = 3–2 emission distribution integrated between −10 and +50 kms−1 (OF1, in blue) and between +65 and +105 km s−1 (OF2, in red). The green contours represent the radio continuum emission at 334 GHz; the levels are at 30, 50, 100, 250, and 700 mJy beam−1. The beam isindicated in the top right corner.
Current usage metrics show cumulative count of Article Views (full-text article views including HTML views, PDF and ePub downloads, according to the available data) and Abstracts Views on Vision4Press platform.
Data correspond to usage on the plateform after 2015. The current usage metrics is available 48-96 hours after online publication and is updated daily on week days.
Initial download of the metrics may take a while.