Fig. 9
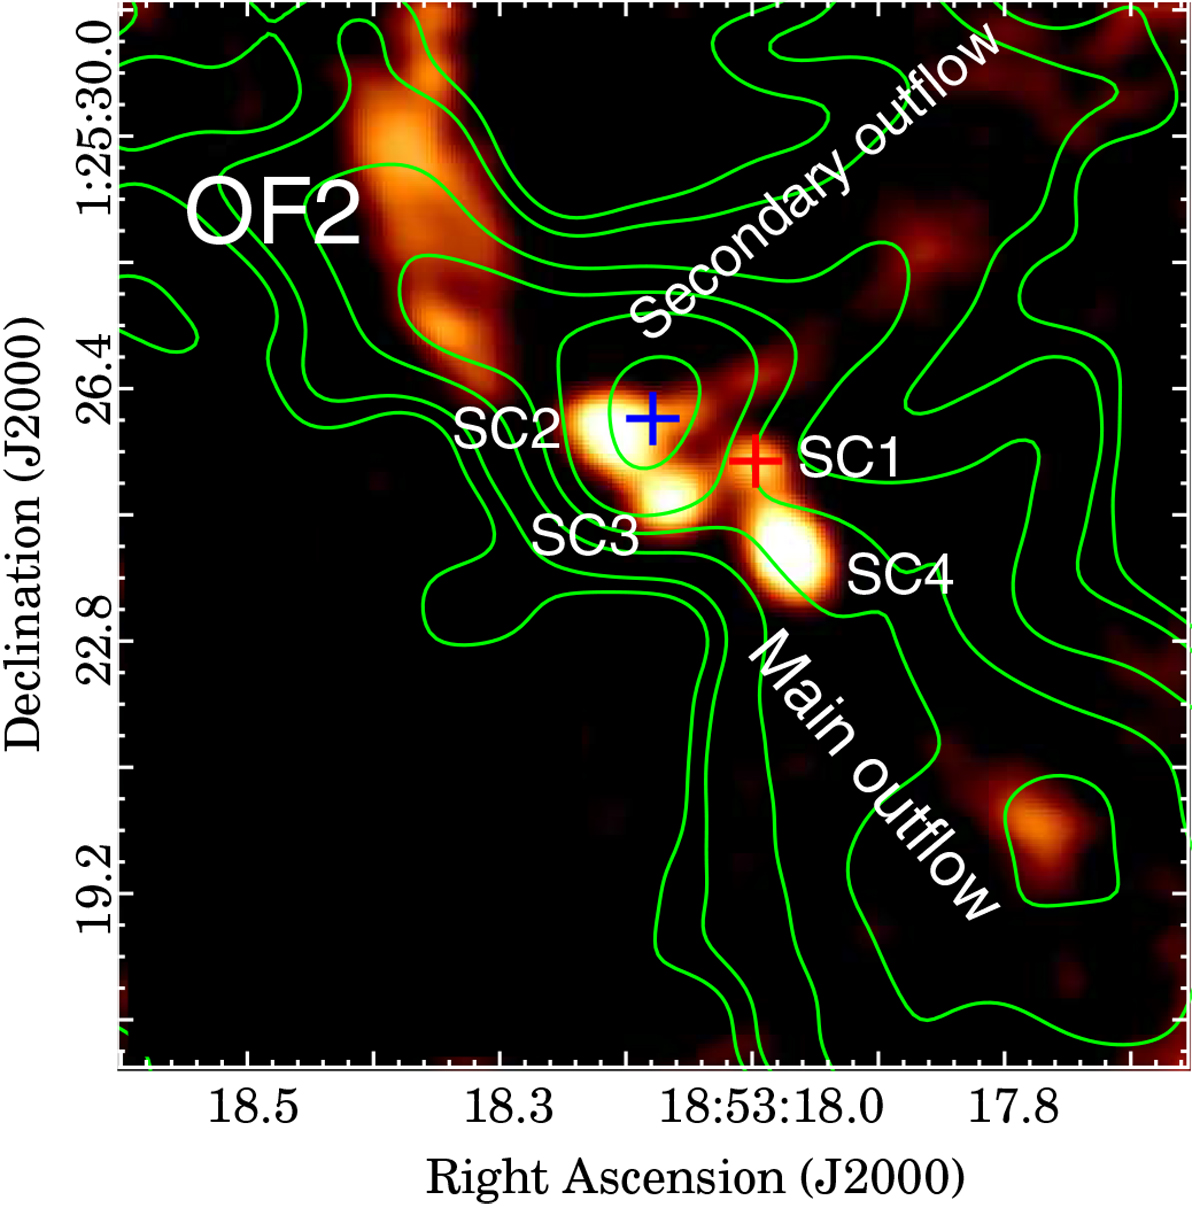
12CO J = 3–2 emission distribution integrated between +70 and +75 km s−1. This velocity range was chosen to highlight the secondary outflow arising from SC2. Contours correspond to the HCO+ J = 1–0 emission distribution integrated between 40 and 75 km s−1. Levels are at 0.1, 0.2, 0.3, 0.5, 0.6, and 0.9 Jy beam−1 km s−1. The red cross indicates the peak of the radio continuum emission at 1.3 cm (Rosero et al. 2016). The blue cross represents the position of the emission peak of the integrated HCO+ J = 1–0 emission.
Current usage metrics show cumulative count of Article Views (full-text article views including HTML views, PDF and ePub downloads, according to the available data) and Abstracts Views on Vision4Press platform.
Data correspond to usage on the plateform after 2015. The current usage metrics is available 48-96 hours after online publication and is updated daily on week days.
Initial download of the metrics may take a while.