Fig. 6
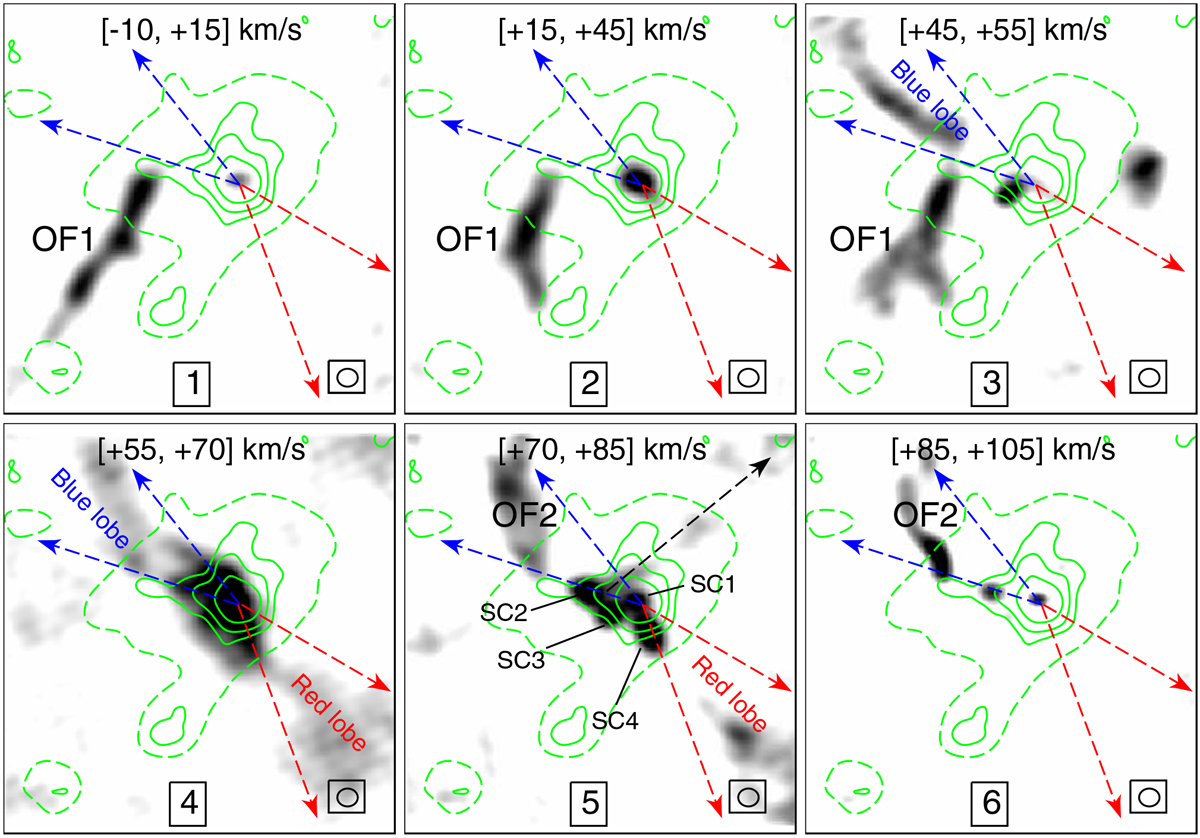
Integrated velocity channel maps of the 12CO J = 3−2 emission. The integration velocity range is exhibited at the top of each panel. The gray scale goes from 2 Jy beam−1 km s−1 (about 3σ rms noise of an averaged channel map) to 10 Jy beam−1 km s−1. The green contours represent the continuum emission at 334 GHz; the levels are at 30, 200, and 400 mJy beam−1. The dashed contour represents the 3σ rms noise level of the radio continuum emission at 93 GHz. The beam is indicated in the bottom right corner of each map.
Current usage metrics show cumulative count of Article Views (full-text article views including HTML views, PDF and ePub downloads, according to the available data) and Abstracts Views on Vision4Press platform.
Data correspond to usage on the plateform after 2015. The current usage metrics is available 48-96 hours after online publication and is updated daily on week days.
Initial download of the metrics may take a while.