Fig. 4
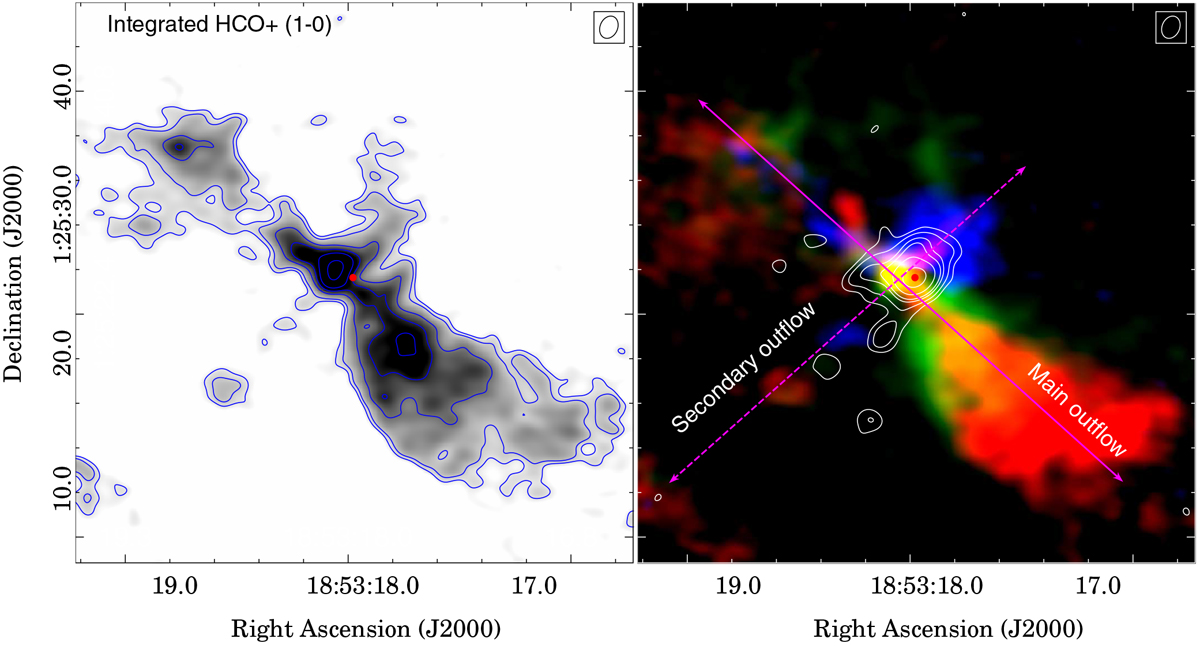
Left panel: HCO+ J = 1–0 line emission distribution integrated between 40 and 75 km s−1. The gray scale goes from 0.1 to 0.6 Jy beam−1 km s−1. The blue contours are at 0.1, 0.2, 0.3, 0.5, 0.6, and 0.9 Jy beam−1 km s−1. Right panel: three-color image of the HCO+ J = 1–0 line emission integrated over three velocity intervals: [43, 53], [53, 63], and [63, 73] km s−1, shown in blue, green, and red, respectively. The solid and dashed lines indicate the direction of the main outflow and the perpendicular outflow, respectively. White contours represent the radio continuum emission at 93 GHz. Levels are at 1, 2, 4, 5, 12, and 30 mJy beam−1. The red filled circle indicates the position of the radio continuum emission at 1.3 cm detected by Rosero et al. (2016). The beam isindicated in the top right corner of each panel.
Current usage metrics show cumulative count of Article Views (full-text article views including HTML views, PDF and ePub downloads, according to the available data) and Abstracts Views on Vision4Press platform.
Data correspond to usage on the plateform after 2015. The current usage metrics is available 48-96 hours after online publication and is updated daily on week days.
Initial download of the metrics may take a while.