Fig. 2
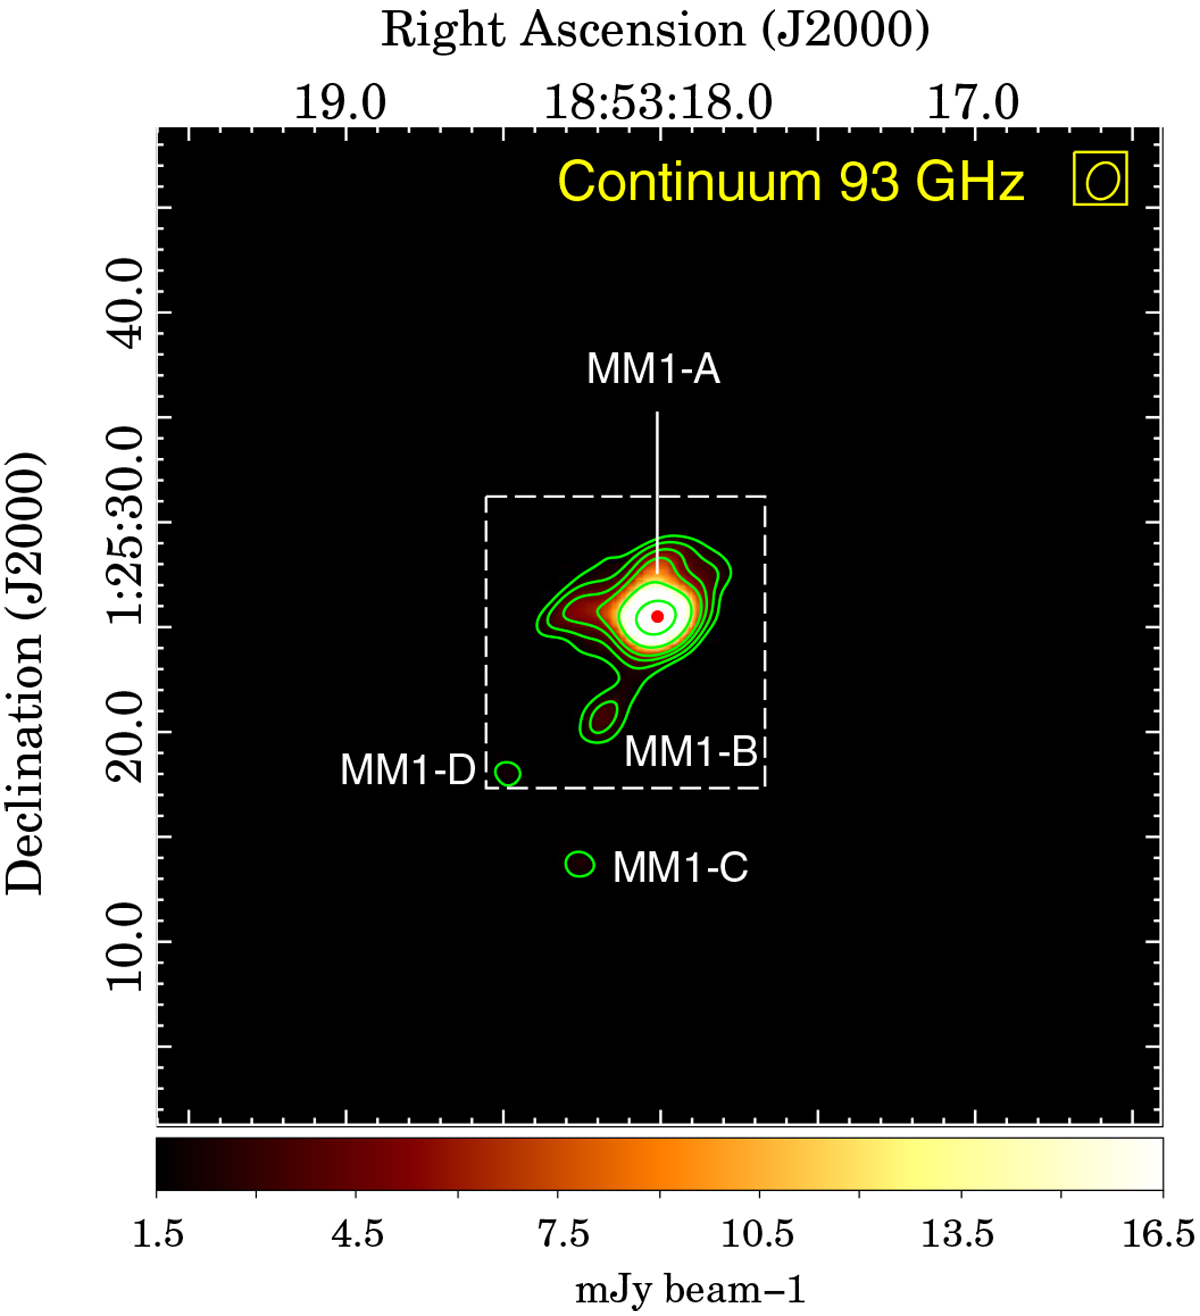
Radio continuum emission at 93 GHz. The color scale goes from 1.5 (about 5σ rms noise level) to 16.5 mJy beam−1. The contour levels are at 1.5, 2.5, 4, 5, 12, 30 mJy beam−1. The red filled circle indicates the position and extension (up to 3σ rms noise level) of the radio continuum emission at 1.3 cm detected by Rosero et al. (2016). The white box indicates the region mapped at 334 GHz. The beam is indicated in the top right corner.
Current usage metrics show cumulative count of Article Views (full-text article views including HTML views, PDF and ePub downloads, according to the available data) and Abstracts Views on Vision4Press platform.
Data correspond to usage on the plateform after 2015. The current usage metrics is available 48-96 hours after online publication and is updated daily on week days.
Initial download of the metrics may take a while.