| Issue |
A&A
Volume 649, May 2021
|
|
|---|---|---|
| Article Number | A63 | |
| Number of page(s) | 27 | |
| Section | Extragalactic astronomy | |
| DOI | https://doi.org/10.1051/0004-6361/202039443 | |
| Published online | 12 May 2021 | |
Optical emission lines in the most massive galaxies: Morphology, kinematics, and ionisation properties
1
Leibniz-Institut für Astrophysik Potsdam (AIP), An der Sternwarte 16, 14482 Potsdam, Germany
e-mail: This email address is being protected from spambots. You need JavaScript enabled to view it.
2
ESO, European Southern Observatory, Karl-Schwarzschild Str 2, 85748 Garching bei Muenchen, Germany
3
Leiden Observatory, Leiden University, PO Box 9513, 2300 RA Leiden, The Netherlands
4
Instituto de Astrofísica e Ciãncias do Espaço, Universidade do Porto, CAUP, Rua das Estrelas, 4150-762 Porto, Portugal
5
Institut für Astrophysik, Universität Göttingen, Friedrich-Hund Platz 1, 37077 Göttingen, Germany
Received:
15
September
2020
Accepted:
9
December
2020
Abstract
In order to better characterise the upper end of the galaxy stellar mass range, the MUSE Most Massive Galaxies (M3G) Survey targeted the most massive galaxies (M > 1012 M⊙) found in the densest known clusters of galaxies at z ∼ 0.046. The sample is composed of 25 early-type galaxies: 14 brightest cluster galaxies (BCGs), of which 3 are in the densest region of the Shapley super cluster (SSC), and 11 massive satellites in the SSC. In the present work we use MUSE data to derive the spatial distribution and kinematics of the gas and discuss its ionisation mechanism and origin in the optical wavelength range. We fit the continuum of the spectra using an extensive library of single stellar population models and model the emission lines employing up to three Gaussian functions. In the M3G sample, ionised gas was detected in five BCGs, of which one is in the densest region of the SSC, and six massive satellites in the SSC. Among these objects, [O I] and [N I] were detected in three BCGs and one satellite. The gas is centrally concentrated in almost all objects, except for two BCGs that show filaments and two massive satellites with extended emission. Moreover, the emission line profiles of three BCGs present redshifted and/or blueshifted components. The presence of dust was revealed by analysing Balmer line ratios, obtaining a mean E(B − V) of 0.2–0.3. The emission-line diagnostic diagrams show predominately low-ionisation nuclear emission-line regions line ratios with little contamination from star formation. In the M3G sample, the gas was detected in 80% of fast rotators and 35% of slow rotators. The orientations of stellar and gaseous rotations are aligned with respect to each other for 60% of satellites and 25% of BCGs. The presence of misalignments points to an external origin of the gas for three BCGs and two satellites. On the other hand, some of these systems are characterised by triaxial and prolate-like stellar rotation, which could support an internal origin of the gas even in the case of misalignments.
Key words: galaxies: kinematics and dynamics / galaxies: elliptical and lenticular, cD / galaxies: ISM / galaxies: clusters: general
© ESO 2021
1. Introduction
The most massive early-type galaxies (ETGs) are rare objects in the local Universe and they represent the end point of the galaxy mass assembly. Most ETGs are giant ellipticals or lenticulars that stopped forming stars at z ∼ 2 (Thomas et al. 2005; McDermid et al. 2015), but at lower z these ETGs continued their evolution via dry mergers and minor accretion events of satellite systems (van Dokkum et al. 2008; Thomas et al. 2014), as also indicated by simulations (e.g., Oser et al. 2012; Laporte et al. 2013; Wellons et al. 2015; Cooke et al. 2019) and current analyses of stellar populations with integral-field spectroscopy (e.g., Greene et al. 2015, 2019; Edwards et al. 2020). According to present numerical simulations, these systems are likely the result of dissipation-less equal-mass mergers (Łokas et al. 2014; Ebrová & Łokas 2015; Tsatsi et al. 2017; Li et al. 2018). After z ∼ 2, massive ETGs grew from one major merger event around z ∼ 1, while brightest cluster galaxies (BCGs) are more likely to be built by more than one minor merger. In the local Universe, massive ETGs are characterised by low star formation rates (Ford & Bregman 2013) and are typically devoid of interstellar medium, but have a large amount of X-ray emitting hot gas in their halo (Ellis & O’Sullivan 2006; Kormendy et al. 2009; Goulding et al. 2016). Most ETGs are located in dense environments, also as the brightest members of groups or clusters (BCGs), while few of them are groupless (Ma et al. 2014). The galaxy population with stellar mass M⋆ ≳ 2 × 10¹¹ M⊙ is dominated by slow rotators (Cappellari et al. 2013; Veale et al. 2017).
The gas content of massive ETGs is poorly constrained given that for decades these objects were thought to be characterised by a negligible amount of gas and the study of their evolution was mainly focussed on stellar properties. Recently, the MASSIVE survey (Ma et al. 2014) provided interesting insights into the gas distribution and properties in galaxies (isolated or in groups) more massive than 1011.5 M⊙ within 108 Mpc. In particular, Davis et al. (2016) showed that 10% of those objects have cold gas, which is at least a factor of two less than among less massive ETGs (Young et al. 2011). Goulding et al. (2016) presented hot-gas properties of 33 early-type systems exploiting archival Chandra X-ray observations. Warm ionised gas was detected in 80% of massive fast rotators but only in 28% of massive slow rotators. In most of these massive galaxies, this gas is centrally concentrated (∼61%) and in some cases is extended and shows clear rotation (∼29%) or patchy distribution (∼3%). Its origin is driven by various physical processes such as external accretion, cooling from the hot halo, or outflow driven by the active galactic nucleus (AGN; Pandya et al. 2017).
In contrast, more studies focussed on probing the gas content of BCGs, mostly as a consequence of their unique status within clusters. A small fraction of BCGs presents optical emission lines (∼15%) and the presence of the gas is not correlated with the galaxy mass and cluster velocity dispersion (Edwards et al. 2007). Moreover, BCGs are characterised by various ionised-gas morphologies: centrally concentrated, extended, or filamentary (McDonald et al. 2012). Recent gas accretion and star formation events are usually related to the X-ray cooling core status (Bildfell et al. 2008; Edwards et al. 2020). Indeed, most of BCGs at the centre of the so-called cooling flow (CF; Fabian 1994; Peterson & Fabian 2006) clusters show optical emission lines (Edwards et al. 2007; Cavagnolo et al. 2008; Tremblay et al. 2015). This points to a close link between the central regions of BCGs and the galaxy cluster halo. In particular, the origin of Hα filaments observed within BCGs is strongly related to soft X-ray emission (McDonald et al. 2010). The CF mechanism is balanced by AGN feedback that slows and eventually reheats the cooling gas in the cores of clusters, driving the evolution of these objects (Hamer et al. 2016; Gaspari et al. 2018) given that CFs can explain only some of the star formation activity in BCGs (Groenewald & Loubser 2014).
Both massive ETGs and BCGs show line ratios from low-ionisation nuclear emission-line regions (LINERs) rather than ionisation from star formation (Von Der Linden et al. 2007; Loubser & Soechting 2013; Pandya et al. 2017), which rarely characterises these objects. Moreover, most ETGs present reservoirs of diffuse ionised gas (DIG; Papaderos et al. 2013) over kiloparsec scales with low-ionisation emission-line regions (LIERs) ratios (Belfiore et al. 2016; Gomes et al. 2016). The DIG is likely to be mainly ionised by hot post-asymptotic giant branch (pAGB) stars (Byler et al. 2019).
In this work, we present the optical emission line analysis of the ETGs of the MUSE Most Massive Galaxies (M3G; PI: Emsellem; see Krajnović et al. 2018) observed with the Multi-Unit Spectroscopic Explorer (MUSE; Bacon et al. 2010). These galaxies are located in the densest known nearby clusters and suitable to better characterise the upper end of the galaxy stellar mass range (M⋆ > 1012 M⊙). This work provides key information on the gas properties of both massive satellites, for which the gas content is poorly constrained and for BGCs of rich nearby clusters.
The paper is organised as follows. In Sect. 2 we present the M3G sample, previous results, and the data reduction of the MUSE spectra. In Sect. 3 we describe the spectral fitting procedure and in Sect. 4 we present the spatially resolved gas distribution, kinematics, fluxes, and extinction. We report the presence of misalignments between the orientation of the gaseous and stellar rotation in Sect. 5 and we study the ionisation mechanism by exploiting the flux emission line ratios in Sect. 6. Finally, we discuss the possible scenarios of the origin of the gas in each object in Sect. 7 and we draw conclusions in Sect. 8.
2. M3G sample and data reduction
The M3G survey is composed of 25 massive ETG that were selected such that one MUSE pointing would cover approximately 2 Re (based on 2MASS Re values), with Mk < −25.7 mag in the 2MASS Ks-band, which ensures that their masses are M⋆ > 1012 M⊙. They are characterised by a redshift range 0.037 < z < 0.054, with a mean of z = 0.046. The galaxies are divided into two subsamples. The first comprises 14 galaxies selected to be the BCGs in clusters richer than the Virgo cluster. The other 11 are located in the core of the Shapley super cluster (SSC), centred around the three BCGs (from the BCG subsample) in the Abell (Abell et al. 1989) clusters, which make up the core of the SSC (Abell 3562, Abell 3558, and Abell 3556). About half of these galaxies are characterised by rotation around the major axis and stellar kinematic misalignment angles close to 90° (Krajnović et al. 2018).
Unfortunately, the telluric sky lines fall in the wavelength range including Hα, [N II] and/or [S II] lines, depending on the redshift of each galaxy. As a consequence, an accurate (as much as possible) telluric correction is crucial to properly measure the weak emission lines. We produced the reduced datacubes as in Krajnović et al. (2018) with the standard data reduction MUSE pipeline (Weilbacher et al. 2020) but we did not apply the sky telluric line correction step. The resulting datacubes were characterised by prominent telluric lines that were in turn removed with MOLECFIT (Smette et al. 2015). This software computes a theoretical absorption model based on a radiative transfer code and an atmospheric molecular line database. The telluric spectra obtained with MOLECFIT were then divided by each spectrum in the datacube.
This analysis was aimed at obtaining a better telluric correction. As a result of the lack of dedicated observations of telluric stars, Krajnović et al. (2018) conducted the telluric correction with the standard pipeline using standard stars. The residuals that resulted from that correction were still strong and could significantly influence the measurements of weak emission lines. On the contrary, the residuals from MOLECFIT procedure, while not completely absent, are weak and do not show a specific structure (i.e. mimicking emission-lines) allowing us to clearly detect even the weakest emission lines in most of spectra.
The cubes were Voronoi binned (Cappellari & Copin 2003), as described in Krajnović et al. (2018), by considering the signal-to-noise ratio (S/N) between 5500 Å and 5700 Å. The target S/N was set to 50 for all galaxies. The galaxy spectra were dereddened by correcting for Galactic extinction employing E(B − V) values calculated from Schlegel et al. (1998) maps (see Table 1), the extinction law from O’Donnell (1994) and RV = 3.1.
Details of the galaxies with gas.
3. Fitting procedure
3.1. Stellar continuum
The stellar continuum was fitted with the penalized pixel fitting (pPXF; Cappellari & Emsellem 2004; Cappellari 2017) method. We employed the MILES simple stellar population models (Vazdekis et al. 2010) built with an Unimodal initial mass function (IMF) with slope 1.3 (equivalent to a Salpeter IMF) and Padova isochrones (Girardi et al. 2000), and convolved to the MUSE line-spread function (LSF) provided by Guérou et al. (2017). The line-of-sight velocity distribution (LOSVD) was parametrised by Gauss-Hermite polynomials (Gerhard 1993; van der Marel & Franx 1993) with the mean velocity V, velocity dispersion σ, and the higher order moments h3 and h4. Krajnović et al. (2018) used a stellar optimal template, that is the linear combination of templates obtained from a pPXF fit on the spectrum resulted from the sum of all spectra within one effective radius, to fit each spectrum. In contrast, we employed the entire library on each galaxy spectrum in order not to bias the flux emission line measurement. We exclusively included multiplicative polynomials in the fitting process to account for flux calibration-related variations. Additive polynomials would risk biasing lines like Hβ leading to the use of very young templates, for example.
3.2. Emission lines
We developed a procedure (see Sects. 3.2.1 and 3.2.2) to properly fit both separated and blended lines with one or more velocity components. To model these, we employed Gaussian functions convolved to the MUSE LSF (Guérou et al. 2017). For some galaxies the emission line profiles were simply fitted with a single Gaussian, while in other cases multiple Gaussians were required (see Sect. 3.2.1).
3.2.1. Emission lines with one component
The stellar LOSVD obtained from pPXF fit was provided as input to the Gas and Absorption Line Fitting (GANDALF; Sarzi et al. 2017) algorithm to model the emission lines with Gaussian functions. This procedure simultaneously fits stellar continuum and emission lines, allowing us to properly detect even the weakest emission lines. At this stage, the reddening correction was not applied, but multiplicative polynomials of the fourth order were used to adjust the continuum and correct bad flux calibration in the telluric spectral range so as not to overestimate the emission line flux.
To identify which galaxies presented gas emission, we firstly fitted all the M3G Voronoi binned cubes with this technique. Gas emission lines were detected in 11 galaxies (see Table 1). More details about the detection threshold can be found in Sect. 4.1. These objects show a variety of emission line morphologies: (i) weak, (ii) strong and narrow, or (iii) strong and broad emission lines. This procedure was successful for PGC 047197, PGC 047273, PGC097958 (satellites in Abell 3558), PGC 046860, and PGC 047590 (satellites in Abell 3556 and Abell 3562, respectively), PGC 047202 and PGC 065588 (BCGs of Abell 3558 and Abell 3716, respectively). All of the emission lines of these galaxies were modelled well with one Gaussian function only.
3.2.2. Emission lines with more than one component
The fitting procedure described in Sect. 3.2.1 was not successful for most of spectra with blended emission lines characterised by more than one velocity component. This was the case of the emission lines in the central regions of PGC 015524 (BCG of Abell 0496), PGC 049940 (BCG of Abell 1836), PGC 073000 (BCG of Abell 4059), and PGC 047177 (satellite in Abell 3558).
Hereafter, we refer to the gas velocity components that are rotating (regularly or affected by filaments) and in general narrower with respect to the others as “first” components. We refer to the gas velocity components that are redshifted or blueshifted with respect to the “first” component as “red/blueshifted” components, and to the broad line region (BLR; v ∼ 1000 km s−1) Hα components as “broad” components. In the case of PGC 047177, we refer to the broader component as “second” component, since it is not red/blueshifted with respect to the first component.
Since the emission lines with multiple components were all confined close to the galaxy centre, we defined a circular spatial region that encloses all the spectra with multiple component line profiles. These spectra were fitted with a sum of Gaussian functions, after having subtracted the pPXF continuum. To carry out this analysis we developed a procedure based on MPFIT IDL1 routine (Markwardt 2009). The spectra outside the circular region were fitted with the procedure described in Sect. 3.2.1 to properly detect the weakest emissions by simultaneously fitting stellar continuum and emission lines.
This new procedure allows us (i) to fit up to three Gaussian components for each line; (ii) to tie the kinematics and flux ratios between lines; (iii) to fix the line velocities of the nuclear bins (within the PSF) to that of the central bin if required; (iv) to measure the kinematics of a single line or doublet (e.g., Hβ and [S II], respectively), and then keep it fixed during the fit of other lines to reduce the degeneration of parameters for blended lines (e.g., Hα and forbidden lines, respectively); and (v) to limit the range of variation of the values of all parameters in the fit, which is crucial to deal with possible exchange of Gaussian components during the fit of blended lines. We tied the intensity ratios between the [O III]λ4959 and [O III]λ5007, [N I]λ5197 and [N I]λ5200, [O I]λ6300 and [O I]λ6364, and [N II]λ6548 and [N II]λ6583 lines (see Osterbrock & Ferland 2006), while keeping the ratio of the Balmer lines free to allow for the reddening correction. To reduce the degeneracy between parameters but still assure a good fit, the number of Gaussian components was kept as low as possible. More than one component was employed only in the case of complex non-Gaussian line profiles highlighted by large residuals (and high χ2/d.o.f. values) resulting from the one-component fit. The fit was visually inspected in case of strongly blended lines for which a χ2-based selection of the number of Gaussians could lead to fits that are not physically justified.
Figure 1 shows some examples of the results obtained from the fitting procedure applied in the central circular region. In the following, we describe the adopted assumptions and number of Gaussian components employed for each galaxy.
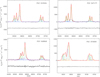 |
Fig. 1. Continuum-subtracted MUSE spectra (black solid line) with best-fitting model (red solid line) obtained by adopting first (green lines), blueshifted and second (blue lines), redshifted (orange lines), and broad (purple lines) components for the [N II], Hα, and [S II] lines. The Gaussian components of the same line are characterised by the same pattern. The residuals are defined as the difference between the observed and model spectrum. They are shifted to an arbitrary zero point for viewing convenience. The galaxy name is reported within each panel. |
PGC 015524. Most of the ionised-gas emission lines within ∼5″ from the centre were fitted with two Gaussian components (see Fig. 1) while the [N I] and [O I] emission lines were properly fitted with one component only. The second component is blueshifted with respect to the first component of about 100 km s−1. Owing to degeneracy between parameters in blended lines, we forced each blueshifted component to have the same velocity and velocity dispersion for all the emission lines and in bins within the PSF we imposed the same velocities of the central bin.
PGC 047177. The ionised-gas emission lines were fitted with two components (see Fig. 1) while [N I] with only one Gaussian component (no [O I] was detected). In this case, the broader Gaussian component is not red/blueshifted (see Fig. A.5), so we refer to it as second component. The velocity and velocity dispersion of Balmer and forbidden lines were fitted independently. To break the degeneracy between parameters, in the bins with two velocity components, firstly the [S II] lines were fitted and then their kinematics were imposed to other forbidden lines during the fit. It was not possible to apply the same procedure to Balmer lines by previously fitting Hβ because the Hβ second component was detected in very few of the cases, probably because of extinction or some degeneracy between absorption and emission.
PGC 049940. This galaxy shows very broad emission lines in the nuclear region, associated with the putative supermassive black hole (3.61 × 10⁹ M⊙; Dalla Bontà et al. 2009). In addition, the presence of a redshifted component, well visible in more external bins but also detected in the innermost bins thanks to the good S/N, makes this fit not so straightforward. The fit of the Hα and [N II] blended lines was very challenging in the nuclear region where, in addition to first components, one redshifted component for each line plus a broad Hα component (see Fig. 1) were employed. The fit was less degenerate in the outer bins where the broad Hα component disappears. In the nuclear bins, the [S II] lines were fitted and their kinematics were fixed during the fit of the other forbidden lines. Hβ was not exploitable for this aim since it was strongly extincted, probably due to the dust filament close to the nucleus, which is also visible in HST images.
PGC 073000. Most of the line profiles within 2″ are characterised by three velocity components (see Fig. 1). The first (and rotating) component is the more spatially extended, the second component is blueshifted while the third is redshifted with respect to the first. While the velocity dispersion of the blueshifted component was similar to that of the first component (∼150 km s−1), the redshifted component was significantly broader (∼250 km s−1) and spatially confined to the central region. Owing to the complexity of the fit and degeneracy between parameters in blended lines, we forced each velocity component to have the same velocity and velocity dispersion for all the emission lines. The three velocity components were strongly blended in the bins within a region comparable in size of the PSF (∼1″), while more separated in the outer central region. Hβ was not exploitable to reduce the degeneracy of parameters, since the redshifted component was not detected for most of bins.
4. Results
4.1. Extraction
The values of the parameters of each emission line were extracted to build spatially resolved maps of fluxes, velocity, velocity dispersion, and amplitude-to-noise ratio (A/N). Figures 2 and 3 show the stellar velocity maps along with the maps pertaining to [N II] emission, while the maps of all the detected emission lines are shown in the Appendix A.
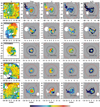 |
Fig. 2. Spatially resolved maps of stellar velocities, [N II] flux, kinematics, and A/N for the 5 BGCs with detected gas. The first component only is shown for those galaxies with emission lines with more than one component (those denoted with 1 in the upper right corner of the flux maps of the gas). Left to right: stellar velocities in km s−1, [N II] flux in log 10−20 erg s−1 cm−2 arcsec−2, velocities in km s−1, velocity dispersions in km s−1, and A/N ratio. The maximum and minimum values adopted in the colour bar are reported in each panel between square brackets. Black and red contours are isophotes in steps of one magnitude. The outermost isophote of the gas maps is enhanced in red to make the spatial region of the gas immediately visible on the stellar velocity panel. Up to down: spatially resolved maps of PGC 015524, PGC 047202, PGC 049940, PGC 065588, and PGC 073000. |
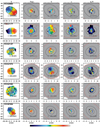 |
Fig. 3. Same as in Fig. 2, but for the 6 massive satellites. Up to down: spatially resolved maps of PGC 046860, PGC 047177, PGC 047197, PGC 047273, PGC 047590, and PGC 097958. |
The A/N provides us with an estimate of the accuracy with which we can measure the line parameters. This strongly depends on how much the line sticks out with respect to the noise in the continuum or telluric residuals. As already mentioned before, the telluric residuals fall in the spectral range of [N II], Hα and/or [S II] lines, depending on the redshift. After the fit, the A/N of these lines was re-calculated by considering the noise in the spectral range of the lines. As a result, we derived lower A/N values with respect to those obtained from the GANDALF fit for those bins in which the telluric residuals were at the same level of the emission line signal. The bins with A/N lower than 3 were discarded and considered as telluric residuals rather than actual emission lines. The same A/N threshold was also considered for the other emission lines. Finally, the errors associated with the parameters were computed with MonteCarlo simulations fitting (for each bin) 200 spectra with additional random noise and considering the σ of the Gaussian distribution of values of parameters obtained from the fit.
4.2. Gas distribution and kinematics
In this section we describe the spatially resolved maps shown in Figs. 2 and 3 and Appendix A. We subtracted the stellar systemic velocity from the velocity maps of the gas. As already pointed out in Sect. 3.2, PGC 015524, PGC 047177, PGC 049940, and PGC 073000 present lines with more than one velocity component, while PGC 046860, PGC 047197, PGC 047202, PGC 047273, PGC 047590, PGC 065588, and PGC 097958 lines with one detected velocity component only.
The peak of the emission flux corresponds nearly or exactly to the photometric centre in all the galaxies. Only for PGC 015524 and PGC 073000, there is no clear emission peak but a more extended high flux spatial region, probably due to the perturbed gas distribution.
Considering the M3G sample, ∼28% of BCGs and ∼64% of massive satellites of the SSC contain ionised gas. [O I] and [N I] were detected only in the four galaxies with multi-component line profiles. Overall, the strongest and most spatially extended emission comes from [N II] lines (see Figs. 2 and 3), which are the only lines detected in PGC 046860, PGC 047197, and PGC 097958.
In case of multiple velocity components, most of the flux is emitted from the first. The ionised gas of the first component is centrally concentrated in three of the BCGs (PGC 047202, PGC 049940, and PGC 065588), while extended with outward filaments in the remaining two (PGC 015524 and PGC 073000). In particular, the filaments of PGC 015524 are stretched towards the north-east direction with respect to the centre and their morphology is the same for all emission lines, even if with different spatial extents. [O I] and [N I] follow the ionised-gas distribution, even if they are less spatially extended. PGC 073000 presents one thick filament in the east direction that is clearly visible in the [N II] and [S II] lines, while barely detectable in Balmer and [O III] lines and not at all present in [O I] and [N I] spatial maps. Moreover, a “swelling” appears in the south-west direction in all of the maps.
The gas is centrally concentrated in most of satellites (PGC 046860, PGC 047177, PGC 047197, PGC 047590, and PGC 097958). In PGC 047273, the gas appears to be distributed in a strongly tilted polar disc settled close to the minor axis. In the outskirts the disc-like structure bends in opposite directions towards the major axis plane, especially in the [O III] and [S II] spatially resolved maps. [N II] and Hα emissions are not spatially extended outwards like the others owing to the strong telluric residuals still present after the correction, which prevented us from considering the most external bins as reliable. The A/N spatial distribution is peculiar with lower values in the centre that gets higher along and within the disc and decrease again outwards.
Concerning the velocity field of the BCGs, the gas of the first component is regularly rotating in PGC 049940 and PGC 065588, while not showing rotation in PGC 047202. The velocity structure in PGC 015524 does not appear as a simple rotation pattern; this is an expected feature considering the filamentary appearance of its distribution. In PGC 073000, a more structured velocity pattern appears, while still far from being regular. The velocity dispersion has a clear peak in the centre of PGC 065588 (up to about 500 km s−1), while it reaches values of about 300, 250 km s−1 for PGC 047202 and PGC 049940, respectively, not showing a clear nuclear raise. In the case of PGC 015524, the velocity dispersion presents a peak in the nucleus (∼200 km s−1) and is lower within the filaments (less than 100 km s−1) with respect to their edges (∼150 km s−1), suggesting that the gas is moving along the filaments generating more turbulent motions at their edges. The gas velocity dispersion map of PGC 073000 shows elevated values near to the centre (∼250 km s−1) and another rise in the south-west region (∼150 km s−1). It is low in the filament (less than 100 km s−1) suggesting that this object is in a later and more relaxed stage of gas accretion with respect to that in PGC 015524.
In satellites, the gas is clearly rotating in PGC 047590; the gas seems to be in rotation in PGC 097958 and PGC 047197, while it does not show any rotation in PGC 046860. These four galaxies present a central peak in gas velocity dispersion (∼300 km s−1). The gas rotation in PGC 047177 is slightly perturbed, especially in the inner 2″. Looking at forbidden lines, the velocity dispersion is lower in the central region and increases going outwards. Finally, the polar gas disc in PGC 047273 rotates nearly around the major axis and the velocity slightly decreases in the outer regions, where the disc is probably bending towards the major axis plane. The velocity dispersion is higher in the centre (∼300 km s−1) and decreases outwards (less than 100 km s−1) as expected in a disc structure.
Overall, the emission from the red/blueshifted components is more centrally concentrated with respect to that from the first component. The blueshifted component of PGC 015524 (Fig. A.2) is less spatially extended than the first, suggesting that the ionisation source is located close to the centre. It shows a shallow velocity gradient that is not coupled to that of the first component in that spatial region and high-velocity dispersion values especially in the centre that suggests the presence of biconical outflows (Veilleux et al. 2005). The second component of PGC 047177 (Fig. A.5) is more confined with respect to the first. This component is characterised by a large velocity dispersion (∼400 km s−1 for [N II]) and a slightly negative velocity going outwards. The redshifted (of ∼300 km s−1 with respected to the first) component of PGC 049940 (Fig. A.11) is characterised by a velocity dispersion rising in the centre up to nearly 500 km s−1 and may be associated with an AGN-driven inflow or outflow of gas. It is more centrally concentrated than the first component even if the spatial scales are comparable. The broad (σ ∼ 1000 km s−1) component (Fig. A.12) results from the BLR of the host galaxy. The blueshifted component of PGC 073000 (Fig. A.15) may be interpreted as a large-scale (up to nearly 4 kpc) outflow of gas at about 200 km s−1. The velocity dispersion increases going outwards where the gas velocity is slowing down. On the contrary, the redshifted component (Fig. A.16) is less extended (∼1 Kpc), broader, and is approaching us at about 400 km s−1.
4.3. Ionised gas masses
We estimated the masses of the gas using the same approach as in Sarzi et al. (2006). We assumed a case B recombination, a temperature of T = 104 K, an electron density of ne = 102 cm−3, and V3K distances (D) from NED obtained with H0 = 70 km s−1 Mpc−1 (except the distance to PGC 097958, which is from Hyperleda). Since our targets do not exhibit significant ongoing star formation, we assumed a constant ionised-gas density and used the Kim (1989, page 665) formula to estimate the masses as follows:
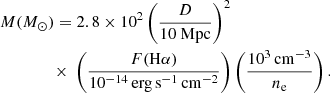 (1)
(1)
The masses were derived by considering the total flux of Hα for each galaxy and the V3k distance reported in NED (for PGC 097958 from HyperLeda). For PGC 046860, PGC 047197, and PGC 097958, we provide an upper limit for the mass by summing the residuals of each bin around Hα (50 Å) after having subtracted the stellar continuum. The resulting values are reported in Table 1.
Concerning actual estimates, the amount of gas spans a range between 105–5 × 10⁶ M⊙. Galaxies with filaments (PGC 015524 and PGC 073000) or spatially extended gas (PGC 047273 and PGC 047177) clearly contain more gas than those with a more centrally concentrated gas distribution (PGC 047202, PGC 047590, and PGC 049940). The upper limits for the mass of the gas are of the order of 104 M⊙. Except for PGC 015524 and PGC 073000, the amount of ionised gas in our galaxies is of the same order of the gas contained in MASSIVE galaxies (Pandya et al. 2017), even if not directly comparable since we used Hα rather than Hβ flux.
4.4. Reddening
We inspected the dust content exploiting the flux ratio of the first components of Balmer lines. We used the Calzetti extinction law (Calzetti et al. 2000) to derive the flux attenuation as a function of the wavelength at any value of E(B − V). We assumed for the Balmer decrement a case B recombination with a predicted Hα/Hβ ratio of 2.86 (Osterbrock 1989).
The reddening correction was performed on PGC 015524, PGC 047177, PGC 049940, and PGC 073000. The Balmer decrement was safely measured in those bins with A/N of Hβ larger than 3. It was not possible to inspect the dust content in the other sample galaxies since Hβ was not detected at all. In Fig. 4 are shown the E(B − V) spatially resolved maps.
 |
Fig. 4. Left to right: spatially resolved extinction maps of PGC 015524, PGC 047177, PGC 049940, and PGC073000 derived from the first line components. Their spatial extent is constrained by the detection of the Hβ line. The median errors for the extinction are 0.10, 0.18, 0.15, and 0.10, respectively. |
As can be seen, some extinction is present in all of these objects. PGC 015524 shows E(B − V) values up to 0.3 that are lower on average with respect to those found by Loubser & Soechting (2013). Notably, the E(B − V) is a bit higher in filaments. The extinction map of PGC 047177 reveals the presence of some dust in the centre with E(B − V) lower in the south-east than in the north-west spatial bins. Interestingly, the region with higher extinction corresponds to the spatial extent of a dip in the velocity dispersion values visible both in Hα and forbidden emission and discrepant velocities with respect to the background gas structure (see the velocity maps). This could point to the presence of a small central gas and dust disc, which counter-rotates with respect to the stars and gas at larger scales, even if it is a marginal feature given the shallow difference (∼50 km s−1) in the central velocities. PGC 049940 is characterised by high values of E(B − V) close to the nucleus. From HST/ACS images it is possible to see that there is a optically thick dust filament in the central part of the BCG. PGC 073000 shows an average value of E(B − V) of about 0.2 even if it raises up to 0.4 close to the centre and in the south-east region, corresponding to a X-ray arm (Choi et al. 2004).
5. Stellar versus gas orientation
We derived the global kinematic position angle of the gas (PAg) and compared it to that of the stars (PAs) provided by Krajnović et al. (2018). We measured PAg from the spatially resolved velocity map of the [N II]λ6583 emission line (of the first [N II]λ6583 component in the case of line profiles with multiple components) employing the procedure fit_kinematic_pa2 (see Krajnović et al. 2006, Appendix C) and obtained the results reported in Table 1. All the PAg were measured from north to east.
This analysis was not successful for PGC 046860, PGC 047197, and PGC 097958 since the spatial extent of the gas is limited to a few central bins. From a visual inspection, we inferred that in PGC 047197 and PGC 097958 the gas is rotating in a small (1″ of diameter) nuclear disc and that PAg is nearly aligned to PAs. As a consequence, we added these two galaxies to the subsample of objects with no kinematic misalignments. In PGC 047197, we are considering the PAs measured within 4″ from the centre, since the kinematics is very complex outwards (see Fig. 3). The gas in PGC 046860 and PGC 047202 does not exhibit a regular rotation pattern, thus it is not possible to define a PAg.
PGC 047177 presents discrepant velocities in the inner 2″ with respect to the outer gas. This did not influence the analysis since the inner gas is nearly “counter-rotating” with respect to the outer gas with PAg nearly aligned with PAs. The PAg of PGC 047273, PGC047590, PGC 049940, and PGC 065588 was straightforwardly derived since the gas is regularly rotating. On the other hand, the rotation in PGC 073000 is slightly disturbed by the presence of a thick filament. Nevertheless, it was possible to robustly derive the PAg. In PGC 015524, the filaments are more elongated and heavily affect the rotation of the gas. To address this issue and obtain a reliable PAg, only the central spatial region (within 8″ of radius) was considered in the procedure and the filaments were discarded.
Overall, five satellites and four BCGs are characterised by rotating gas. The orientations of stellar and gaseous rotations are aligned with respect to each other in three out of five satellites (PGC 047177, PGC 047197, PGC 097958) and their PAg and PAs are aligned to the major axis of isophotes, except for PGC 047197 (with a difference between PAg and PA of the isophotal major axis ΔPAgp ∼90°, see Table 1). On the contrary, the gas rotation in PGC 047273 and PGC 047590 shows misalignments of the same amount with respect to both the stellar rotation and isophotal major axis.
Concerning the BCGs, those with filaments (PGC 015524 and PGC 073000) have more extended and misaligned gas. For PGC 015524, PAg is strongly misaligned with respect to PAs (ΔPAgs ∼ 90°), while it is only slightly misaligned with respect to the PA of the major axis if we consider the clockwise ΔPAgp. In PGC 073000 the stellar and gas kinematics are slightly misaligned considering the errors, while they are strongly misaligned with respect to the isophotal orientation. On the other hand, PGC 065588 and PGC 049940 show small and no misalignments, respectively, both between PAg and PAs, and PAg and isophotal PA.
As can be seen, the sample is heterogeneous and too small to draw conclusions about the incidence of misalignments in this kind of objects. Moreover, BCGs and massive satellites should not be gathered in the same sample given that they are characterised by different (even if similar in some aspects) formation histories. Nevertheless, it has to be pointed out that the orientations of stellar and gaseous rotations are aligned for 60% of satellites and 25% of BCGs. Only 20% of satellites present PAg significantly misaligned with respect to the isophotal major axis, while this is true for 75% of BCGs.
We used the values of the specific angular momentum (λr), which will be presented in a future paper (Krajnovic et al., in prep.), to correlate the gas properties by splitting the M3G sample in fast and slow rotators. In the M3G sample there are 20 slow rotators and 5 fast rotators (all among satellites). The sample of fast rotators is not so large to derive statistically significant information (due to the mass selection of the sample), but overall the gas was detected in 80% of fast rotators and 35% of slow rotators. These fractions are very similar to those found in the MASSIVE survey (80% and 28%, respectively, Pandya et al. 2017). The fraction of slow rotators with gas is larger with respect to that in the MASSIVE sample, probably because the M3G sample comprises several BCGs that could easily have accreted gas during their frequent mergers (more than large ellipticals, Edwards & Patton 2012; Jimmy et al. 2013) or cooling episodes when the halo gas can be accreted to the centre of the galaxy (Gaspari et al. 2018; McDonald et al. 2018; Olivares et al. 2019).
In the subsample composed of galaxies with rotating gas, there are 3 fast rotators (PGC 047177, PGC 047273 and PGC 097958) and 6 slow rotators (other objects). Slow rotators have stronger misalignments (4/6 ∼ 67% versus 2/2 = 100% misalignments in MASSIVE), while fast rotators are predominantly aligned (1/3 = 33% versus 3/4 = 75% misalignments in MASSIVE).
6. Ionisation mechanism
We analysed the emission line flux ratios of all velocity components separately to get an initial insight into the ionisation mechanism. We built BPT diagrams (Baldwin et al. 1981; Veilleux & Osterbrock 1987) by considering [N II]/Hα ([N II]-BPT), [S II]/Hα ([S II]-BPT), and [O I]/Hα ([O I]-BPT) flux ratios of three BCGs (PGC 015524, PGC 049940, PGC 073000), and one SSC satellite (PGC 047177), for which both Hβ and [O III]λ5007 were detected. For PGC 047202, PGC 047273, PGC 047590, and PGC 065588, it was possible to analyse [N II]/Hα ratios only. Finally, only the [N II] line was clearly detected in PGC 046860, PGC 047197, and PGC 097958 and this prevented us from studying their ionisation mechanism.
The ionisation in massive ETGs on kiloparsec scales is commonly due to photo-ionisation from hot underlying evolved stars and shocks, while in the nuclear region low-luminosity AGN may also contribute (Pandya et al. 2017). Thanks to spatially resolved spectroscopy, extended LIER emissions have been discovered (e.g., Belfiore et al. 2016) and can be ascribed to ionising photons from pAGB stars (Sarzi et al. 2006; Johansson et al. 2016).
The BPT diagrams are shown in Figs. 5 and 6. Most likely because of extinction, in PGC 047177 and PGC 049940, the second component was not detected in Hβ and [O III] line profiles, and we only built the BPT diagrams for their first components. The flux line ratios of these two galaxies are enclosed in the LINER region. Overall, the gas in PGC 049940 extends up to 2″ from the centre, but only the nuclear bins (within 0 8 of radius that corresponds to 0.6 kpc) are considered in the BPTs because Hβ was not detected in the outer bins. On the other hand, the bins of PGC 047177 considered in the BPT are enclosed within 2″ of radius, which corresponds to 1.9 kpc. Notably, PGC 049940 shows higher [O III]/Hβ and [N II]/Hα ratios, but nearly the same [S II]/Hα ratio as PGC 047177.
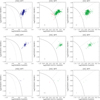 |
Fig. 5. BPT diagrams of PGC 073000. Left to right: [N II]-BPT, [S II]-BPT and [O I]-BPT diagrams. Up to down: BPT diagrams of the first, blueshifted, and redshifted components. The solid curves define the theoretical upper bound for pure star formation (Kewley et al. 2001), the dashed curve in [N II]-BPT defines the upper bound for star formation dominated bins (Kauffmann et al. 2003), and the dashed lines in [S II]-BPT and [O I]-BPT divide Seyfert galaxies from LINERs (Kewley et al. 2006). In the bottom left corner of each diagram the median ±3σ errors are reported. Seyfert-type ionisation is indicated in blue, LI(N)ER regions in the [S II]-BPTs and [O I]-BPTs are displayed in green, SF-dominated bins in red, while composite regions between Kewley et al. (2001) and Kauffmann et al. (2003) curves in [N II]-BPTs are indicated in light blue. |
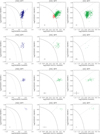 |
Fig. 6. As shown in Fig. 5. Up to down: BPT diagrams of the first and blueshifted component of PGC 015524, and first components of PGC 047177 and PGC 049940. |
PGC 073000 and PGC 015524 are characterised by spatially extended emission up to about 10″ and 5″, corresponding to 6.8 and 5.0 kpc, respectively, plus filaments elongated until 18″. The BPT diagrams of the first component of both galaxies predominately show LINER line ratios with little contamination from star formation (similar to Loubser & Soechting 2013 and McDonald et al. 2012 for PGC 015524) in the [S II]-BPT, even if this is not visible in the [N II]-BPT diagram. The absence of a significant gradient in [N II]/Hα ratio and the low ratio of [O III]/ Hβ allow us to conclude that the gas ionisation is primarily not due to the central AGN. All of the line ratios of red/blueshifted components fall in the LINER region (see Figs. 5 and 6).
Generally speaking, within the nuclear region the LINER line ratios could be related to shocks produced by the outflows (presumably observed in our galaxies) along with emission from the AGN accretion disc (Molina et al. 2018) or underlying old stellar population. PGC 049940 can be classified as type-1 LINER (Hermosa Muñoz et al. 2020) owing to the presence of a broad Hα emission in the nucleus coming from the BLR. In this case we concluded that the AGN contribution to ionisation is strong in the nucleus. On the contrary, PGC 015524, PGC 047177, and PGC 073000 can be classified as type-2 LINER (Cazzoli et al. 2018) owing to the absence of a BLR Hα emission. It has to be pointed out that the broad Hα emission may not be detected in ground-based data especially in presence of additional components that may hide it and hamper the spectroscopic classification. This is not the case of PGC 047177, which presents, even in the nucleus, a weak second component for each line, and PGC 073000 with line profile asymmetries unequivocally ascribable to red/blueshifted additional components. The superb S/N in these spectra allows us to clearly distinguish different components in most of blended line profiles. In these two galaxies both shock fronts and evolved stellar populations may provide their contribution to the ionisation. The fit of the nuclear spectra of PGC 015524 is more uncertain since Hα and [N II] lines are strongly blended. Nevertheless, the nuclear line profiles are clearly bent towards shorter wavelengths and employing a blueshifted component for each line allows us to successfully fit them. This component is broader in the nucleus (about 480 km s−1) than outside (about 250 km s−1), but still not so broad to arise from the BLR and so these emission-line components are likely to be excited by radiative shocks.
The LIER (out of the nucleus) line ratios may arise from a mixed contribution of evolved stellar populations (Hsieh et al. 2017) that are quite common in these kind of objects, as well as shocks due to galactic-scale outflows.
Concerning the spatially extended first components of PGC 015524, PGC 047177, and PGC 073000, the ionisation mechanism could be ascribable to a mixed contribution from the underlying evolved stellar populations and shallow shocks. Byler et al. (2019) predicted the LIER-like emission in ETGs from hot post-AGB stars based on a self-consistent stellar and photoionisation models. Looking at their [S II] and [O I]- BPT diagrams, LIER predictions for old stellar populations (older than 10 Gyr) fall slightly below (0.5 dex) with respect to the line ratios of PGC 015524, PGC 047177, and PGC 073000.
The velocity dispersion is a suitable shock diagnostic (Ho et al. 2014) for outer regions where there is no AGN contribution (D’Agostino et al. 2019). The gas that was ionised by shocks presents both high flux ratios and high-velocity dispersion between 150 km s−1 and 500 km s−1. This is exactly the case of red/blueshifted components revealed in our galaxies, especially for PGC 047177 and PGC 049940. Consistent with the presence of shocks, [O I]λλ6300, 6364 and [N I]λλ5197, 5200 emission were detected. This gas is often situated in extended and partially ionised regions produced by the hard radiation field of the shock. In PGC 015524 and PGC 073000, [O I] and [N I] show the same kinematics and similar spatial distribution of the ionised gas, even if they are less spatially extended outward (especially the [N I]). In particular, [O I] and [N I] have a filamentary distribution in PGC 015524, while in PGC 073000 these emission lines are more concentrated in the centre and in the west direction in correspondence to the X-ray arm.
For PGC 047202, PGC 047273, PGC 047590, and PGC 065588, which are characterised by too weak H[[INLINE263]] or no [O III] emission, the log [N II]/Hα ratios are reported in Fig. 7. This ratio is a good indicator of gas excitation state caused by an AGN. Indeed, it saturates at high metallicity (Kewley et al. 2006) and, as a consequence, ratios larger than ∼0.6 point to an AGN contribution (rather than star formation) to the excitation (Osterbrock & Ferland 2006; Hamer et al. 2016) even if it does not have a decisive discriminating power. Moreover, star formation is characterised by softer radiation field with respect to AGN, which has a harder radiation producing a higher ionisation state and higher log [N II]/Hα ratios.
 |
Fig. 7. Left to right: log ([N II]/Hα) spatially resolved maps of PGC 065588, PGC 047202, PGC 047273, and PGC047590. Their spatial extent is the same of Hα, that is less extended than [N II] in all the galaxies. |
For PGC 047273 and PGC 047590, the ratio varies within the resolved maps (up to about 0.3 and 0.4, respectively, see Fig. 7) but it definitely remains under 0.6, ruling out AGN/LINER contamination. The same considerations can be applied to the BCG of SSC (PGC 047202), even if there is a stronger spatial variation. PGC 065588 is characterised by higher ratios (on average above 0.4 and up to 0.8 for some bins) even if there is not a clear radial variation. In case of contamination by an AGN, we would expect high ratios to be more localized in the centre while the spatial distribution of ratios points to a composite LINER and star formation contribution. Nevertheless, log [N II]/Hα values are not sufficient to determine the ionisation mechanism since a number of processes could play a role, including AGN, star formation, shocks from internal or external sources (faster shocks easily result in higher line ratios), photo-ionisation by hot gas, and collisional heating.
For those galaxies with both Hα and [N II] lines detected we built a WHAN diagram (Cid Fernandes et al. 2011; Sanchez et al. 2021) that relates the equivalent width of Hα and the [N II]/Hα ratio. For those galaxies with emission lines with more than one component, we considered the first component for this analysis. The WHAN diagram provides more information on the ionisation mechanism for those galaxies, for which it is not possible to built the BPT diagram. Moreover, this diagram allows us to separate weakly AGNs and passive galaxies ionised by the underlying evolved stellar population that fall both on the LI(N)ER region of the BPT diagram. As shown in Fig. 8, for all galaxies the data points are enclosed in the region of the diagram corresponding to “retired” galaxies, which are objects that stopped forming stars and that have gas ionised by hot low-mass evolved stars. This points out an important contribution to the ionisation from the underlying evolved stellar population.
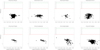 |
Fig. 8. Left to right: WHAN diagram. The lines represent the division between gas ionised by AGN/star formation and “retired” galaxies (above and below the red line, respectively), the optimal transposition of the BPT-based division (Stasińska et al. 2006) between ionisation mechanisms driven by star formation and AGN (to the left and right of the black line, respectively), and of the Kewley et al. (2006) separation between Seyferts and LINERs (above and below the green line, respectively). The names of the galaxies are reported above each panel. |
The determination of the relative contributions to ionisation due to shocks, underlying stellar population or AGN in LINERs requires the employment of photoionisation models to interpret the emission line ratios. Moreover, an analysis of UV and/or IR spectroscopic data would help (see Kewley et al. 2019 for a review). This is beyond the scope of this paper.
7. Origin of the gas
The M3G sample was built to select the most massive galaxies in the local Universe without putting constraints on gas content and, as a consequence, the sub-sample of galaxies with gas is extremely heterogeneous but illustrative at the highest galaxy masses. In the following, we exploit the previously derived gas properties to infer hints concerning the origin of the gas and give an explanation to the observed distribution and kinematics. Moreover, the comparison between the orientations of stellar and gaseous rotations (see Sect. 5), along with the specific angular momentum information, provide us with crucial clues about the origin of the gas given that slow rotators are more likely to show misalignments because of past merging activity.
7.1. Galaxies with extended gas and filaments
PGC 015524 and PGC 073000 show extended emission with filamentary structures.
In PGC 015524, the gas stretches in filaments with similar distribution suggesting a common origin, even if the filaments are less extended for [N I] and [O I]. McDonald et al. (2012) carried out a long-slit spectroscopic analysis along the filaments and proposed that the gas clouds would have reached the cluster centre through gravitational free fall. Contrary to this scenario, changes in the sign of the line-of-sight velocity are clearly visible in our spatially resolved maps of Hα, [N II], and [S II], rather pointing to the so-called “rising bubble” mechanism (e.g., Reynolds et al. 2005). Nevertheless, there are no clear bubbles that should form the filamentary structures (Dunn & Fabian 2006). Moreover, the galaxy has a cooling flow (Edwards et al. 2007) visible in X-ray gas emission and Dunn & Fabian (2006) stated that there should be some heating mechanism at work based on the cooling times as confirmed by McDonald et al. (2018). Using deep Chandra observations, Hogan et al. (2017) found that the extended Hα emission is associated with the cooler X-ray component in a two-temperature thermal model of the ICM. This suggests that the gas originates from a direct cooling of the hot phase. From our analysis, we found that there is a strong misalignment (91°) between the gas and stellar kinematics, supporting an external accretion of the gas.
In PGC 073000, ionised gas, [O I] and [N I], are kinematically aligned and share similar distributions pointing to a common origin. Moreover all the line profiles are characterised by three gas components with different velocities (for an example see Fig. 1) suggesting that ionised gas, [O I] and [N I], are subjected to the same processes (e.g., outflows) within the galaxy. All spatially resolved maps show a second flux peak, in addition to the central peak, in the west direction in correspondence to an X-ray arm (Choi et al. 2004). The gas and stellar rotations are nearly aligned with respect to each other while they are not with respect to isophotal PA (117°). The gas seems to be associated with the stellar component that rotates around the major axis (prolate-like). In such a configuration, the gas could have been acquired by chance along that axis, or be associated with the stellar component from the formation of the galaxy. The fact that the velocity map is quite disturbed suggests that this gas could be infalling and settling into this principal plane as a consequence of the gravitational torques. The thick filament, that is only visible in the [N II], [S II], and Hα maps, presents no changes in the sign of the velocity, pointing to a later stage of accretion with respect to PGC 015524. Furthermore, this galaxy has a cooling flow in action (Edwards et al. 2007) and the filament may be formed by gravitational free fall of cold gas. Finally, PGC 073000 hosts radio emission towards the north direction (McDonald et al. 2010), which may be related to some perturbations visible in the gas distribution.
7.2. Galaxies with centrally concentrated gas
In three BCGs (PGC 047202, PGC 065588, and PGC 049940) and four SSC satellites (PGC 046860, PGC 047197, PGC 047590, and PGC 097958) the gas is confined in the central region in a compact ionised-gas discs in rotation, except for PGC 046860 and PGC 047202 in which the gas is not rotating.
The rotation of the gaseous disc in PGC 049940 is aligned to the stellar disc. PGC 047197 and PGC 097958 are ascribable to the same category, even if the putative alignment is more uncertain given that this information was derived from visual inspection of few bins. This small amount of gas contained in objects with oblate-like regular rotation (PGC 046860, PGC 047197, and PGC 049940) may originate from internal stellar gas loss, even if simulations showed that this gas could also come from mergers (van de Voort et al. 2015). In particular, this could be the case of PGC 047197, which shows prolate-like rotation (Krajnović et al. 2018).
On the contrary, in PGC 065588 and PGC 047590 the rotation of the gas is not aligned to the one of stars suggesting a possible external origin of the gas. On the other hand, an internal origin is still plausible given that they are characterised by prolate-like stellar rotation (Krajnović et al. 2018). The gas lost from the stars, which belong to various orbital families, can end up, through several cooling cycles, in a configuration different from those of the stars. The present configuration of the gas could just be a consequence of it being released by stars on different orbits. This could also be the case for PGC 047197.
7.3. Peculiar gas distributions and kinematics
PGC 047177 and PGC 047273 present peculiar features in the gas distribution and kinematics, therefore it is more difficult to speculate on the origin of their gas.
In PGC 047177, PAg and PAs are aligned with respect to each other and their rotation axis are aligned to the isophotal major axis. Nevertheless, the Hα distribution is a bit filamentary and patchy as the [N II] and [S II] distributions, which show a similar pattern even if they are more compact. More peculiar, the velocity field shows a change of the sign, of the order of 50 km s−1, in the inner spatial region. A counter-rotation is not visible in the stellar velocity map and, unfortunately, there are no high-resolution HST images. As a matter of fact, in a regular and fast rotator as PGC 047177 this is quite rare. Nevertheless, the presence of nuclear dust (see Sect. 4.4) could be interpreted as the smoking gun for a gas disc, with the same spatial scale, that was recently acquired in multiple phase accretion process and settled in a different orientation. This interpretation has to be taken with caution since the evidence is marginal.
PGC 047273 is characterised by an oblate-like regular rotation but presents a large amount of ionised gas with a rotation axis that is strongly misaligned with respect to the stellar one. The presence of misalignment between stars and gas points to an external origin of the gas. After the accretion, the gas settled in a sort of polar disc, which is, however, not exactly along the galaxy minor axis. This could suggest that PGC 047273 is a triaxial galaxy observed under a special orientation. In a triaxial galaxy that would be a stable configuration, but in an axisymmetric galaxy, the configuration would be less stable. Figure A.8 shows all the detected emission lines for this galaxy, some with more extended coverage of the gas distribution. From these lines it can be noticed that in the outskirts the disc is visibly “precessing” and bending towards the major axis of the galaxy. This suggests that the galaxy might be oblate axisymmetric and the accreted gas disc is in the process of setting in the principal plane of the galaxy.
8. Conclusions and future work
We analysed the gas content of massive (M > 1012 M⊙) ETGs in the M3G survey by exploiting MUSE data. Ionised gas was detected in 11 galaxies along with [O I] and [N I] in 4 of them. Our main results can be summarised as follows:
– In the M3G sample, ∼28% of BCGs and ∼64% of massive satellites of the SSC contain ionised gas. Among them, [O I] and [N I] were detected in three BCGs and one satellite. These four objects present multi-component line profiles that have red/blueshifted and broad components.
– The gas distributions and kinematics are extremely heterogeneous in these objects. The gas is centrally concentrated in almost all objects, except for two BCGs (PGC 015524 and PGC 073000), which show filaments and two massive satellites with extended emission (PGC 047177 and PGC 047273). The peak of the gas emission corresponds to the photometric centre for all galaxies, with the exception of PGC 015524 and PGC 073000, which have perturbed gas distribution in the nuclear region.
– Dust was probed in such old and massive objects by analysing the extinction with Balmer ratios. We revealed mean E(B − V) of 0.2–0.3 values with few peaks up to 0.7 corresponding to optically thick dust filaments that are also visible in HST images.
– The orientations of stellar and gaseous rotations are aligned for 60% of satellites and 25% of BCGs; 75% of BCGs and 20% of satellites are characterised by a PAg significantly misaligned with respect to the isophotal PA. Overall, the gas was detected in 80% of fast rotators and 35% of slow rotators, similar to the MASSIVE survey galaxies.
– From the analysis of [N II]-BPT and [S II]-BPT, we conclude that PGC 015524, PGC 047177, PGC 049940, and PGC 073000 are characterised by LI(N)ER line ratios, although PGC 015524 and PGC 073000 may show possible contamination from star formation. We classified PGC 049940 as type-1 LINER, while PGC 015524, PGC 047177, and PGC 073000 are classified as type-2 LINER. High-velocity dispersions up to 600 km s−1 were detected for the red/blueshifted components in the nuclear region, pointing to the presence of shock excitation. Extended gas in the red/blueshifted of PGC 015524, PGC 047177, PGC 049940, and PGC 073000 are probably mainly ionised by the underlying evolved stars (pAGBs) with additional shock contribution, given the high [O I]/Hα and [S II]/Hα ratios, the presence of [O I] and [N I] emission, and the high-velocity dispersion.
– The presence of misalignments between PAg and PAs may point to an external origin of the gas for PGC 015524, PGC 047273, PGC 047590, PGC 065588, and PGC 073000 (three BCGs and two SSC satellites). On the other hand, it has to be pointed out that PGC 047197, PGC 047590, and PGC 065588 are characterised by prolate-like stellar rotation and the gas could have been originated internally and settled in different configuration with respect to stars.
– The presence of discrepant velocities with respect to the background gas structure in the inner 2″ of PGC 047177 would need to be inspected with HST images, which are not present in the archive. The puzzling case of the precessing polar disc of PGC 047273 would require further analysis concerning stellar populations and star formation history to better characterise the evolution of this massive galaxy.
Future work will comprise the determination of the relative contributions to ionisation due to shocks, underlying stellar population, or AGN in LINERs. It has to be pointed out that optical diagnostics and photo-ionisation models are not ideal for separating excitation sources if shocks are present, since shocks models are located in the same BPT region as those of AGNs (Kewley et al. 2019). In this sense, the analysis of IR and/or UV spectroscopic data would appreciably help to separate the contributions to ionisation. Moreover, the study of stellar populations will provide decisive insights into the formation histories of these ETGs, confirming or reconsidering the discussion in Sect. 7 about the origin of the gas.
Interactive Data Language is distributed by Harris Geospatial Solutions.
Acknowledgments
I. P. acknowledges the Leibniz Institute For Astrophysics Potsdam for the hospitality and financial support while this paper was in progress. I. P. is supported also by Fondazione Ing. Aldo Gini of the University of Padova. We are grateful to Lutz Wisotzki, Tanya Urrutia and the MUSE GTO collaboration for the valuable comments. D. K. and M. dB. acknowledge financial support through the grant GZ: KR 4548/2-1 of the Deutsche Forschungsgemeinschaft. JB acknowledges support by Fundação para a Ciência e a Tecnologia (FCT) through the research grants UID/FIS/04434/2019, UIDB/04434/2020, UIDP/04434/2020 and through the Investigador FCT Contract No. IF/01654/2014/CP1215/CT0003. P. M. W. received support through BMBF Verbundforschung (project MUSE-NFM, Grant 05A17BAA). W. K. was supported by DFG Grant Ko 857/33-1. This research is based on MUSE data of the MUSE GTO collaboration and data from the NASA/IPAC Extragalactic Database (http://ned.ipac.caltech.edu/).
References
- Abell, G. O., Corwin, H. G., & Olowin, R. P. 1989, ApJS, 70, 1 [NASA ADS] [CrossRef] [EDP Sciences] [Google Scholar]
- Bacon, R., Accardo, M., Adjali, L., et al. 2010, in Proc. SPIE, SPIE Conf. Ser., 7735, 773508 [Google Scholar]
- Baldwin, J. A., Phillips, M. M., & Terlevich, R. 1981, PASP, 93, 5 [NASA ADS] [CrossRef] [EDP Sciences] [Google Scholar]
- Belfiore, F., Maiolino, R., Maraston, C., et al. 2016, MNRAS, 461, 3111 [Google Scholar]
- Bildfell, C., Hoekstra, H., Babul, A., & Mahdavi, A. 2008, MNRAS, 389, 1637 [NASA ADS] [CrossRef] [Google Scholar]
- Byler, N., Dalcanton, J. J., Conroy, C., et al. 2019, AJ, 158, 2 [NASA ADS] [CrossRef] [Google Scholar]
- Calzetti, D., Armus, L., Bohlin, R. C., et al. 2000, ApJ, 533, 682 [NASA ADS] [CrossRef] [Google Scholar]
- Cappellari, M. 2017, MNRAS, 466, 798 [NASA ADS] [CrossRef] [Google Scholar]
- Cappellari, M., & Copin, Y. 2003, MNRAS, 342, 345 [NASA ADS] [CrossRef] [Google Scholar]
- Cappellari, M., & Emsellem, E. 2004, PASP, 116, 138 [NASA ADS] [CrossRef] [Google Scholar]
- Cappellari, M., McDermid, R. M., Alatalo, K., et al. 2013, MNRAS, 432, 1862 [Google Scholar]
- Cavagnolo, K. W., Donahue, M., Voit, G. M., & Sun, M. 2008, ApJ, 683, L107 [NASA ADS] [CrossRef] [Google Scholar]
- Cazzoli, S., Márquez, I., Masegosa, J., et al. 2018, MNRAS, 480, 1106 [Google Scholar]
- Choi, Y.-Y., Reynolds, C. S., Heinz, S., et al. 2004, ApJ, 606, 185 [NASA ADS] [CrossRef] [Google Scholar]
- Cid Fernandes, R., Stasińska, G., Mateus, A., & Vale Asari, N. 2011, MNRAS, 413, 1687 [Google Scholar]
- Cooke, K. C., Kartaltepe, J. S., Tyler, K. D., et al. 2019, ApJ, 881, 150 [NASA ADS] [CrossRef] [Google Scholar]
- D’Agostino, J. J., Kewley, L. J., Groves, B. A., et al. 2019, MNRAS, 487, 4153 [CrossRef] [Google Scholar]
- Dalla Bontà, E., Ferrarese, L., Corsini, E. M., et al. 2009, ApJ, 690, 537 [NASA ADS] [CrossRef] [Google Scholar]
- Davis, T. A., Greene, J., Ma, C.-P., et al. 2016, MNRAS, 455, 214 [NASA ADS] [CrossRef] [Google Scholar]
- Dunn, R. J. H., & Fabian, A. C. 2006, MNRAS, 373, 959 [NASA ADS] [CrossRef] [Google Scholar]
- Ebrová, I., & Łokas, E. L. 2015, ApJ, 813, 10 [NASA ADS] [CrossRef] [Google Scholar]
- Edwards, L. O. V., & Patton, D. R. 2012, MNRAS, 425, 287 [NASA ADS] [CrossRef] [Google Scholar]
- Edwards, L. O. V., Hudson, M. J., Balogh, M. L., & Smith, R. J. 2007, MNRAS, 379, 100 [NASA ADS] [CrossRef] [Google Scholar]
- Edwards, L. O. V., Salinas, M., Stanley, S., et al. 2020, MNRAS, 491, 2617 [CrossRef] [Google Scholar]
- Ellis, S. C., & O’Sullivan, E. 2006, MNRAS, 367, 627 [NASA ADS] [CrossRef] [Google Scholar]
- Fabian, A. C. 1994, ARA&A, 32, 277 [NASA ADS] [CrossRef] [Google Scholar]
- Ford, H. A., & Bregman, J. N. 2013, ApJ, 770, 137 [NASA ADS] [CrossRef] [Google Scholar]
- Gaspari, M., McDonald, M., Hamer, S. L., et al. 2018, ApJ, 854, 167 [NASA ADS] [CrossRef] [Google Scholar]
- Gerhard, O. E. 1993, MNRAS, 265, 213 [NASA ADS] [CrossRef] [Google Scholar]
- Girardi, L., Bressan, A., Bertelli, G., & Chiosi, C. 2000, A&AS, 141, 371 [NASA ADS] [CrossRef] [EDP Sciences] [Google Scholar]
- Gomes, J. M., Papaderos, P., Kehrig, C., et al. 2016, A&A, 588, A68 [NASA ADS] [CrossRef] [EDP Sciences] [Google Scholar]
- Goulding, A. D., Greene, J. E., Ma, C.-P., et al. 2016, ApJ, 826, 167 [NASA ADS] [CrossRef] [Google Scholar]
- Greene, J. E., Janish, R., Ma, C.-P., et al. 2015, ApJ, 807, 11 [NASA ADS] [CrossRef] [Google Scholar]
- Greene, J. E., Veale, M., Ma, C.-P., et al. 2019, ApJ, 874, 66 [NASA ADS] [CrossRef] [Google Scholar]
- Groenewald, D. N., & Loubser, S. I. 2014, MNRAS, 444, 808 [Google Scholar]
- Guérou, A., Krajnović, D., Epinat, B., et al. 2017, A&A, 608, A5 [NASA ADS] [CrossRef] [EDP Sciences] [Google Scholar]
- Hamer, S. L., Edge, A. C., Swinbank, A. M., et al. 2016, MNRAS, 460, 1758 [NASA ADS] [CrossRef] [Google Scholar]
- Hermosa Muñoz, L., Cazzoli, S., Márquez, I., & Masegosa, J. 2020, A&A, 635, A50 [EDP Sciences] [Google Scholar]
- Ho, I. T., Kewley, L. J., Dopita, M. A., et al. 2014, MNRAS, 444, 3894 [NASA ADS] [CrossRef] [Google Scholar]
- Hogan, M. T., McNamara, B. R., Pulido, F., et al. 2017, ApJ, 837, 51 [CrossRef] [Google Scholar]
- Hsieh, B. C., Lin, L., Lin, J. H., et al. 2017, ApJ, 851, L24 [NASA ADS] [CrossRef] [Google Scholar]
- Jimmy, Tran, K. V., Brough, S., et al. 2013, ApJ, 778, 171 [NASA ADS] [CrossRef] [Google Scholar]
- Johansson, J., Woods, T. E., Gilfanov, M., et al. 2016, MNRAS, 461, 4505 [Google Scholar]
- Kauffmann, G., Heckman, T. M., Tremonti, C., et al. 2003, MNRAS, 346, 1055 [Google Scholar]
- Kewley, L. J., Dopita, M. A., Sutherland, R. S., Heisler, C. A., & Trevena, J. 2001, ApJ, 556, 121 [NASA ADS] [CrossRef] [Google Scholar]
- Kewley, L. J., Groves, B., Kauffmann, G., & Heckman, T. 2006, MNRAS, 372, 961 [NASA ADS] [CrossRef] [Google Scholar]
- Kewley, L. J., Nicholls, D. C., & Sutherland, R. S. 2019, ARA&A, 57, 511 [Google Scholar]
- Kim, D.-W. 1989, ApJ, 346, 653 [NASA ADS] [CrossRef] [Google Scholar]
- Kormendy, J., Fisher, D. B., Cornell, M. E., & Bender, R. 2009, ApJS, 182, 216 [NASA ADS] [CrossRef] [Google Scholar]
- Krajnović, D., Cappellari, M., de Zeeuw, P. T., & Copin, Y. 2006, MNRAS, 366, 787 [NASA ADS] [CrossRef] [Google Scholar]
- Krajnović, D., Emsellem, E., den Brok, M., et al. 2018, MNRAS, 477, 5327 [NASA ADS] [CrossRef] [Google Scholar]
- Laine, S., van der Marel, R. P., Lauer, T. R., et al. 2003, AJ, 125, 478 [Google Scholar]
- Laporte, C. F. P., White, S. D. M., Naab, T., & Gao, L. 2013, MNRAS, 435, 901 [NASA ADS] [CrossRef] [Google Scholar]
- Li, H., Mao, S., Emsellem, E., et al. 2018, MNRAS, 473, 1489 [NASA ADS] [CrossRef] [Google Scholar]
- Łokas, E. L., Ebrova, I., Del Pino, A., & Semczuk, M. 2014, MNRAS, 445, L6 [NASA ADS] [CrossRef] [Google Scholar]
- Loubser, S. I., & Soechting, I. K. 2013, MNRAS, 431, 2933 [Google Scholar]
- Ma, C.-P., Greene, J. E., McConnell, N., et al. 2014, ApJ, 795, 158 [Google Scholar]
- Markwardt, C. B. 2009, in Astronomical Data Analysis Software and Systems XVIII, eds. D. A. Bohlender, D. Durand, & P. Dowler, ASP Conf. Ser., 411, 251 [Google Scholar]
- McDermid, R. M., Alatalo, K., Blitz, L., et al. 2015, MNRAS, 448, 3484 [NASA ADS] [CrossRef] [Google Scholar]
- McDonald, M., Veilleux, S., Rupke, D. S. N., & Mushotzky, R. 2010, ApJ, 721, 1262 [NASA ADS] [CrossRef] [Google Scholar]
- McDonald, M., Veilleux, S., & Rupke, D. S. N. 2012, ApJ, 746, 153 [NASA ADS] [CrossRef] [Google Scholar]
- McDonald, M., Gaspari, M., McNamara, B. R., & Tremblay, G. R. 2018, ApJ, 858, 45 [NASA ADS] [CrossRef] [Google Scholar]
- Molina, M., Eracleous, M., Barth, A. J., et al. 2018, ApJ, 864, 90 [NASA ADS] [CrossRef] [Google Scholar]
- O’Donnell, J. E. 1994, ApJ, 422, 158 [NASA ADS] [CrossRef] [Google Scholar]
- Olivares, V., Salome, P., Combes, F., et al. 2019, A&A, 631, A22 [NASA ADS] [CrossRef] [EDP Sciences] [Google Scholar]
- Oser, L., Naab, T., Ostriker, J. P., & Johansson, P. H. 2012, ApJ, 744, 63 [NASA ADS] [CrossRef] [Google Scholar]
- Osterbrock, D. E. 1989, Astrophysics of Gaseous Nebulae and Active Galactic Nuclei (University Science Books) [Google Scholar]
- Osterbrock, D. E., & Ferland, G. J. 2006, Astrophysics of Gaseous Nebulae and Active Galactic Nuclei (Sausalito, CA: University Science Books) [Google Scholar]
- Pandya, V., Greene, J. E., Ma, C.-P., et al. 2017, ApJ, 837, 40 [Google Scholar]
- Papaderos, P., Gomes, J. M., Vílchez, J. M., et al. 2013, A&A, 555, L1 [NASA ADS] [CrossRef] [EDP Sciences] [Google Scholar]
- Peterson, J. R., & Fabian, A. C. 2006, Phys. Rep., 427, 1 [NASA ADS] [CrossRef] [Google Scholar]
- Reynolds, C. S., McKernan, B., Fabian, A. C., Stone, J. M., & Vernaleo, J. C. 2005, MNRAS, 357, 242 [NASA ADS] [CrossRef] [MathSciNet] [Google Scholar]
- Sanchez, S. F., Walcher, C. J., Lopez-Coba, C., et al. 2021, Rev. Mex. Astron. Astrofís., 57, 3 [Google Scholar]
- Sarzi, M., Falcón-Barroso, J., Davies, R. L., et al. 2006, MNRAS, 366, 1151 [Google Scholar]
- Sarzi, M., Falcón-Barroso, J., Davies, R. L., et al. 2017, GANDALF: Gas AND Absorption Line Fitting [Google Scholar]
- Schlegel, D. J., Finkbeiner, D. P., & Davis, M. 1998, ApJ, 500, 525 [NASA ADS] [CrossRef] [Google Scholar]
- Smette, A., Sana, H., Noll, S., et al. 2015, A&A, 576, A77 [NASA ADS] [CrossRef] [EDP Sciences] [Google Scholar]
- Stasińska, G., Cid Fernandes, R., Mateus, A., Sodré, L., & Asari, N. V. 2006, MNRAS, 371, 972 [NASA ADS] [CrossRef] [Google Scholar]
- Thomas, D., Maraston, C., Bender, R., & Mendes de Oliveira, C. 2005, ApJ, 621, 673 [NASA ADS] [CrossRef] [Google Scholar]
- Thomas, J., Saglia, R. P., Bender, R., Erwin, P., & Fabricius, M. 2014, ApJ, 782, 39 [NASA ADS] [CrossRef] [Google Scholar]
- Tremblay, G. R., O’Dea, C. P., Baum, S. A., et al. 2015, MNRAS, 451, 3768 [CrossRef] [Google Scholar]
- Tsatsi, A., Lyubenova, M., van de Ven, G., et al. 2017, A&A, 606, A62 [NASA ADS] [CrossRef] [EDP Sciences] [Google Scholar]
- van der Marel, R. P., & Franx, M. 1993, ApJ, 407, 525 [NASA ADS] [CrossRef] [Google Scholar]
- van de Voort, F., Davis, T. A., Kereš, D., et al. 2015, MNRAS, 451, 3269 [NASA ADS] [CrossRef] [Google Scholar]
- van Dokkum, P. G., Franx, M., Kriek, M., et al. 2008, ApJ, 677, L5 [NASA ADS] [CrossRef] [Google Scholar]
- Vazdekis, A., Sánchez-Blázquez, P., Falcón-Barroso, J., et al. 2010, MNRAS, 404, 1639 [NASA ADS] [Google Scholar]
- Veale, M., Ma, C.-P., Thomas, J., et al. 2017, MNRAS, 464, 356 [NASA ADS] [CrossRef] [Google Scholar]
- Veilleux, S., & Osterbrock, D. E. 1987, ApJS, 63, 295 [NASA ADS] [CrossRef] [Google Scholar]
- Veilleux, S., Cecil, G., & Bland-Hawthorn, J. 2005, ARA&A, 43, 769 [NASA ADS] [CrossRef] [Google Scholar]
- Von Der Linden, A., Best, P. N., Kauffmann, G., & White, S. D. M. 2007, MNRAS, 379, 867 [NASA ADS] [CrossRef] [Google Scholar]
- Weilbacher, P. M., Palsa, R., Streicher, O., et al. 2020, A&A, 641, A28 [CrossRef] [EDP Sciences] [Google Scholar]
- Wellons, S., Torrey, P., Ma, C.-P., et al. 2015, MNRAS, 449, 361 [NASA ADS] [CrossRef] [Google Scholar]
- Young, L. M., Bureau, M., Davis, T. A., et al. 2011, MNRAS, 414, 940 [Google Scholar]
Appendix A: Maps for the gas kinematics, fluxes, and A/N of the M3G galaxies
We show the 2D spatially resolved maps of the gaseous fluxes, kinematics, and A/N, extracted in Sect. 4.1 and described and commented in Sect. 4.2.
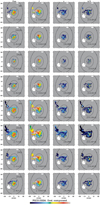 |
Fig. A.1. Spatially resolved maps of the first gas velocity component of PGC 015524. Left to right: flux in log 10−20 erg s−1 cm−2 arcsec−2, velocities and velocity dispersions in km s−1, and A/N ratio. The maximum and minimum values in the colour bar are reported in each panel between square brackets. The black dashed contours are isophotes in steps of one magnitude. Up to down: spatially resolved maps of Hβ, [O III]λ5007 ([O III] 2), [N I]λ5200 ([N I] 2), [O I]λ6300 ([O I]), Hα, [N II]λ6583 ([N II] 2), [S II]λ6716 ([S II]), and [S II]λ6731 ([S II] 2). |
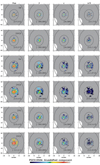 |
Fig. A.2. As in Fig. A.1, but for the blueshifted component of PGC 015524. Up to down: spatially resolved maps of Hβ, [O III] 2, Hα, [N II] 2 and [S II], and [S II] 2. |
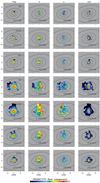 |
Fig. A.4. As in Fig A.1, but for the first gas velocity component of PGC 047177. Up to down: spatially resolved maps of Hβ, [O III] 2, [O I], Hα, [N II] 2 and [S II] and [S II] 2. |
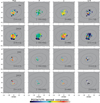 |
Fig. A.5. As in Fig A.1, but for the second velocity component of PGC 047177. Up to down: spatially resolved maps of Hα, [N II] 2 and [S II], and [S II] 2. |
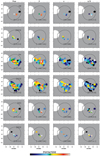 |
Fig. A.7. As in Fig. A.1, but for PGC 047202. Up to down: spatially resolved maps of Hβ, [O III] 2, Hα, [N II] 2 and [S II], and [S II] 2. |
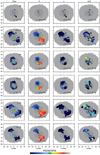 |
Fig. A.8. As in Fig. A.1, but for PGC 047273. Up to down: spatially resolved maps of Hβ, [O III] 2, Hα, [N II] 2 and [S II], and [S II] 2. |
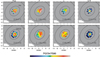 |
Fig. A.9. As in Fig. A.1, but for PGC 047590. Up to down: spatially resolved maps of Hα and [N II] 2. |
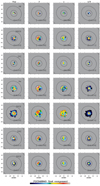 |
Fig. A.10. As in Fig. A.1, but for the first velocity component of PGC 049940. Up to down: spatially resolved maps of Hβ, [O III] 2, [O I], Hα, [N II] 2 and [S II], and [S II] 2. |
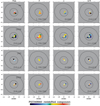 |
Fig. A.11. As in Fig. A.1, but for the redshifted component of PGC 049940. Up to down: spatially resolved maps of Hα, [N II] 2 and [S II], and [S II] 2. |
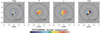 |
Fig. A.12. As in Fig. A.1, but for the broad Hα component of PGC 049940. |
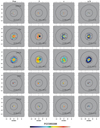 |
Fig. A.13. As in Fig. A.1, but for PGC 065588. Up to down: spatially resolved maps of [O III] 2, Hα, [N II] 2 and [S II], and [S II] 2. |
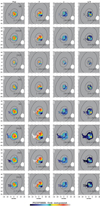 |
Fig. A.14. As in Fig. A.1, but for the first velocity component of PGC 073000. Up to down: spatially resolved maps of Hβ, [O III] 2, [N I] 2, [O I], Hα, [N II] 2 and [S II], and [S II] 2. |
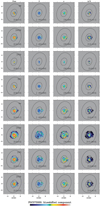 |
Fig. A.15. As in Fig. A.1, but for the blueshifted component of PGC 073000. Up to down: spatially resolved maps of Hβ, [O III] 2, [N I] 2, [O I], Hα, [N II] 2 and [S II], and [S II] 2. |
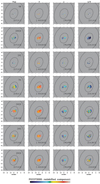 |
Fig. A.16. As in Fig. A.1, but for the redshifted component of PGC 073000. Up to down: spatially resolved maps of Hβ, [O III] 2, [O I], Hα, [N II] 2 and [S II], and [S II] 2. |
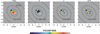 |
Fig. A.17. As in Fig. A.1, but for PGC 097958. Spatially resolved map of [N II] 2. |
All Tables
All Figures
|
Fig. 1. Continuum-subtracted MUSE spectra (black solid line) with best-fitting model (red solid line) obtained by adopting first (green lines), blueshifted and second (blue lines), redshifted (orange lines), and broad (purple lines) components for the [N II], Hα, and [S II] lines. The Gaussian components of the same line are characterised by the same pattern. The residuals are defined as the difference between the observed and model spectrum. They are shifted to an arbitrary zero point for viewing convenience. The galaxy name is reported within each panel. |
| In the text | |
|
Fig. 2. Spatially resolved maps of stellar velocities, [N II] flux, kinematics, and A/N for the 5 BGCs with detected gas. The first component only is shown for those galaxies with emission lines with more than one component (those denoted with 1 in the upper right corner of the flux maps of the gas). Left to right: stellar velocities in km s−1, [N II] flux in log 10−20 erg s−1 cm−2 arcsec−2, velocities in km s−1, velocity dispersions in km s−1, and A/N ratio. The maximum and minimum values adopted in the colour bar are reported in each panel between square brackets. Black and red contours are isophotes in steps of one magnitude. The outermost isophote of the gas maps is enhanced in red to make the spatial region of the gas immediately visible on the stellar velocity panel. Up to down: spatially resolved maps of PGC 015524, PGC 047202, PGC 049940, PGC 065588, and PGC 073000. |
| In the text | |
|
Fig. 3. Same as in Fig. 2, but for the 6 massive satellites. Up to down: spatially resolved maps of PGC 046860, PGC 047177, PGC 047197, PGC 047273, PGC 047590, and PGC 097958. |
| In the text | |
|
Fig. 4. Left to right: spatially resolved extinction maps of PGC 015524, PGC 047177, PGC 049940, and PGC073000 derived from the first line components. Their spatial extent is constrained by the detection of the Hβ line. The median errors for the extinction are 0.10, 0.18, 0.15, and 0.10, respectively. |
| In the text | |
|
Fig. 5. BPT diagrams of PGC 073000. Left to right: [N II]-BPT, [S II]-BPT and [O I]-BPT diagrams. Up to down: BPT diagrams of the first, blueshifted, and redshifted components. The solid curves define the theoretical upper bound for pure star formation (Kewley et al. 2001), the dashed curve in [N II]-BPT defines the upper bound for star formation dominated bins (Kauffmann et al. 2003), and the dashed lines in [S II]-BPT and [O I]-BPT divide Seyfert galaxies from LINERs (Kewley et al. 2006). In the bottom left corner of each diagram the median ±3σ errors are reported. Seyfert-type ionisation is indicated in blue, LI(N)ER regions in the [S II]-BPTs and [O I]-BPTs are displayed in green, SF-dominated bins in red, while composite regions between Kewley et al. (2001) and Kauffmann et al. (2003) curves in [N II]-BPTs are indicated in light blue. |
| In the text | |
|
Fig. 6. As shown in Fig. 5. Up to down: BPT diagrams of the first and blueshifted component of PGC 015524, and first components of PGC 047177 and PGC 049940. |
| In the text | |
|
Fig. 7. Left to right: log ([N II]/Hα) spatially resolved maps of PGC 065588, PGC 047202, PGC 047273, and PGC047590. Their spatial extent is the same of Hα, that is less extended than [N II] in all the galaxies. |
| In the text | |
|
Fig. 8. Left to right: WHAN diagram. The lines represent the division between gas ionised by AGN/star formation and “retired” galaxies (above and below the red line, respectively), the optimal transposition of the BPT-based division (Stasińska et al. 2006) between ionisation mechanisms driven by star formation and AGN (to the left and right of the black line, respectively), and of the Kewley et al. (2006) separation between Seyferts and LINERs (above and below the green line, respectively). The names of the galaxies are reported above each panel. |
| In the text | |
|
Fig. A.1. Spatially resolved maps of the first gas velocity component of PGC 015524. Left to right: flux in log 10−20 erg s−1 cm−2 arcsec−2, velocities and velocity dispersions in km s−1, and A/N ratio. The maximum and minimum values in the colour bar are reported in each panel between square brackets. The black dashed contours are isophotes in steps of one magnitude. Up to down: spatially resolved maps of Hβ, [O III]λ5007 ([O III] 2), [N I]λ5200 ([N I] 2), [O I]λ6300 ([O I]), Hα, [N II]λ6583 ([N II] 2), [S II]λ6716 ([S II]), and [S II]λ6731 ([S II] 2). |
| In the text | |
|
Fig. A.2. As in Fig. A.1, but for the blueshifted component of PGC 015524. Up to down: spatially resolved maps of Hβ, [O III] 2, Hα, [N II] 2 and [S II], and [S II] 2. |
| In the text | |
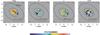 |
Fig. A.3. As in Fig. A.1, but for PGC 046860. Spatially resolved map of [N II] 2. |
| In the text | |
|
Fig. A.4. As in Fig A.1, but for the first gas velocity component of PGC 047177. Up to down: spatially resolved maps of Hβ, [O III] 2, [O I], Hα, [N II] 2 and [S II] and [S II] 2. |
| In the text | |
|
Fig. A.5. As in Fig A.1, but for the second velocity component of PGC 047177. Up to down: spatially resolved maps of Hα, [N II] 2 and [S II], and [S II] 2. |
| In the text | |
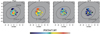 |
Fig. A.6. As in Fig. A.1, but for PGC 047197. Spatially resolved map of [N II] 2. |
| In the text | |
|
Fig. A.7. As in Fig. A.1, but for PGC 047202. Up to down: spatially resolved maps of Hβ, [O III] 2, Hα, [N II] 2 and [S II], and [S II] 2. |
| In the text | |
|
Fig. A.8. As in Fig. A.1, but for PGC 047273. Up to down: spatially resolved maps of Hβ, [O III] 2, Hα, [N II] 2 and [S II], and [S II] 2. |
| In the text | |
|
Fig. A.9. As in Fig. A.1, but for PGC 047590. Up to down: spatially resolved maps of Hα and [N II] 2. |
| In the text | |
|
Fig. A.10. As in Fig. A.1, but for the first velocity component of PGC 049940. Up to down: spatially resolved maps of Hβ, [O III] 2, [O I], Hα, [N II] 2 and [S II], and [S II] 2. |
| In the text | |
|
Fig. A.11. As in Fig. A.1, but for the redshifted component of PGC 049940. Up to down: spatially resolved maps of Hα, [N II] 2 and [S II], and [S II] 2. |
| In the text | |
|
Fig. A.12. As in Fig. A.1, but for the broad Hα component of PGC 049940. |
| In the text | |
|
Fig. A.13. As in Fig. A.1, but for PGC 065588. Up to down: spatially resolved maps of [O III] 2, Hα, [N II] 2 and [S II], and [S II] 2. |
| In the text | |
|
Fig. A.14. As in Fig. A.1, but for the first velocity component of PGC 073000. Up to down: spatially resolved maps of Hβ, [O III] 2, [N I] 2, [O I], Hα, [N II] 2 and [S II], and [S II] 2. |
| In the text | |
|
Fig. A.15. As in Fig. A.1, but for the blueshifted component of PGC 073000. Up to down: spatially resolved maps of Hβ, [O III] 2, [N I] 2, [O I], Hα, [N II] 2 and [S II], and [S II] 2. |
| In the text | |
|
Fig. A.16. As in Fig. A.1, but for the redshifted component of PGC 073000. Up to down: spatially resolved maps of Hβ, [O III] 2, [O I], Hα, [N II] 2 and [S II], and [S II] 2. |
| In the text | |
|
Fig. A.17. As in Fig. A.1, but for PGC 097958. Spatially resolved map of [N II] 2. |
| In the text | |
Current usage metrics show cumulative count of Article Views (full-text article views including HTML views, PDF and ePub downloads, according to the available data) and Abstracts Views on Vision4Press platform.
Data correspond to usage on the plateform after 2015. The current usage metrics is available 48-96 hours after online publication and is updated daily on week days.
Initial download of the metrics may take a while.