Fig. 1.
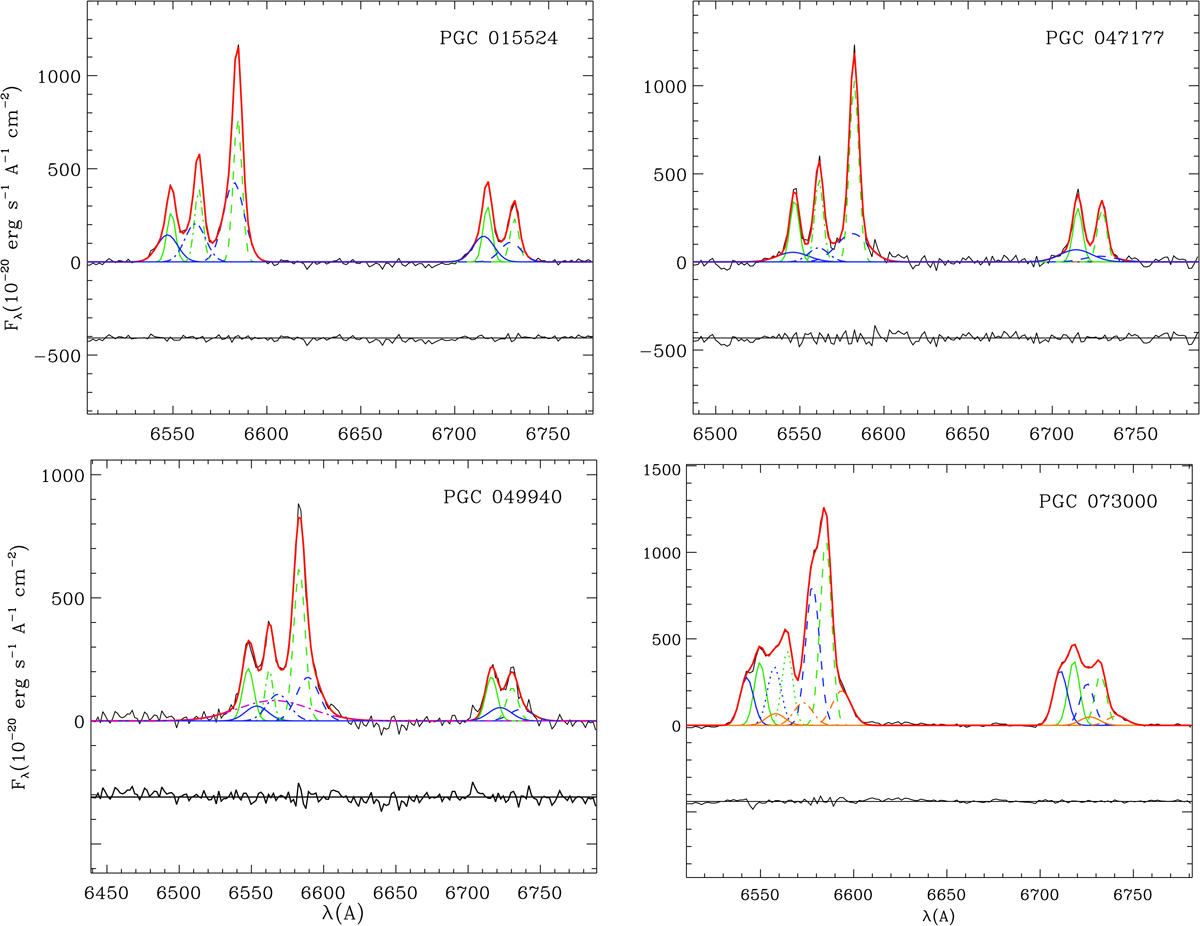
Continuum-subtracted MUSE spectra (black solid line) with best-fitting model (red solid line) obtained by adopting first (green lines), blueshifted and second (blue lines), redshifted (orange lines), and broad (purple lines) components for the [N II], Hα, and [S II] lines. The Gaussian components of the same line are characterised by the same pattern. The residuals are defined as the difference between the observed and model spectrum. They are shifted to an arbitrary zero point for viewing convenience. The galaxy name is reported within each panel.
Current usage metrics show cumulative count of Article Views (full-text article views including HTML views, PDF and ePub downloads, according to the available data) and Abstracts Views on Vision4Press platform.
Data correspond to usage on the plateform after 2015. The current usage metrics is available 48-96 hours after online publication and is updated daily on week days.
Initial download of the metrics may take a while.