Fig. A.1.
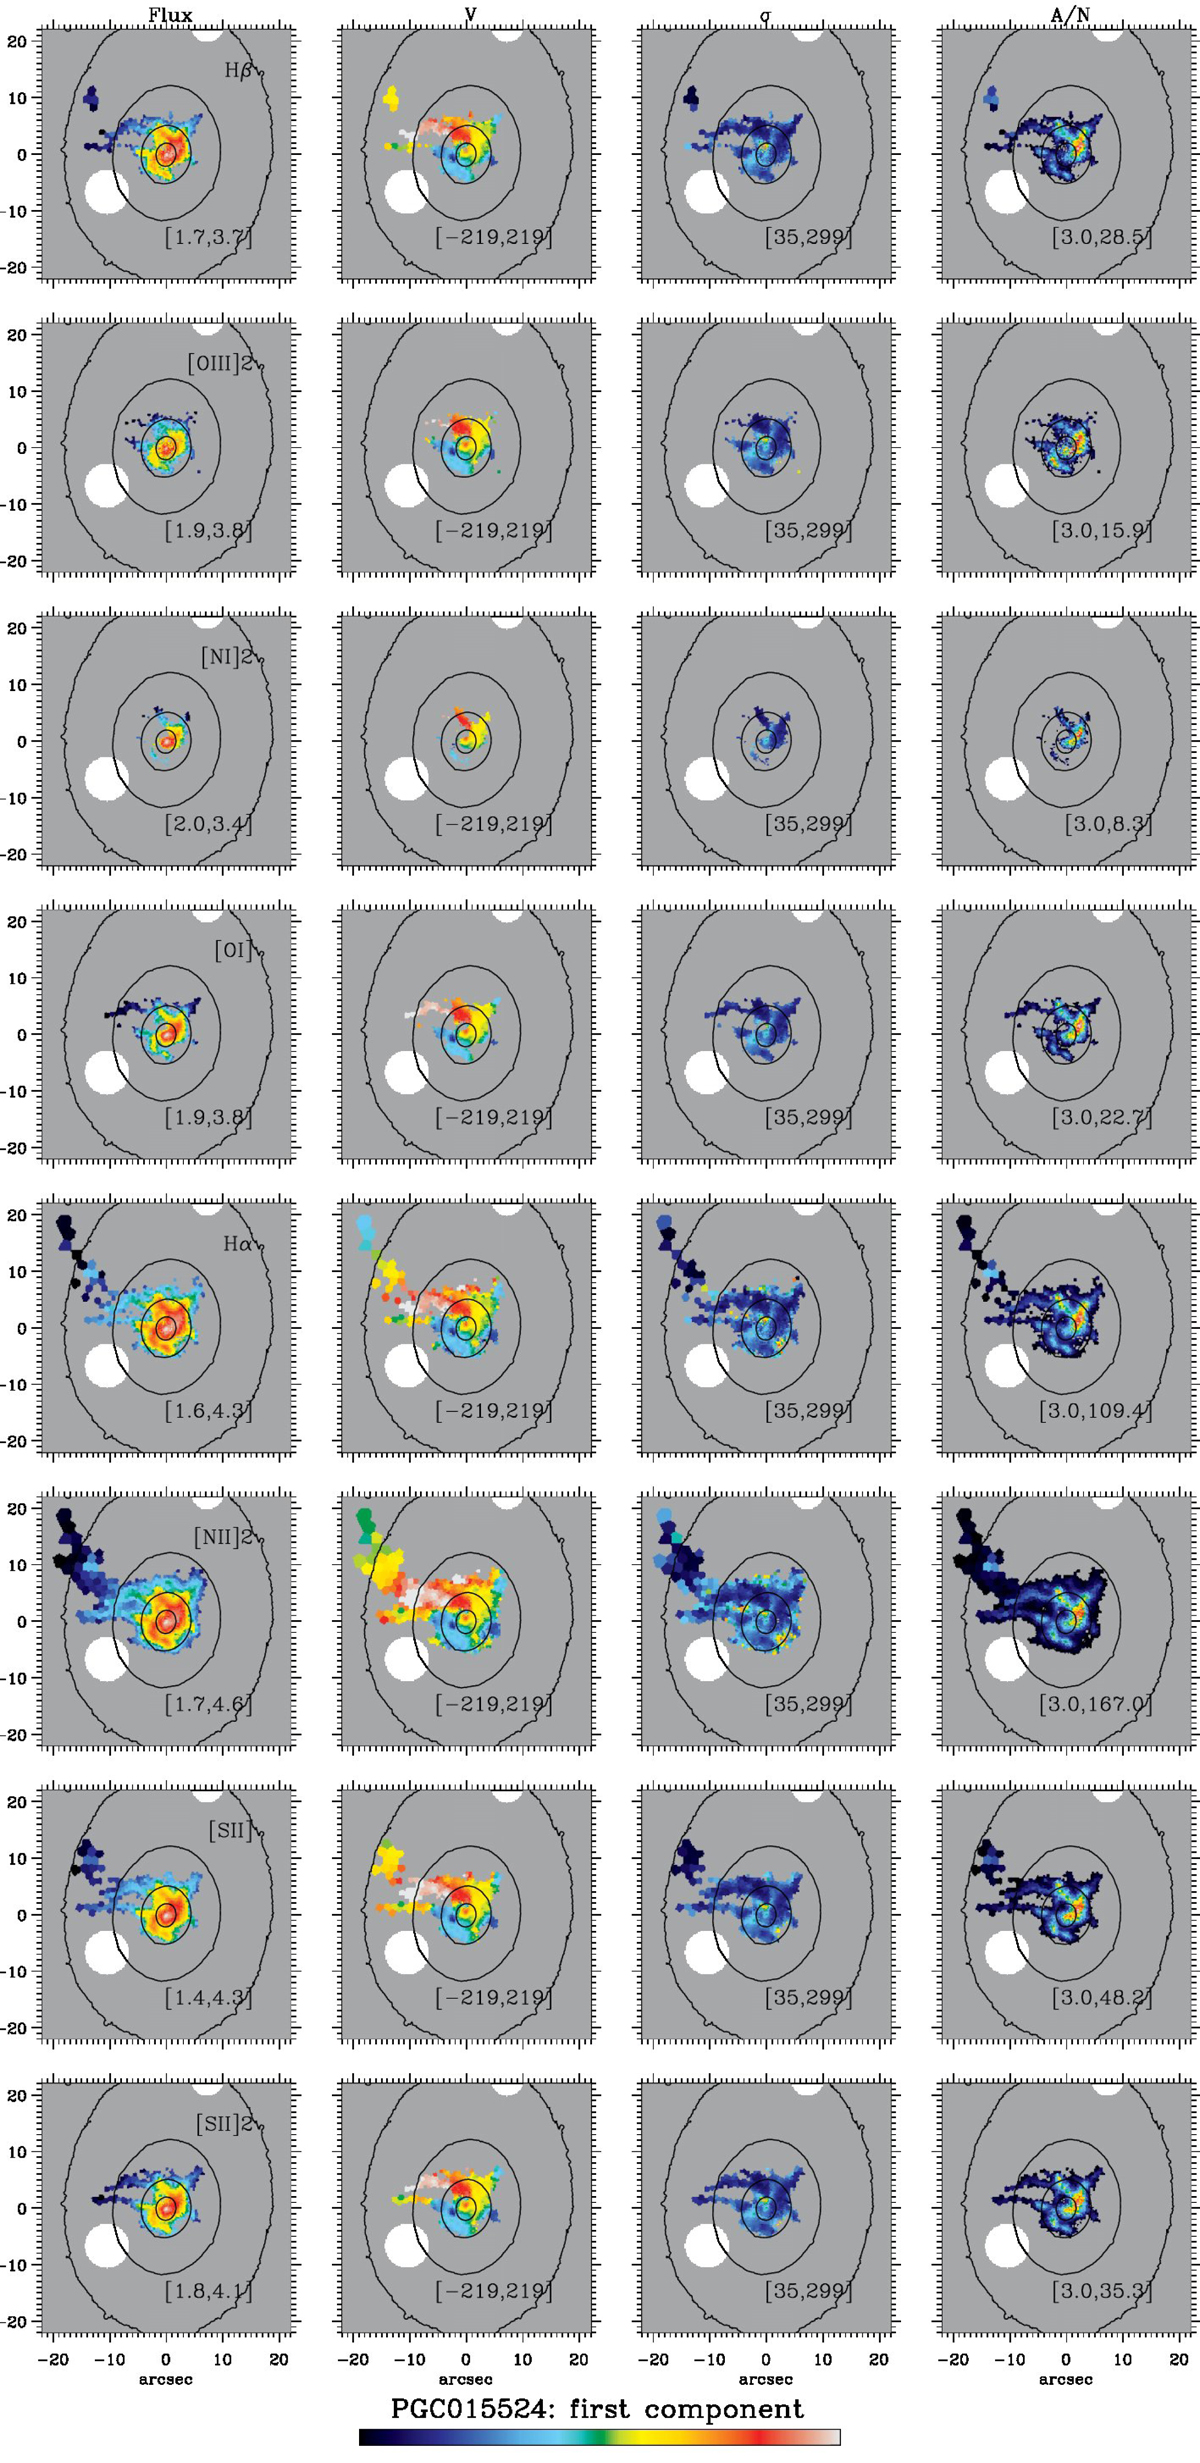
Spatially resolved maps of the first gas velocity component of PGC 015524. Left to right: flux in log 10−20 erg s−1 cm−2 arcsec−2, velocities and velocity dispersions in km s−1, and A/N ratio. The maximum and minimum values in the colour bar are reported in each panel between square brackets. The black dashed contours are isophotes in steps of one magnitude. Up to down: spatially resolved maps of Hβ, [O III]λ5007 ([O III] 2), [N I]λ5200 ([N I] 2), [O I]λ6300 ([O I]), Hα, [N II]λ6583 ([N II] 2), [S II]λ6716 ([S II]), and [S II]λ6731 ([S II] 2).
Current usage metrics show cumulative count of Article Views (full-text article views including HTML views, PDF and ePub downloads, according to the available data) and Abstracts Views on Vision4Press platform.
Data correspond to usage on the plateform after 2015. The current usage metrics is available 48-96 hours after online publication and is updated daily on week days.
Initial download of the metrics may take a while.