Fig. 8.
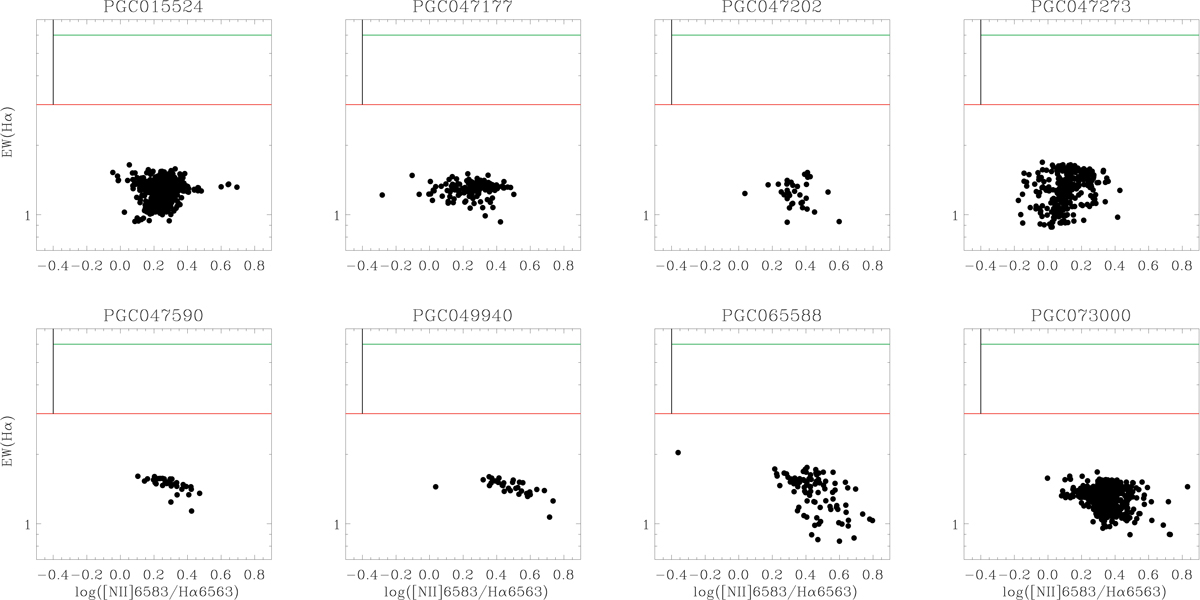
Left to right: WHAN diagram. The lines represent the division between gas ionised by AGN/star formation and “retired” galaxies (above and below the red line, respectively), the optimal transposition of the BPT-based division (Stasińska et al. 2006) between ionisation mechanisms driven by star formation and AGN (to the left and right of the black line, respectively), and of the Kewley et al. (2006) separation between Seyferts and LINERs (above and below the green line, respectively). The names of the galaxies are reported above each panel.
Current usage metrics show cumulative count of Article Views (full-text article views including HTML views, PDF and ePub downloads, according to the available data) and Abstracts Views on Vision4Press platform.
Data correspond to usage on the plateform after 2015. The current usage metrics is available 48-96 hours after online publication and is updated daily on week days.
Initial download of the metrics may take a while.