Fig. 5.
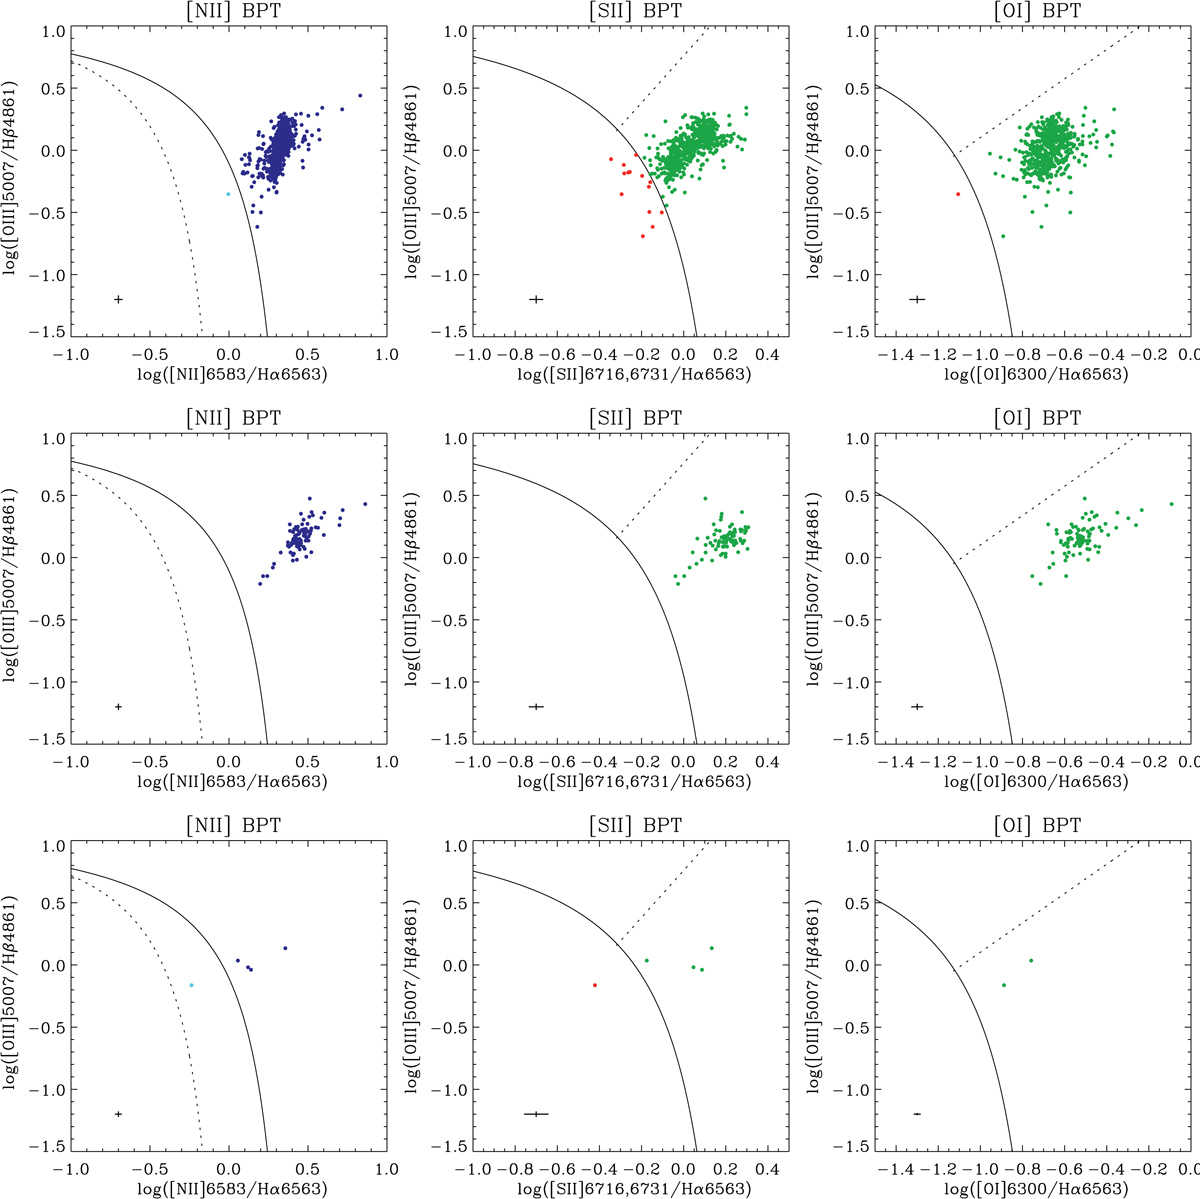
BPT diagrams of PGC 073000. Left to right: [N II]-BPT, [S II]-BPT and [O I]-BPT diagrams. Up to down: BPT diagrams of the first, blueshifted, and redshifted components. The solid curves define the theoretical upper bound for pure star formation (Kewley et al. 2001), the dashed curve in [N II]-BPT defines the upper bound for star formation dominated bins (Kauffmann et al. 2003), and the dashed lines in [S II]-BPT and [O I]-BPT divide Seyfert galaxies from LINERs (Kewley et al. 2006). In the bottom left corner of each diagram the median ±3σ errors are reported. Seyfert-type ionisation is indicated in blue, LI(N)ER regions in the [S II]-BPTs and [O I]-BPTs are displayed in green, SF-dominated bins in red, while composite regions between Kewley et al. (2001) and Kauffmann et al. (2003) curves in [N II]-BPTs are indicated in light blue.
Current usage metrics show cumulative count of Article Views (full-text article views including HTML views, PDF and ePub downloads, according to the available data) and Abstracts Views on Vision4Press platform.
Data correspond to usage on the plateform after 2015. The current usage metrics is available 48-96 hours after online publication and is updated daily on week days.
Initial download of the metrics may take a while.