Fig. 2.
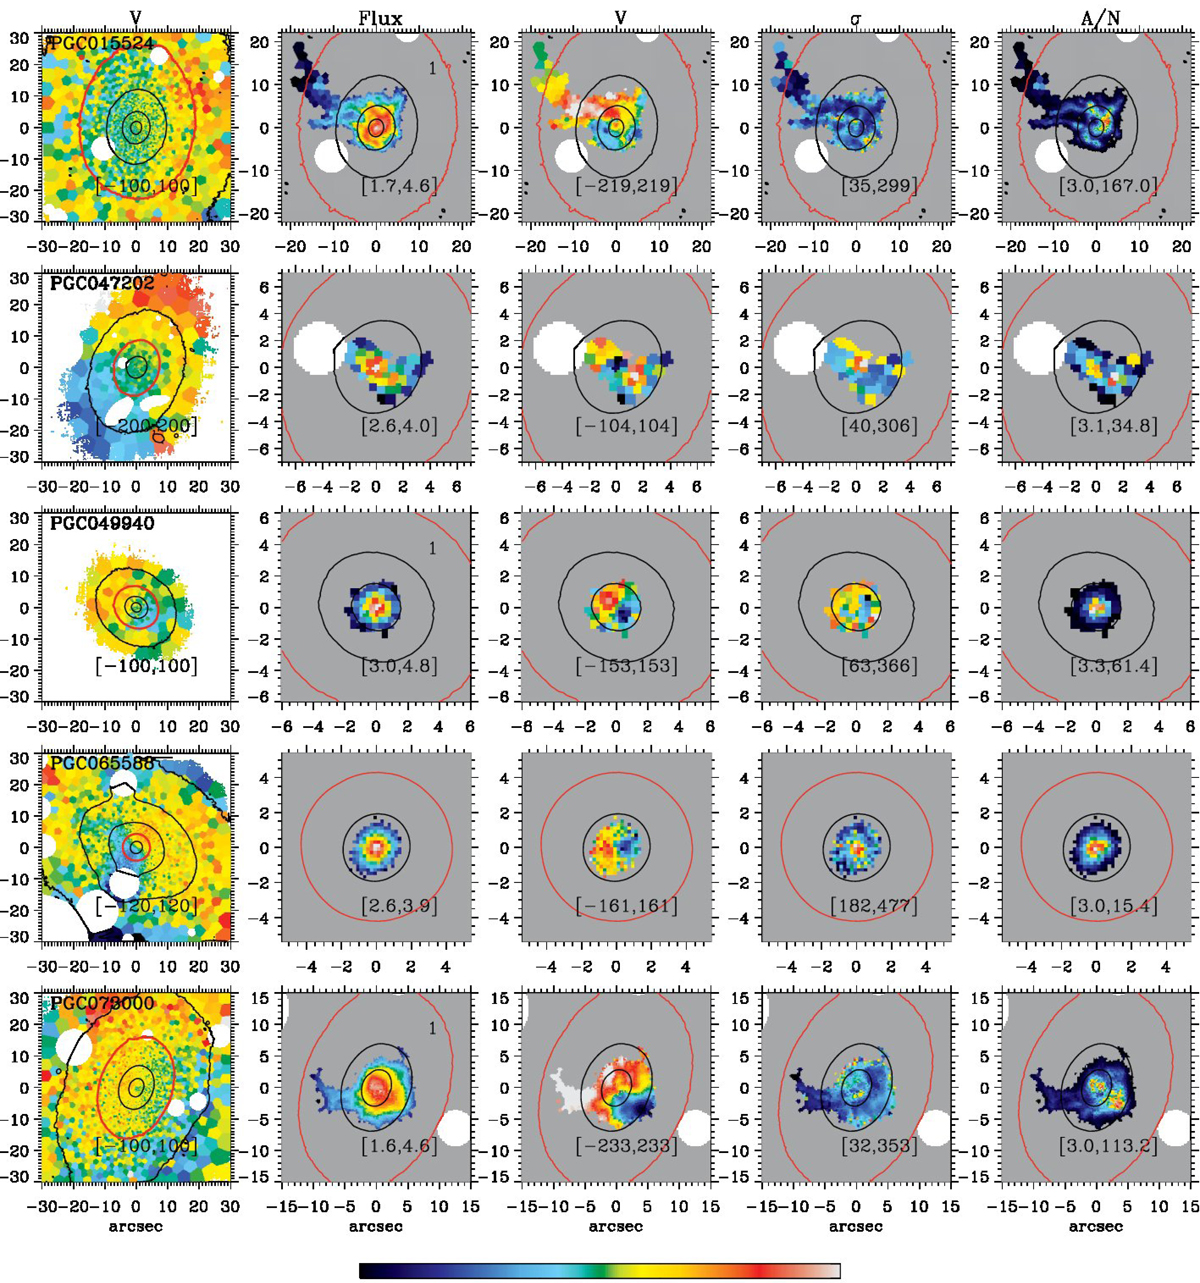
Spatially resolved maps of stellar velocities, [N II] flux, kinematics, and A/N for the 5 BGCs with detected gas. The first component only is shown for those galaxies with emission lines with more than one component (those denoted with 1 in the upper right corner of the flux maps of the gas). Left to right: stellar velocities in km s−1, [N II] flux in log 10−20 erg s−1 cm−2 arcsec−2, velocities in km s−1, velocity dispersions in km s−1, and A/N ratio. The maximum and minimum values adopted in the colour bar are reported in each panel between square brackets. Black and red contours are isophotes in steps of one magnitude. The outermost isophote of the gas maps is enhanced in red to make the spatial region of the gas immediately visible on the stellar velocity panel. Up to down: spatially resolved maps of PGC 015524, PGC 047202, PGC 049940, PGC 065588, and PGC 073000.
Current usage metrics show cumulative count of Article Views (full-text article views including HTML views, PDF and ePub downloads, according to the available data) and Abstracts Views on Vision4Press platform.
Data correspond to usage on the plateform after 2015. The current usage metrics is available 48-96 hours after online publication and is updated daily on week days.
Initial download of the metrics may take a while.