| Issue |
A&A
Volume 647, March 2021
|
|
|---|---|---|
| Article Number | A95 | |
| Number of page(s) | 27 | |
| Section | Extragalactic astronomy | |
| DOI | https://doi.org/10.1051/0004-6361/202039166 | |
| Published online | 16 March 2021 | |
The stellar halos of ETGs in the IllustrisTNG simulations
II. Accretion, merger history, and dark halo connection
1
Max-Planck-Institut für extraterrestrische Physik, Giessenbachstraße, 85748 Garching, Germany
e-mail: This email address is being protected from spambots. You need JavaScript enabled to view it.
2
Excellence Cluster Universe, Boltzmannstraße 2, 85748 Garching, Germany
3
European Southern Observatory, Karl-Schwarzschild-Straße 2, 85748 Garching, Germany
4
Max-Planck-Institut für Astronomie, Königstuhl 17, 69117 Heidelberg, Germany
5
Instituto de Radioastronomía y Astrofísica, Universidad Nacional Autónoma de México, A.P. 72-3, 58089 Morelia, Mexico
6
Max-Planck-Institut für Astrophysik, Karl-Schwarzschild-Str. 1, 85748 Garching, Germany
7
Universität Heidelberg, Zentrum für Astronomie, Institut für theoretische Astrophysik, Albert-Ueberle-Str. 2, 69120 Heidelberg, Germany
8
Harvard-Smithsonian Center for Astrophysics, 60 Garden Street, Cambridge, MA 02138, USA
Received:
12
August
2020
Accepted:
15
January
2021
Abstract
Stellar halos in early-type galaxies (ETGs) are shaped by their accretion and merger histories. We use a sample of 1114 ETGs in the TNG100 simulation of the IllustrisTNG suite with stellar masses 1010.3 ≤ M*/M⊙ ≤ 1012, selected at z = 0 within the range of the g − r colour and λ-ellipticity diagram populated by observed ETGs. We study how the rotational support and intrinsic shapes of the stellar halos depend on the fraction of stars accreted, both overall and separately, by major, minor, and mini mergers. Accretion histories in TNG100 ETGs as well as the final radial distributions of ex-situ stars fexsitu(R) relative to in-situ (“accretion classes”) strongly correlate with stellar mass. Low-mass galaxies have characteristic peaked rotation profiles and near-oblate shapes with rounder halos that are completely driven by the in-situ stars. At high fexsitu, major mergers decrease the in-situ peak in rotation velocity, flatten the V*/σ*(R) profiles, and increase the triaxiality of the stellar halos. Kinematic transition radii do not trace the transition between in-situ- and ex-situ-dominated regions, but for systems with M* > 1010.6 M⊙ the local rotational support of the stellar halos decreases with the local ex-situ fraction fexsitu(R) at fixed M*, and their triaxiality increases with fexsitu(R). These correlations between rotational support, intrinsic shapes, and local fexsitu are followed by fast and slow rotators alike with a continuous and overlapping sequence of properties, but slow rotators are concentrated at the high-fexsitu end dominated by dry major mergers. We find that in ∼20% of high-mass ETGs, the central regions are dominated by stars from a high-redshift compact progenitor. Merger events dynamically couple stars and dark matter: in high-mass galaxies and at large radii where fexsitu ≳ 0.5, both components tend to have similar intrinsic shapes and rotational support, and nearly aligned principal axes and spin directions. Based on these results we suggest that extended photometry and kinematics of massive ETGs (M* > 1010.6 M⊙) can be used to estimate the local fraction of ex-situ stars, and to approximate the intrinsic shapes and rotational support of the co-spatial dark matter component.
Key words: galaxies: elliptical and lenticular, cD / galaxies: evolution / galaxies: halos / galaxies: kinematics and dynamics / galaxies: photometry / galaxies: structure
© C. Pulsoni et al. 2021
 Open Access article, published by EDP Sciences, under the terms of the Creative Commons Attribution License (https://creativecommons.org/licenses/by/4.0), which permits unrestricted use, distribution, and reproduction in any medium, provided the original work is properly cited.
Open Access funding provided by Max Planck Society.
1. Introduction
The Λ cold dark matter (ΛCDM) cosmology predicts that structures form hierarchically, meaning that more massive systems form through the accretion of less massive objects (White & Rees 1978; Peebles 1980). In this model, the formation of massive early-type galaxies (ETGs) is believed to have occurred in two phases (e.g., Oser et al. 2010). After an initial assembly stage, where ETGs form stars in a brief, intense burst which is quickly quenched (e.g., Thomas et al. 2005; Conroy et al. 2014; Peng et al. 2010), at z ≲ 1 galaxies grow efficiently in size through a series of merger episodes, mainly dry minor mergers (e.g., Naab et al. 2009), which enrich the galaxies with accreted (ex-situ) stars. More massive galaxies can have accreted fractions larger than 80%, while lower mass systems are mostly made of in-situ stars and their accreted component is mainly deposited in the outskirts (e.g., Cooper et al. 2013; Rodriguez-Gomez et al. 2016; Pillepich et al. 2018a; Tacchella et al. 2019; Davison et al. 2020).
Elliptical galaxies can be divided into two classes with distinct physical properties (e.g., Kormendy et al. 2009; Cappellari 2016): those with low to intermediate masses and coreless luminosity profiles, and those that are frequently among the most massive galaxies, with cored profiles. This dichotomy in light distribution roughly corresponds to different kinematic properties, with coreless disky objects being rotationally supported, and cored boxy galaxies having low rotation (Bender 1987). In the last decade, the advent of integral field kinematics has lead to a kinematics-based division between fast rotators (FRs) and slow rotators (SRs, Emsellem et al. 2011; van de Sande et al. 2017; Veale et al. 2017; Graham et al. 2018): low mass, coreless, FR ellipticals share similar properties with lenticular galaxies, which are also included in the FR family, while massive cored ellipticals are typically SRs.
State-of-the-art cosmological simulations find that the progenitors of FR and SR at high redshifts (z ∼ 1) are indistinguishable (Penoyre et al. 2017; Lagos et al. 2017; Schulze et al. 2018, with Illustris, Eagle, and Magneticum, respectively). Present-day SR and FR (i.e., the core and coreless) classes result from different formation pathways characterized by different numbers of mergers, merger mass ratio, timing, and gas fractions (Naab et al. 2014; Penoyre et al. 2017, see also the discussion in Kormendy et al. 2009), although the details still depend on the star formation and AGN feedback models adopted by the numerical models (Naab & Ostriker 2017). In general, the result of a formation history dominated by gas dissipation is most likely a coreless FR, while dry major mergers often result in SRs.
A consequence of the two-phase formation is that ETG central regions are the remnants of the stars formed in-situ while the external stellar halos are principally made of accreted material (Bullock & Johnston 2005; Cooper et al. 2010), even though the details strongly depend on stellar mass (Pillepich et al. 2018a). Because of the different origin of central regions and stellar halos, galaxies are expected to show significant variation in their physical properties with radius, such as the shapes of their light profiles (Huang et al. 2013; D’Souza et al. 2014; Spavone et al. 2017; Buitrago et al. 2017), their stellar populations (Coccato et al. 2010; Pastorello et al. 2014; Zibetti et al. 2020), and their kinematics (Coccato et al. 2009; Romanowsky & Fall 2012; Arnold et al. 2014; Foster et al. 2016).
Pulsoni et al. (2018) found evidence for a kinematic transition between the central regions and the outskirts in the majority of the ETGs from the ePN.S survey (Arnaboldi et al. 2017), consisting in variations of the rotational support or changes in the direction of rotation at large radii (see also Coccato et al. 2009; Foster et al. 2016). As a result, ePN.S ETG halos display a variety of kinematic behaviors despite the FR–SR dichotomy of their central regions, with most of the stellar halos displaying similar rotational support V/σ across classes (where V is the rotation velocity and σ the velocity dispersion). These findings suggest that at large radii the dynamical structure of FRs and SRs could be much more similar than in their centers: if halos are mainly formed from accreted material, their common origin would explain their similarities. The measured kinematic transition radii and their dependence on galaxy stellar mass seem to support such an interpretation. Recently, Schulze et al. (2020), using the Magneticum Pathfinder simulations, found that the kinematic transition radius, estimated as the position of the peak in rotation for a subset of FRs with decreasing V/σ profiles, is a good estimator of radius of the transition between in-situ- and ex-situ-dominated regions, especially in galaxies that did not undergo major mergers in their evolution.
In Pulsoni et al. (2020, hereafter Paper I) we investigated the kinematic and photometric properties of simulated ETGs from the IllustrisTNG simulations, TNG50 and TNG100, finding that simulations reproduce the diversity of kinematic properties observed in ETG halos: FRs divide approximately into one-third with flat rotation profiles and high halo rotational support, one-third with gently decreasing profiles, and another third with low halo rotation; while SRs tend to increase rotational support in the outskirts and half of them exceed angular momentum parameter λ = 0.2. Simulated stellar halos are also characterized by a large variety of intrinsic shapes which are strongly related to their rotational support: high rotation is associated with flattened near-oblate shapes; decreasing rotational support with radius is accompanied by a change towards more spheroidal intrinsic shape, with a wide range of triaxiality. These variations in the intrinsic structure of ETGs results in a blurring of the FR–SR bimodality at large radii, with the two families showing a gradual transition in stellar halo properties.
The present study builds upon the results of Paper I. The goal is to relate the kinematic and photometric properties of stellar halos to the galaxy accretion history, parametrized by the total fraction of accreted stellar mass, the mass fraction contributed by different mass ratio mergers, and the fraction of recently accreted cold gas. We then extend the investigation to the properties of the dark matter halos and their relation with the stellar component depending on accretion.
Dark matter halo and galaxy properties are known to be related. Primordially, large-scale tidal fields generate tidal stretching (Catelan et al. 2001) and tidal torquing (Schäfer 2009, for a review) on both baryons and dark matter, inducing shape and spin alignments. In the subsequent evolution, baryonic physics modifies the shapes of inner dark matter halos from triaxial towards rounder and more oblate shapes (e.g., Kazantzidis et al. 2004; Bryan et al. 2013; Chua et al. 2019), while galaxy central regions and outer dark matter halos are more uncorrelated (e.g., Bailin et al. 2005; Deason et al. 2011; Tenneti et al. 2015). This is due to the fact that both centers and outskirts evolve away from the initial shape and angular momentum correlations predicted from the tidal torque theory. On one hand, the outer dark matter halos continue to accumulate accreted material, while on the other, the central regions gain angular momentum through nonlinear tidal torques and dissipation exerted by the gas flows entering the dark matter halos, and are affected by disk instabilities and feedback processes that make the galaxy spins (and shapes) deviate from the halo spins (Zjupa & Springel 2017; Ganeshaiah Veena et al. 2019). Since mergers deposit stars and dark matter alike in the galaxy outskirts, which both follow a collisionless dynamics, then we would expect the (accreted) stellar and dark matter halos to have a similar structure at large radii. This is investigated in the last section of this paper.
The paper is organized as follows. Section 2 summarizes the main characteristics of the IllustrisTNG simulations and describes the selection of the analyzed ETG sample. Section 3 details how physical quantities are measured from the simulated galaxies. Section 4 gives an overview of the accretion parameters used in the main analysis to parametrize galaxy accretion history and their dependence on stellar mass, and studies the different radial distribution of accreted stars in TNG ETGs. Sections 5 and 6 present our analysis of the dependence of the rotational support V/σ(R), the axis ratio q(r), and the triaxiality T(r) profile shapes on the fraction of in-situ stars. We study how mergers shape the galaxy structure and setup local correlations between physical parameters and accreted fraction. Section 7 investigates the connection between stellar and dark matter halos. Section 8 considers the fraction of TNG ETGs with cores made of stars from early compact progenitors, comparing their evolution with respect to ETGs of similar masses. Section 9 discusses some of the main results of the paper. Section 10 summarizes the work and Sect. 11 lists our conclusions.
2. Selection of the sample of ETGs in the IllustrisTNG simulations
The IllustrisTNG simulations are a new generation of cosmological magnetohydrodynamical simulations that model the formation and evolution of galaxies within the ΛCDM paradigm (Springel et al. 2018; Nelson et al. 2018; Pillepich et al. 2018a; Naiman et al. 2018; Marinacci et al. 2018). The model for galaxy formation described in Weinberger et al. (2017) and Pillepich et al. (2018b) includes prescriptions for star formation and evolution, chemical enrichment of the interstellar medium, gas cooling and heating, and black hole and supernova feedback. It builds and improves upon the Illustris simulation (Genel et al. 2014; Vogelsberger et al. 2014) including improvements in the models for chemical enrichment and feedback, and introduces new physics such as the growth and amplification of seed magnetic fields. Overall, the TNG model has been demonstrated to agree satisfactorily with many observational constraints (e.g., Genel et al. 2018; Nelson et al. 2018) and to return a reasonable mix of morphological galaxy types (Rodriguez-Gomez et al. 2019).
In this study we consider the highest resolution realization of the intermediate 110.73 Mpc3 cosmological volume, TNG100 (which is now publicly available; Nelson et al. 2019), in order to exploit the statistically significant number of simulated objects and at the same time satisfactorily resolve their inner structure. The simulation follows the evolution of 2 × 18203 initial resolution elements. The mean mass of the stellar particles is 1.4 × 10⁶ M⊙, while the dark matter component is sampled by 7.5 × 10⁶ M⊙ mass particles. The Plummer equivalent gravitational softening length for the collisionless component at redshift z = 0 is rsoft = 0.74 kpc.
The purpose of this paper is to study the properties of ETG halos and their relation to the accretion history. Here we refer to stellar halos as the outer regions of the galaxies beyond a few effective radii (Re), where the physical properties are often markedly different from those of the central regions within ∼1Re.
We consider a volume- and stellar mass-limited sample of simulated ETGs that were selected as in Paper I. There we used a selection in color and intrinsic shape to extract a sample of ETGs with properties consistent with observations. In particular, we considered the Atlas3D sample properties to validate our selection criteria, as this survey was especially targeted to study a volume-limited sample of ETGs (Cappellari et al. 2011).
Briefly, from the (g − r) color–stellar mass diagram we isolated galaxies in the red sequence by imposing
 (1)
(1)
We restricted the stellar mass range to 1010.3 ≤ M* ≤ 1012 M⊙. This limit in stellar mass assures that the galaxies are resolved by at least 2 × 10⁴ stellar particles. In addition, we selected galaxies with effective radius Re ≥ 2rsoft to guarantee that the regions at r = Re of all simulated galaxies are well resolved. This excludes 42 galaxies at the low-mass end.
The final sample was obtained by further selecting galaxies in the λe − ε diagram, where ε is the ellipticity. There we excluded a fraction of bar-like objects, whose λe − ε properties are not consistent with those of observed ETGs. In Paper I we found that this latter selection does not affect our results on the halo properties of the simulated galaxies. This final criterion restricts the sample to 1114 ETGs, including both centrals (61% of the sample) and satellites, of which 855 are FRs and 259 are SRs. The classification in FRs and SRs uses the threshold  defined by Emsellem et al. (2011), applied to the edge-on projected galaxies to minimize inclination effects. In Paper I we showed that the mass function of the selected sample is in good agreement with the Atlas3D ETGs. In addition, the comparison of the ellipticity distribution at 1Re of the simulated galaxies with the Atlas3D sample showed that overall the selected sample of ETGs contains a balance between disk-dominated and spheroid-dominated galaxies consistent with the observations of a volume- and magnitude-limited sample of ETGs.
3. Methods and definitions
In this section we describe how physical quantities are evaluated from the simulated galaxies. We define the total stellar mass M* as the total bound stellar mass of the galaxy, M* = ∑nmn, where the index n runs over the stellar particles of mass mn. The effective radius, Re, used throughout the paper to normalize radial distances is the edge-on projected half-mass radius. This is the semi-major axis of the elliptical aperture that contains half of the total bound stellar mass. The ellipticity of the aperture is given by the projected flattening of the galaxy at 1Re, measured using the 2D inertia tensor as in Paper I.
3.1. Characterizing the galaxy merger and accretion histories
Stellar particles in the simulated galaxies are tagged as accreted (or ex-situ) or as in-situ following the definition in Rodriguez-Gomez et al. (2016). In-situ stars form within the “main progenitor branch” of the galaxy merger tree, independently of the origin of the star-forming gas. Ex-situ stars form outside the main progenitor branch and are subsequently accreted onto the host galaxy through mergers or stripping events (the fraction of smoothly accreted stars that were not bound to other subhalos at formation is negligible; Rodriguez-Gomez et al. 2016). As mergers can contribute to a significant fraction of gas in the host, which can lead to in-situ star formation, the total ex-situ stellar mass fraction does not directly quantify the merger history but measures the relative importance of dry merging with respect to dissipative processes that increase the fraction of in-situ stars (e.g., Oser et al. 2010).
By definition, the total bound stellar mass of a galaxy is given by the sum of the mass in the in-situ and the ex-situ components M* = Minsitu + Mexsitu. The total in-situ or ex-situ mass fraction is then Mi/M*, with i ∈ {insitu, exsitu}. Throughout the paper we consider also the local in-situ and ex-situ mass fractions, which are the stellar mass fractions measured within a given radial bin. These are indicated by finsitu and fexsitu, respectively.
The ex-situ stars can be distinguished according to whether they were stripped from a surviving galaxy, for example in a flyby or in a merger that is still ongoing at z = 0, or whether they originated from completed mergers. In the case of completed mergers, we classify the stars according to the merger stellar mass ratio. We distinguish between major mergers (i.e., with stellar mass ratio μ > 1/4), minor mergers (1/10 < μ ≤ 1/4), and mini mergers (μ ≤ 1/10).
To describe the galaxy accretion histories, we consider the following parameters:
-
the total in-situ mass fraction;
-
the mean accreted “cold” (star forming) gas fraction of the accreted galaxies at all epochs, weighted by their stellar mass. The gas fraction and stellar mass of the accreted galaxy are measured at the time when its stellar mass is maximum (Rodriguez-Gomez et al. 2017);
-
the redshift of its last major merger zlast;
-
the fraction of in-situ stars that are produced after a certain redshift
 ,
,  :
:![Mathematical equation: $$ \begin{aligned} \Delta _{\mathrm{insitu}, z\le \bar{z}} = [M_{\rm insitu}(z=0) - M_{\rm insitu} (\bar{z})] / M_{\rm *}(z=0). \end{aligned} $$](/articles/aa/full_html/2021/03/aa39166-20/aa39166-20-eq5.gif) (2)
(2)
3.2. Intrinsic shapes
The intrinsic shapes of the galaxies are evaluated using the moment of inertia tensor. For each galaxy we define a coordinate system (x, y, z) centered on the position of the most bound particle, and aligned with the principal axes of the stellar component, such that x is along the intrinsic major axis of the galaxy and z is along the intrinsic minor axis. As the direction of the principal axes of a galaxy might change with the distance from the center, we choose (x, y, z) to be the directions of the principal axes derived for the 50% most bound particles using the inertia tensor Iij,
 (3)
(3)
where the sum is performed over the particles concerned, and xn, i are their coordinates in a system of reference centered on the galaxy and with axes oriented along the sides of the simulation box. Then the edge-on projection of each galaxy is obtained by choosing the y-axis as the line of sight. In this work we indicate with the lower-case letters (x, y, z), (vx, vy, vz), and r the 3D coordinates, velocities, and radii. We reserve capital letters for the edge-on projected quantities. The coordinate r indicates the three-dimensional radius, in the case of quantities calculated in spherical bins, or the intrinsic semi-major axis distance, in the case of quantities calculated in ellipsoidal bins. The coordinate R indicates the edge-on projected semi-major axis distance.
The intrinsic shapes of the galaxies are evaluated by diagonalizing the inertia tensor Iij in Eq. (3) summed over particles in ellipsoidal shells. We follow the same iterative procedure outlined in Paper I for the stellar and dark matter components separately. Each component is divided into spherical shells between galactocentric distances r and r + Δr. In each shell the tensor Ii, j is derived: the square root of the ratio of its eigenvalues gives the axis ratios p = b/a and q = c/a of the principal axes of the ellipsoid (with a ≥ b ≥ c), and the eigenvectors  (with j = a, b, c) their directions. The spherical shell is then iteratively rotated and deformed to a homeoid of semi-axes a = r, b = pa, and c = qa until convergence in the values p and q is reached, that is, the fractional difference between two iteration steps in both axis ratios is smaller than 1%.
The triaxiality parameter is defined as
 (4)
(4)
where r is the intrinsic semi-major axis distance. We consider shapes with T ≤ 0.3 as near-oblate and shapes with T > 0.7 as near-prolate. Intermediate values of the triaxiality parameter define triaxial shapes.
In Paper I we verified that the intrinsic shape measurements are affected by the resolution of the gravitational potential and by the number of particles only for the lowest mass systems, for which we estimated an absolute error of 0.1 on both p and q measured at 1Re. More massive galaxies M* > 1011 M⊙ are much better resolved at r ∼ 1Re. At r ≥ 9rsoft, where rsoft is the softening length of the simulation (i.e., at ≳3.5Re for M* ∼ 1010.3 M⊙ and at ≳1Re for M* ∼ 1011 M⊙), the resolution effects are negligible compared to the errors from limited particle numbers, which we quantified as being of the order of 0.02. This implies an uncertainty on the triaxiality parameter of ΔT ∼ 0.2 for typical FR axis ratios (i.e., q ∼ 0.5 and p = 0.9). At r < 9rsoft, ΔT increases and then intrinsic shapes are better quantified by p and q. The error on the direction of the principal axes is generally very small, but it increases with the axis ratios. For axis ratio p or q/p = 0.5 it is of the order of 1°, and reaches ∼6° for axis ratio of 0.9. At higher values of p and of q/p the uncertainties on the direction of the major axis and minor axis, respectively, grow exponentially. These considerations hold for both stars and dark matter, because the gravitational softening length is identical for both components; the above limitations are derived from the results of Chua et al. (2019) for the Illustris dark matter only simulation. Because the full physics simulation TNG100 has very similar resolution and a larger number of particles in the central regions compared to this dark-matter-only simulation, it is reasonable to expect similar or better convergence in TNG100.
In the paper, we consider shape measurements from shells with at least 1000 particles as reliable (Zemp et al. 2011). This means that we are able to measure intrinsic shapes for the stellar component out to 8Re for 96% of the selected galaxies. Beyond that limit the lower mass objects begin to lack sufficient numbers of stellar particles (see Paper I).
3.3. Rotational support
Ordered rotation in a galaxy is quantified by the ratio V/σ, where V is the mean velocity and σ the velocity dispersion. Summing the components of the angular momentum vectors of all particles in a shell S, weighted by one over the product of the particle mass mn times radius  , we define a mean rotation velocity vector in the shell,
![Mathematical equation: $$ \begin{aligned} u_i(r) \equiv \left[\frac{\left(\sum _{n} m_n \overrightarrow{r_n} \times \overrightarrow{{ v}_n}\right)_{i}}{ \sum _{n} |\overrightarrow{r_n}| m_n}\right]_{n|\overrightarrow{r_n} \in S[r, r+\mathrm{d}r]}, \end{aligned} $$](/articles/aa/full_html/2021/03/aa39166-20/aa39166-20-eq10.gif) (5)
(5)
from which, together with twice the kinetic energy per unit mass k in the shell,
![Mathematical equation: $$ \begin{aligned} k(r) = \left[\frac{\sum _{n} m_n ({ v}_{x,n}^2 + { v}_{{ y},n}^2 + { v}_{z,n}^2)}{\sum _{n} m_n}\right]_{n|\overrightarrow{r_n} \in S[r, r+\mathrm{d}r]}, \end{aligned} $$](/articles/aa/full_html/2021/03/aa39166-20/aa39166-20-eq11.gif) (6)
(6)
we define a mean 3D velocity
 (7)
(7)
and velocity dispersion
 (8)
(8)
The index n runs over the particles within the chosen ellipsoidal or spherical shell S[r, r + dr]. In Sect. 7, where we compare the rotational support of the stellar component to that of the dark matter, we derive V/σ for the two components separately, summing over stellar or dark matter particles within spherical shells of radii r and r + dr.
In Sect. 5 we study the rotational support of galaxies using their edge-on projections in order to minimize inclination effects but at the same time use quantities that are as close as possible to observables. In this case, we calculate quantities within elliptical radial bins of semi-major axis R and R + dR and consider only the particle velocities along the line-of-sight y, VY, n = vy, n, so that
 (9)
(9)
and
 (10)
(10)
In Eq. (9), R is the semi-major axis of the elliptical annulus and UX and UZ are defined analogously to Eq. (5), where the particles are weighted by one over their masses multiplied by projected circular radius. The ratio between Eqs. (9) and (10) gives the edge-on projected rotational support which, for the stellar component, is denoted by V*/σ*(R).
The V*/σ*(R) ratio defined in this way differs from the quantities presented in Paper I where, instead of the mean velocity, we used the rotational velocity derived from 2D mean velocity fields which maximizes the V/σ ratio. The V*/σ*(R) measured here directly from the star particles is roughly equal to the ratio of the mass-weighted average velocity and the mass-weighted average velocity dispersion obtained from the 2D mean velocity fields as built in Paper I:
![Mathematical equation: $$ \begin{aligned} V_{*}/\sigma _{*}(R) \sim \left[\frac{\sum _n m_{n} \left< V_{n} \right>}{\sum _n m_{n} \left< \sigma _{n} \right> } \right]_{n|\overrightarrow{R_n}\in S[R, R+\mathrm{d}R]}. \end{aligned} $$](/articles/aa/full_html/2021/03/aa39166-20/aa39166-20-eq16.gif) (11)
(11)
Here, the n index runs over the Voronoi bins of total mass mn, mean velocity ⟨Vn⟩, and mean velocity dispersion ⟨σn⟩ in the regions where the velocity fields are Voronoi binned (Cappellari & Copin 2003), and it runs over the stellar particles of mass mn, mean velocity ⟨Vn⟩, and mean velocity dispersion ⟨σn⟩ in the regions where the velocity fields are smoothed with the adaptive kernel technique (Coccato et al. 2009). Figure 1 shows the similarity between the V*/σ*(R) profile (dashed green line) with the rotational support derived from the smoothed velocity fields (Eq. (11), open circles) for one example galaxy.
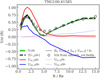 |
Fig. 1. V/σ profiles for an example FR galaxy with M* = 1011.4 M⊙ and counter-rotating ex-situ component in the halo. The V*/σ*(R) profile for the stars (Eqs. (9) and (10), green dashed line) is compared with the V/σ(R) profile derivable from the smoothed velocity fields as in Eq. (11) (open circles), with the |U*, Z(R)|/[σ*(R)] profile (dashed black line), and with the weighted sum of the in-situ and ex-situ contributions (as in Eq. (12), dashed gray curve). The individual un-weighted profiles of the in-situ and ex-situ stars are shown with red and blue curves: the solid lines show the contribution to the mean velocity from the major axis rotation Ui, Z(R)/[σ*(R)], the dotted lines show the contribution from minor axis rotation Ui, X(R)/[σ*(R)]. |
3.4. Rotational support of the in-situ and ex-situ components
We derive the rotational support for the in-situ (Vinsitu(R)) and the ex-situ stars (Vexsitu(R)) using Eq. (9) for the two components separately. We then normalize the mean velocities by the velocity dispersion of the total stellar component σ*(R), although we note that the results of Sect. 5 are unchanged if we normalize by the respective σinsitu(R) and σexsitu(R). For all three components, we use elliptical radial bins with identical edges in each galaxy.
In the same radial bins, we derive the surface mass density of all the stellar particles Σ*(R), of the in-situ stars Σinsitu(R), and of the ex-situ stars Σexsitu(R). From these, we define the local in-situ and ex-situ fractions as fi(R) = Σi(R)/Σ*(R) with i ∈ {insitu, exsitu}. As each star is either classified as in-situ or ex-situ, M* = Minsitu + Mexsitu and finsitu(R)+fexsitu(R) = 1.
By approximating  , we find that the V/σ(R) profiles of the galaxies are almost exactly approximated by the sum of the rotational support of the in-situ and ex-situ components, weighted by their local mass fraction fi(R) profiles,
![Mathematical equation: $$ \begin{aligned}&V_{*}/\sigma _{*}(R) \sim \vert U_{*,Z}(R)\vert /[\sigma _{*}(R)] \nonumber \\&\ \ \ \sim \vert \left[f_{\rm insitu}(R)\, U_{\mathrm{insitu},Z}(R) + f_{\rm exsitu}(R)\, U_{\mathrm{exsitu},Z}(R)\right] \vert / \sigma _{*}(R). \end{aligned} $$](/articles/aa/full_html/2021/03/aa39166-20/aa39166-20-eq18.gif) (12)
(12)
The Ui, Z components need to be summed with their sign, as it is not uncommon for the in-situ and the ex-situ stars to counter-rotate (∼20% of the cases for our sample). We assume a positive sign for the component rotating with the same sign as the total U*, Z at its maximum rotation.
The approximation  holds for the majority of the selected TNG galaxies, for which the median
 . For the in-situ and ex-situ components separately, the Ui, X component is also negligible in most cases (
 and median
 ) but not at large radii or for high-mass systems (e.g., at R = 8Re for M* > 1011.5 M⊙,
  ).
).
Figure 1 shows as an example a massive FR galaxy with M* = 1011.4 M⊙. Its V*/σ*(R) profile, derived from the ratio of Eqs. (9) and (10) and shown with a green dashed curve, has a peak at R ∼ 2Re, decreases to 0 at ∼5Re, and increases again at larger radii. The dashed black curve shows that, for this galaxy, the approximation of the mean velocity V*(R) with the mean major axis rotation |U*, Z(R)| holds at all radii. The gray curve shows the weighted sum of the major axis mean rotation of the in-situ and ex-situ stars divided by the total velocity dispersion, as in Eq. (12): solid green, dashed black, and solid gray curves agree almost perfectly along the whole radial range considered. The rotational support of the in-situ and ex-situ stars is shown by separating the major (Ui, Z(R)) and minor axis (Ui, Y(R)) rotation contributions. For this galaxy the contribution from minor axis rotation is negligible at all radii for the in-situ component and out to ∼8Re for the ex-situ component. The in-situ stars have a “peaked and outwardly decreasing” rotation profile (solid red curve), while the ex-situ stars have a co-rotating central component and a counter-rotating component at large radii contributing to almost all the galaxy rotational support at R > 5Re.
4. Accretion histories of ETGs in TNG100
We begin by studying the dependence of the main accretion parameters on stellar mass for the selected sample of ETGs. For each galaxy, we consider the total fraction of in-situ stars, the mean accreted “cold” (star forming) gas fraction weighted by the mass of the merged galaxies at all epochs, the fraction of in-situ stars produced since z = 1, and the redshift of its last major merger (i.e., with mass ratio μ > 1/4); see Sect. 3.1.
Figure 2 shows the distribution of these parameters for all the sample galaxies and for the FRs and SRs separately. We find a strong dependence with stellar mass in that more massive galaxies have lower in-situ fractions, had recent major mergers, and on average the accreted satellites were poorer in gas (dry mergers). The total ex-situ mass fractions for the IllustrisTNG have already been presented by Pillepich et al. (2018a). Their strong variation with stellar mass was observed there and in different sets of simulations (e.g., Rodriguez-Gomez et al. 2016 in the original Illustris, Davison et al. 2020 in EAGLE), although with some differences due to the different galaxy formation models.
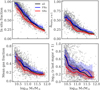 |
Fig. 2. Accretion parameters as a function of stellar mass for ETGs in TNG100, and separately for FRs and SRs: total in-situ mass fraction (top left), fraction of new in-situ stars since z = 1 (top right), mean accreted gas fraction (bottom left), and redshift of the last major merger (bottom right). The solid lines show the median profiles for the whole sample (black) and for FRs (blue) and SRs (red). The shaded regions show the quartiles of the distributions. FRs and SRs follow similar trends with M*, but at fixed M*, SRs have on average more accreted stars, they accreted less gas, and they had more recent major mergers. |
In Fig. 2, FRs and SRs follow similar trends of the accretion parameters versus stellar mass M*, but at fixed M*, the SRs have lower in-situ fractions and had more recent and drier mergers. This is consistent with the findings of previous studies on the relation between galaxy angular momentum, gas accretion, and morphology (e.g., Naab et al. 2014; Rodriguez-Gomez et al. 2017; Lagos et al. 2018; Tacchella et al. 2019).
Each relation comes with a significant amount of scatter, because at each stellar mass, galaxies are characterized by an individual history parametrized by a combination of parameters including the fraction of accreted stellar mass, the time during which this mass was accreted, and how much gas was involved in the accretion. This is shown by the comparison of the relations between the total in-situ mass fraction and the fraction of new in-situ stars since z = 1 (Δinsitu, z ≤ 1) with total stellar mass. Similar to the total in-situ fraction, Δinsitu, z ≤ 1 is a steep function of stellar mass. The most massive galaxies have little in-situ star formation overall and also at z ≤ 1, while galaxies at the low-mass end with total in-situ fractions larger than 90% and Δinsitu, z ≤ 1 ∼ 0.6 exhibit a large variety of recent in-situ star formation histories (the scatter in Δinsitu, z ≤ 1 is 0.2 while the scatter in in-situ mass fraction is 0.07), which are also influenced by the different timing of their gas accretion and star formation. In addition to the considered accretion parameters, the orbital parameters of the mergers also play a role in determining the properties of the remnant (Lagos et al. 2018). This additional investigation is outside of the scope of this study.
4.1. Accretion classes
For each simulated galaxy we derive edge-on projected stellar-mass-density profiles in elliptical radial bins with flattening given by the ellipticity profile of the galaxy. In each bin we obtain the stellar mass density of all the stars Σ*(R) and of the in-situ and ex-situ stars (Σinsitu(R) and Σexsitu(R)). Within the selected TNG galaxies we can identify four groups, or accretion classes, according to their relative radial distribution of ex-situ stars with respect to the in-situ component. The assignment of each galaxy to an accretion class is done by analyzing the sign of the function Σinsitu(R)−Σexsitu(R) and the positions of its zeros. The top panel of Fig. 3 displays the median stellar-mass-density profiles of all the galaxies in each accretion class. The median cumulative stellar-mass-fraction profiles are also shown in the bottom panels. The median stellar-mass-density and cumulative stellar-mass-fraction profiles are available in tabulated form in Appendix A. Figure 4 shows that each of the defined accretion classes dominates in a different interval of stellar mass and is characterized by different accreted fractions.
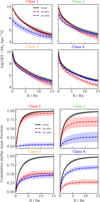 |
Fig. 3. Accretion classes for the simulated sample of ETGs. Top: median stellar-mass-density profiles for each of the four classes defined in Sect. 4.1. The black lines show the median total density profiles, and the red and blue lines show the median density profiles of the in-situ and the ex-situ stars respectively. The shaded regions show the quartiles of the distributions. Bottom: median cumulative stellar-mass-fraction profiles for the in-situ and ex-situ components in the four accretion classes. The shaded regions show the quartiles of the distributions. |
Class 1. Galaxies in class 1 are in-situ-dominated at all radii, and represent 20% of the selected galaxies. More than 53% of the low-mass galaxies (M ≤ 1010.5 M⊙) belong to this group.
Class 2. Galaxies in this class are dominated by the in-situ stars in the central regions, and by the ex-situ stars in the outskirts. For these galaxies, it is possible to define a transition radius Rexsitu as the galactocentric distance at which the ex-situ stars dominate over the in-situ ones (Cooper et al. 2013; Rodriguez-Gomez et al. 2016). These galaxies represent 57% of the selected TNG100 galaxies, most of them with intermediate stellar masses.
Class 3. Class 3 contains all the galaxies where the in-situ and ex-situ stars interchange dominance at different radii (∼14% of the total sample), and galaxies with ex-situ core and in-situ outskirts (∼1% of the total sample).
Class 4. Galaxies in this group are dominated by ex-situ stars at all radii. This group constitutes about 8% of the sample, although at stellar masses M* ≥ 1011.5 M⊙ nearly 64% of the galaxies are in class 4.
As different accretion classes dominate at different stellar masses and the in-situ mass fraction tightly correlates with the stellar mass (Fig. 4), measuring the stellar mass of an ETG gives a good first prediction for its accretion properties. We note that in the original Illustris simulation the great majority (85%) of the galaxies with M* ≥ 1010.3 M⊙ belong to class 2, that is, they have segregated in-situ-dominated central regions and ex-situ-dominated outskirts (see also Rodriguez-Gomez et al. 2016). In TNG100, 60% (57%) of all (ETG) galaxies with M* ≥ 1010.3 M⊙ are in class 2. These differences between the distributions of in-situ and ex-situ stars in galaxies from the two simulations are likely due to the changes implemented in the feedback model for TNG100, as discussed by Tacchella et al. (2019).
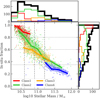 |
Fig. 4. Total in-situ mass fraction as a function of the stellar mass for the four accretion classes. Solid lines show the median profiles for each class and the shaded regions the 25th to 75th percentiles. Dashed vertical lines show the stellar mass bins considered in the text. The dotted horizontal lines show the bins in in-situ mass fraction. Each accretion class dominates at a different stellar mass and is characterized by a different total in-situ mass fraction. |
4.2. Local in-situ and ex-situ density fractions and the contributions from different mass-ratio mergers
From the surface density profiles of the in-situ and ex-situ stellar components we can define the local in-situ and ex-situ fractions fi = Σi(R)/Σ*(R) with i ∈ {insitu, exsitu}. We tagged the ex-situ stars according to their origin (i.e., whether they were stripped or accreted through mergers of different μ; see Sect. 3.1) and derived the local fractions of the ex-situ stars accreted from the different merger classes from the corresponding edge-on projected density profiles fj(R) = Σj(R)/Σ*(R) with j ∈ {major, minor, mini, stripped}, such that ∑jfj = fexsitu. Figure 5 shows radial profiles of the median local fraction of in-situ stars finsitu(R), ex-situ stars fexsitu(R), and of the accreted stars contributed by different mass ratio mergers. Galaxies are divided according to their accretion class (left column) and in stellar mass bins that best “isolate” the accretion classes (as shown in Fig. 4 with vertical dashed lines).
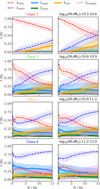 |
Fig. 5. Local median mass fraction f(R) of the in-situ and ex-situ stars (dashed lines). The ex-situ component is then split according to its origin from major, minor, mini mergers, or from stripped galaxies (solid lines, see legend). Galaxies are shown divided into accretion classes (left column) and into stellar mass bins (right column). The spatial distributions of the in-situ and ex-situ components, as well as of the accreted stars contributed by different kinds of mergers, vary for different accretion classes and stellar mass bins. |
Figure 5 shows how the spatial distributions of these stellar components differ between the accretion classes and stellar mass bins. For lower mass galaxies, the accreted stars represent less than 10% of the total M*. These come mainly from mini mergers and are distributed at large radii, determining growing fexsitu(R) profiles. At progressively higher stellar masses, the accreted mass fraction increases. The local fraction from major mergers fmajor(R) is overall higher at all radii and dominates in the central regions over the other components. The fmini(R) profiles instead tend to become flatter at increasing M*. The median fminor(R) profiles show that, on average, the fraction of stellar mass contributed by minor mergers is much lower than that from mini and major mergers. This is driven by the fact that in each mass bin there is a significant fraction of galaxies in which the accreted satellites with mass ratio 1/10 < μ < 1/4 contribute less than 10% of the total accreted mass. This can also be seen in the right panels of Fig. 6 where we show the median mass fraction from different components as a function of the total stellar mass.
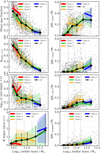 |
Fig. 6. Merger history in different accretion classes. Left: median accretion history parameters as a function of the stellar mass. Right: median mass fractions from different mass ratio mergers and from stripped galaxies as a function of the stellar mass. Shaded regions or error bars show the 25th to 75th percentiles of the distributions. In the bottom left panel (number of major mergers since z = 1) we show mean profiles and standard deviations around the mean. Galaxies are divided into the accretion classes as shown in the legend. The accretion classes defined in Sect. 4.1 are the results of different merger histories. |
In the left column of Fig. 5 we can see again –but in a different form from that of Fig. 3– how the different accretion classes are defined in terms of their finsitu(R) and fexsitu(R) profiles. The median fj(R) (with j ∈ {major, minor, mini, stripped}) profiles follow roughly the same behavior as the corresponding stellar mass bin, considering that class 2 galaxies span a wide range of stellar masses (from 1010.4 M⊙ to above 1011.2 M⊙). We observe that most of the galaxies in class 3 have centrally peaked fmini(R) profiles. These could be explained by the accretion of small compact satellites that are able to reach the central regions of the galaxies before disrupting (e.g., Amorisco 2017).
The overall trends of the median finsitu(R) and fexsitu(R) profiles with stellar mass are consistent with the results of Rodriguez-Gomez et al. (2016) for the original Illustris galaxies, although with some quantitative differences as already noted. The median accreted mass fraction from all mergers is larger in IllustrisTNG than in Illustris for all galaxies with M* ≥ 1010.3 M⊙ (Fig. 10 in Tacchella et al. 2019). However, in both simulations the median fraction of stellar mass contributed by minor mergers (ΔM*, minor/M*) is consistently lower than those from major (ΔM*, major/M*) or mini mergers (ΔM*, mini/M*); see Fig. 6 above and Fig. 4 in Rodriguez-Gomez et al. (2016).
4.3. Accretion classes and merger histories
In Sect. 4.2 we observed that galaxies of different stellar mass, or, almost equivalently, different accretion classes, distribute their in-situ and accreted stars differently. In this section, we show that this is the result of different merger histories.
The left column of Fig. 6 shows the different accretion history parameters –defined in Sect. 3.1 and specified in the headings of the plot– as a function of stellar mass. In the right column we show the stellar mass fraction of the stars accreted from different mass ratio mergers and from stripping events as a function of total stellar mass.
Galaxies of class 1 had few major mergers at early times (high zlast). These contributed to few ex-situ stars compared to the total stellar mass at z = 0, but brought in a large fraction of gas which contributed to the in-situ star formation. Their recent history (after z ∼ 2) is quieter than in galaxies of class 2 with similar M*: they accreted very little and most of their ex-situ stars come from mini mergers which are deposited in the outskirts (Fig. 5).
Class 2 contain a large variety of objects. The least massive are similar to class 1 galaxies, with early gas-rich major mergers and outskirts enriched with ex-situ stars from low-mass (i.e., minor and mini) mergers, although by comparison their last major mergers happened more recently (zlast ∼ 2 versus zlast ∼ 4) and with less gas (45% versus 55%). This implies a larger fraction of ex-situ stars from major mergers, as shown in the top right panel of Fig. 6. The more massive galaxies of class 2 have larger ex-situ fractions: these are contributed by both major and low-mass mergers in similar amounts at 1010.5 < M*/M⊙ < 1011 (∼15% and ∼15%), but at higher stellar masses the contribution from major mergers dominates. Some of the most massive systems (M* ≳ 1011.2 M⊙) had multiple recent (z < 1) major mergers.
The ex-situ-dominated class 4 contains massive galaxies whose evolution is dominated by dry mergers (lowest mean gas fraction). Almost all class 4 galaxies recently (z ≤ 1) went through a dry major merger, half of them more than once. Compared to the most massive systems of class 2, the class 4 galaxies had a more gas-poor history, and on average more recent and more numerous major mergers.
Class 3 collects objects with accreted fractions of ∼0.5, but with stellar masses ranging from 1010.5 to 1011.5 M⊙, and very different accretion histories. The galaxies with (M* ≲ 1011.2 M⊙) are recent (at z < 1) major mergers. These accretion events are more gas-poor compared to galaxies of class 2 with similar masses. The high-mass end of class 3 are galaxies that have not undergone recent major mergers. They had on average a larger mean accreted gas fraction and higher fractions of newly formed in-situ stars compared to class 2 and 4 galaxies of similar stellar masses. We also note that, overall, class 3 galaxies have the highest fraction of stars accreted by mini mergers, and that 81% of class 3 galaxies are fast rotators.
As shown in Fig. 7, FRs and SRs populate all four accretion classes but with very different relative fractions: only 3% of all the FRs populate class 4 and only 5% of the SRs are in class 1. Of the FRs with high M* > 1011.2, 33% belong to class 2, 41% to class 3, and 25% to class 4. Massive SRs belong almost exclusively to class 4 (57%) and class 2 (37%). This underlines both the importance of (dry) mergers in the formation of SRs and that different formation pathways can lead to the formation of a fast or a slow rotating galaxy, in agreement with previous studies (e.g., Naab et al. 2014; Penoyre et al. 2017).
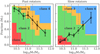 |
Fig. 7. Fraction of FRs (left) and SRs (right) that populate each accretion class as a function of stellar mass, represented with a cumulative bar plot. The open circles show the fraction of fast or slow rotators in each mass bin. The vertical dashed lines represent the stellar mass bins adopted in the paper. FRs and SRs populate the four accretion classes differently, highlighting the different accretion histories of the two classes, but also that several formation pathways can lead to the formation of a FR or a SR. |
5. V/σ(R) profiles and accretion history
In this section we study how galaxy rotational support depends on accretion history. We do not distinguish galaxies using the accretion classes themselves as defined in the previous section, which cannot be readily derived from observations, but we rather divide them into stellar mass bins that best match the different classes.
5.1. V/σ(R) profiles and in-situ fractions
We start by quantifying the galaxy rotational support using the edge-on projected V*/σ*(R) profiles of the all the stars derived as in Sect. 3.3. Figure 8 shows median V/σ*(R) profiles in stellar mass bins for FRs and SRs in two separate arrays of figures. The top panels of Fig. 8 show the median V*/σ*(R) for the total stellar component. For the FRs, the median profiles typically have a peaked and outwardly decreasing shape while the SRs show on average a mild increase of rotational support at large radii. However, in each mass bin, galaxies come with a variety of profile shapes, from approximately constant with radius to steeply declining for the FRs, and more or less increasing with radius for the SRs. This is reflected in the large scatter around the median. As for the λ(R) profiles (Pulsoni et al. 2020), the shapes of the median V*/σ*(R) profiles weakly depend on stellar mass. For the most massive galaxies, the peak in the V*/σ*(R) profiles of the FRs is nearly absent, and the median halo rotation (R ∼ 8Re) is also suppressed compared to lower mass galaxies (see Paper I).
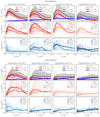 |
Fig. 8. V/σ(R) profiles for the TNG FRs (top panels) and SRs (bottom panels) divided into mass bins. In the two sets of panels, the first rows show the median V*/σ* profiles of all the stars in black. The red and blue curves are the median fi(R)Ui, Z(R)/σ*(R) profiles for the in-situ and ex-situ stars, respectively. The sum of these median profiles approximates the median V*/σ*(R) profiles up to a median absolute difference of 0.02. The middle and bottom rows show the median |
In Sect. 3.4 we showed that the total V*/σ*(R) profiles can be well approximated by the weighted sum of the rotational support of the in-situ and ex-situ stars (Eq. (12)). This is done by neglecting the contribution to the angular momentum from minor axis rotation, which is small in most cases. As already observed in Paper I, only a small fraction of the selected TNG ETGs display significant kinematic twist. The red and blue curves in the top panels of the two arrays of Fig. 8 show the median in-situ and ex-situ contribution fi(R)Ui, Z(R)/σ*(R), with i ∈ {insitu, exsitu}. The median in each radial bin takes into account the few systems with counter-rotating in-situ and ex-situ components, namely with Ui, Z(R) having opposite sign (Sect. 3.4). The sum of these median profiles approximates the total median V*/σ*(R) profile in each mass bin very well, within an absolute median difference of 0.02 (the absolute maximum difference is 0.12).
The contribution from the in-situ stars to V*/σ*(R) is on average a peaked profile, even in the case of the low-mass SRs. By comparison, the ex-situ stars have flat fexsitu(R)Uexsitu, Z(R)/σ*(R) profiles with radius and contribute little to the total rotation, except for the high-mass (M* > 1011.2 M⊙) FRs and for the intermediate-to-high-mass (M* > 1010.9 M⊙) SRs, meaning that in most of the sample galaxy rotation is driven by the in-situ stars.
We see a clear dependence on stellar mass of the contribution of the in-situ and ex-situ components to the total profiles, which is due to the strong mass dependence of the weights fi(R) (Fig. 5) more than to a variation with mass of the rotational support of the individual components (see below). At progressively higher masses, the contribution from the in-situ stars to the total rotational support decreases, while that from the accreted component mildly increases, resulting in a median total V*/σ*(R) that is almost independent of stellar mass for FRs with M* ≲ 1011.2 M⊙ and for SRs with M* ≲ 1010.9 M⊙. At larger stellar masses, the rotation of the in-situ stars is almost erased and the in-situ contribution finsitu(R)Uinsitu, Z/σ*(R) becomes comparable to that of the ex-situ component.
The middle and bottom rows of both arrays in Fig. 8 show the median Vinsitu/σ*(R) and Vexsitu/σ*(R) profiles, now defined as the ratio of Eqs. (9) and (10), meaning that Vi/σ*(R) is always a positive quantity. In each mass bin we divide galaxies according to their total in-situ mass fraction (bins as in Fig. 4). Galaxies with similar stellar mass have, on average, more peaked Vinsitu/σ*(R) profiles if their in-situ fraction is higher, meaning that the peak value of the Vinsitu/σ*(R) profiles is approximately proportional to the in-situ mass fraction. The maximum rotational support of the in-situ stars themselves only weakly depends on stellar mass, (again) except for high-mass FRs and intermediate-to-high mass SRs.
The median Vexsitu/σ*(R) are generally quite flat and independent of the in-situ (or, equivalently, of the ex-situ) mass fraction. While for the SRs the Vexsitu/σ*(R) profiles seem also insensitive to stellar mass, in the FRs we find an overall increase in the mean rotation of the ex-situ stars with stellar mass. On the other hand, the scatter on the Vexsitu/σ*(R) profiles is much larger than the median variations among stellar mass bins, reflecting the variety of merger histories of the FRs at all stellar masses (see also Fig. 7 and Sect. 4.3). We verified that the scatter around the median in-situ and ex-situ profiles does not reduce for different binning choices of the in-situ mass fraction.
In the FRs, the typical peaked and outwardly decreasing shape of the total V*/σ*(R) profiles is due to the in-situ stars, while the ex-situ component sets a constant level of rotational support at large radii. Galaxies with negligible accreted mass also display peaked and outwardly decreasing V*/σ*(R) profiles (see also Fig. 9B). We verified that this is true for both central and satellite galaxies (figure omitted for brevity). An increasing fraction of ex-situ stars (or a decreasing in-situ fraction) is accompanied with progressive weakening of the peak and a flattening of the Vinsitu/σ*(R) profiles at large radii. At the same time the rotational support of the ex-situ stars, Vexsitu/σ*(R), is insensitive to variations in the ex-situ fraction. These results imply that in the TNG FRs the decrease of rotational support in the stellar halo is not simply explainable as the weighted sum of a rotating disk-like in-situ component and a dispersion-dominated spheroidal ex-situ component. The kinematic transition into the spheroidal dispersion-dominated halo in the TNG FRs is driven mainly by the in-situ stars. In addition, Fig. 8 indirectly shows that (major) mergers dynamically suppress rotation also in the in-situ component thereby determining the flattening of the Vinsitu/σ*(R) profiles and an overall decreased rotation from the centers 1−2Re to the outskirts (≳8Re).
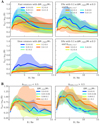 |
Fig. 9. Effect of mergers on the V*/σ*(R) profiles. A: major mergers. Median profiles for the FRs (top left) and the SRs (bottom left) in bins of accreted mass fraction from major mergers ΔM*, major/M*. The right panels show the median V*/σ*(R) for different Δinsitu, z ≤ 1 fractions and within a narrow range of ΔM*, major/M* fractions. Major mergers erase the peak in rotation and flatten the profiles. The presence of cold gas preserves or builds up the centrally rotating component. B: mini mergers. Median profiles for ETGs with negligible fraction of accreted mass from major, minor mergers, or stripped from surviving galaxies in bins of accreted mass fraction from mini mergers ΔM*, mini/M*. The left panel shows galaxies with Δinsitu, z ≤ 1 lower than the median Δinsitu, z = 0 = 0.61 for class 1 galaxies (i.e., with lower recent star formation), while the right panel shows those with Δinsitu, z ≤ 1 higher than the median. Mini mergers are not massive enough to modify the peak in rotation, but on average, and for low-mass systems, tend to increase the rotational support at large radii. |
This conclusion is also supported by the comparison of the Vinsitu/σtot(R) profiles between FRs and SRs in Fig. 8. At fixed stellar mass, the SRs have on average larger fractions of major mergers and a more recent, more gas-poor accretion history (Sect. 4). Therefore, at fixed stellar mass and in-situ fraction, SR galaxies have distinctly flatter rotation profiles.
5.2. V/σ(R) profiles and merger mass ratio
In this section we study how mergers affect the shapes of the ETG V*/σ*(R) profiles. We start with the effect of major mergers. In Fig. 6 we show that the fraction of accreted mass from major mergers ΔM*, major/M* depends on mass, with the lowest mass galaxies having negligible ΔM*, major/M* while for higher mass galaxies (M* > 1010.75 M⊙) the ex-situ fraction from major mergers spans a wide range, from 0 to 60% and up to 80% for a few objects above 1011.5 M⊙. Figure 9A shows the effect of major mergers on the galaxy rotational support. The left panels of Fig. 9A show how the V*/σ*(R) profiles vary in bins of ΔM*, major/M* in FRs (top panels) and SRs (bottom panels). Increasing ΔM*, major/M* clearly erases the peak in rotation and flattens the profiles. In extreme cases, where the FRs have ΔM*, major/M* ≳ 0.4, the Vtot/σtot(R) profiles are flat from the central regions to the halos. In SRs, major mergers prove to be much more effective in flattening the profiles, as for these galaxies mergers are more gas poor and more recent (see Sect. 4.3).
The left panels of Fig. 9A show together FRs and SRs of stellar masses from 1010.3 to 1012 M⊙, which assemble at different epochs and with different gas fractions. Each of these variables plays a role in determining the final shape of the V*/σ*(R) profiles. The right panels of Fig. 9A show, for example, the role of recent cold gas accretion (parametrized here by Δinsitu, z ≤ 1) for galaxies with a similar fraction of stellar mass accreted from major mergers (here we show 0.1 ≤ ΔM*, major/M* ≤ 0.3). The presence of gas (in situ or accreted in the mergers) is essential to preserve/build up the central rotating disk-like structure. The comparison between the median profiles of FRs and SRs with similar ΔM*, major/M* and Δinsitu, z ≤ 1 suggests that other variables may determine the shape of the profiles, such as for example the timing of the merger. A galaxy may or may not have its rotating component destroyed if its accreted mass comes from a more recent merger and it has not had time to rebuild the disk.
To isolate the effect of mini mergers, we select galaxies that accreted a negligible fraction of mass from major mergers, minor mergers, or stripped from surviving galaxies (less than 1% of M* from each). Most of these galaxies have low stellar masses, M* < 1010.5 M⊙, but some reach M* < 1010.9 M⊙. The selected galaxies are mostly FRs (∼97%) and have accreted mass fractions from mini mergers ΔM*, mini/M* ranging from 0 to 30%. The median number of mini mergers per galaxy is 30. Figure 5 shows that the accreted star from mini mergers for galaxies with M* < 1010.9 M⊙ are mainly deposited in the outskirts.
Figure 9B shows the median V*/σ*(R) profiles for this group of galaxies for different ΔM*, mini/M* fractions. We distinguished between galaxies with a low fraction of recently formed in-situ stars Δinsitu, z ≤ 1 (left panel) and galaxies with high Δinsitu, z ≤ 1 (right panel). In this way, we take into account variations in the V*/σ*(R) profiles due to the recent accretion of gas. We find that, independently of Δinsitu, z ≤ 1, galaxies with the lowest ΔM*, mini/M* fractions have peaked and outwardly decreasing profiles. Higher ΔM*, mini/M* fractions progressively increase the rotational support of the outermost regions while roughly conserving the height of the peak. These trends persist when considering only central galaxies (not shown here for brevity). The recent gas accretion parametrized by Δinsitu, z ≤ 1 has the overall effect of increasing the peak of rotation from a median ∼0.75 to a median ∼1.
Finally, we studied (although do not show here for brevity) the effect of minor mergers. We selected a sample of galaxies within a narrow range of accreted stellar mass from major mergers (ΔM∗,major/M∗ ∈ [0.1,0.2], giving the minor mergers) to include more massive systems and at the same time limit the impact of major mergers. Minor mergers have a somewhat similar effect to the major mergers. If their contribution is high enough, they can weaken the peak of rotation, meaning that galaxies with ΔM*, minor/M* ≳ 10% have a significantly lower maximum in their V*/σ*(R) profiles (peak value∼0.5) with respect to galaxies with ΔM*, minor/M* < 5% (peak value ∼0.9). On the other hand, we find that the rotational support of the halo regions (R ∼ 8Re) is independent of ΔM*, minor/M*.
5.3. Dependence of the V/σ(R) profiles on other parameters
In Sect. 5.2 we demonstrate that the shape of the V*/σ*(R) profiles is influenced by several physical processes that are at work in the galaxy assembly history. Accretion parameters correlate more or less tightly with stellar mass, and hence with each other (Figs. 2 and 6; see also Rodriguez-Gomez et al. 2017). For example, galaxies with the lowest stellar mass have on average the highest in-situ mass fraction and the highest mean accreted gas fraction. Assuming that the total stellar mass and the in-situ mass fraction (or, equivalently, the ex-situ mass fraction) are the two fundamental variables (Sect. 5.1), we studied whether there are additional residual correlations with other accretion history properties.
We inspected (albeit not shown for brevity) the Vinsitu/σ*(R) profiles in bins of stellar mass and in-situ fractions for variations of mean gas fraction, in-situ stellar mass formed after z = 1, stellar mass accreted via major mergers, redshift of the last major merger, and number of major mergers: we find no secondary dependencies. The lack of such correlations indicates that even though the shape of the Vinsitu/σtot(R) profiles is sensitive to different accretion parameters which describe the details of the galaxy formation histories, their effect is already taken into account by the total stellar mass and the total in-situ mass fraction. We repeated this study for the total V*/σ*(R) profiles and found almost identical results.
5.4. Rotational support and the local accreted fraction
The V*/σ*(R) profile shapes at different stellar masses are primarily regulated by the in-situ mass fraction (Sect. 5.1). The typical profile of a low-mass galaxy with negligible accreted fraction is a peaked profile that decreases at large radii. At higher stellar masses and ex-situ fractions, mergers modify the rotational support of the in-situ components and add the contribution of the ex-situ stars, meaning that the outskirts of galaxies (R > 2−3Re) show a large variety of stellar halo rotational support in qualitative agreement with extended kinematic studies of observed ETGs (Pulsoni et al. 2018, see also Paper I). However, Fig. 8 shows that, at fixed stellar mass and in-situ mass fraction, galaxies exhibit a large scatter around the median profiles. In Sect. 5.3 we show that this scatter is not due to the additional accretion parameters investigated.
A possible explanation for the large scatter in the profiles comes from Figs. 4 and 5: galaxies with similar masses and similar total in-situ fractions can have different spatial distribution of in-situ and accreted stars, for example if they belong to different accretion classes. This results in a scatter around the median fexsitu(R) profiles. In this section we investigate whether the stellar halo rotational support has a clearer dependence on the local fraction of accreted stars (i.e., both measured at the same radius) rather than on the total accreted mass fraction.
We proceed as follows. The outer regions (3−8Re) of each TNG100 galaxy are divided into seven elliptical shells with semi-major axis R and flattening following the ellipticity profile of the galaxy. In each shell, we measure the rotational support of the stellar particles V*/σ*(R) and the local ex-situ mass fraction fexsitu. The minimum radius of 3Re is motivated by the requirement that R should be sufficiently large that the V*/σ*(R) profiles of the TNG FRs reach their peak rotation, which occurs at a median radius of ∼2.7Re.
Figure 10 shows the rotational support V*/σ*(R) as a function of fexsitu(R) measured in the same radial bins. Each data point in the diagram corresponds to a local measurement within one galaxy, meaning that each galaxy is represented by seven data points. Galaxies are divided into stellar mass bins, and FRs and SRs are shown with different colors.
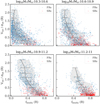 |
Fig. 10. Local correlation between rotational support and accreted fraction in the stellar halos. Each data point corresponds to a local measurement at a radius R ∈ [3−8Re] within each galaxy. Blue circles show measurements within FRs, red circles within SRs. The solid lines show the median, the error-bars the quartiles, and the shaded regions the 10–90 percentiles of the V*/σ*(fexsitu) distributions. Galaxies are divided into stellar mass bins as labeled. At high local ex-situ mass fractions the stellar halo rotational support V*/σ* decreases. |
Figure 10 reveals that there is a strong anti-correlation between these V*/σ* and fexsitu: wherever the local ex-situ contribution fexsitu is high the rotational support is low. As fexsitu decreases, V*/σ* tends to increase but at low fexsitu ≲ 0.2, V*/σ*(R) is independent of fexsitu. These cases correspond mainly to low-mass in-situ-dominated galaxies, in which the kinematic transition to the dispersion-dominated stellar halo is caused by the in-situ stars alone.
The strong dependence of V/σ on the local fexsitu, together with the variations of fexsitu among different galaxies at the same radius, partially explains the large scatter in V/σ(R) profiles. The scatter on the median Vtot/σtot(fexsitu) profiles is reduced by a factor of ∼1.4 compared to the scatter on the median V*/σ*(R).
Slow rotators sit on the same anti-correlation traced by the FRs and populate the tail of the FR stellar halo parameter distributions at high fexsitu. This continuity of local properties between the two classes can be reconciled with the systematic differences in median V*/σ*(R) profiles of FRs and SRs with similar mass and in-situ fraction seen in Fig. 8 by considering their different radial distribution of in-situ versus ex-situ stars as implied in Figs. 5 and 7. Finally, we note that we observe that if we assume that a similar V*/σ* − fexsitu correlation holds in real galaxies, then one could in principle use the observationally accessible V/σ(R) profiles in the stellar halos and stellar masses to estimate the local ex-situ contribution fexsitu(R) in observed galaxies within approximately ±0.16. This range is derived from the average width of the fexsitu distribution at the 10-90 percentiles for different V*/σ* and stellar mass bins. The median and quartiles of the local V*/σ* distribution as a function of the local fexsitu for ETGs with M* > 1010.6 M⊙ is reported in Table A.5.
6. Intrinsic shapes and accretion history
In Paper I we determined the intrinsic shapes of our sample of simulated ETGs and found that kinematics and intrinsic shapes are closely related, such that the kinematic transitions into the stellar halos are accompanied by changes in the galaxy intrinsic shapes. The FRs that decrease in rotational support at large radii tend also to become more spherical in the outskirts, while a fraction with high stellar halo rotation show constant axis ratio q(r) profiles out to large radii. The majority of low-mass FRs have stellar halos consistent with oblate shapes, but at higher stellar masses the fraction of FRs with triaxial stellar halos increases. By comparison, the SRs display milder structural changes with radius, exhibiting rather constant q(r) and triaxiality T(r) profiles. In this section we study the dependence of galaxy intrinsic shapes on accretion.
6.1. Intrinsic shape profiles and in-situ fractions
Figure 11 shows median q(r) and T(r) profiles for FRs and SRs divided into bins of stellar mass and in-situ fraction. The median profiles are built using the profiles of the single galaxies at the radii where resolution effects are small (r ≥ 2rsoft for q(r) and r ≥ 9rsoft for T(r); see Sect. 3.2).
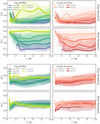 |
Fig. 11. Median stellar intrinsic shape profiles for FRs and SRs as labeled on the right margins. Top panels: triaxiality T(r), bottom panels: axis ratio q(r). Galaxies on the left are divided into stellar mass bins, and galaxies on the right are divided in bins of total in-situ mass fraction. The solid lines show the median profiles, and the shaded regions trace the quartiles of the distributions. Higher stellar masses and accreted fractions correspond to higher triaxiality and less flattened shapes. |
In Paper I we found that triaxiality increases with radius in FRs and that in both FRs and SRs the stellar halo triaxiality (T(8Re)) increases with stellar mass. These trends are visible also in Fig. 11. As M* tightly correlates with the total fraction of in-situ stars (Fig. 2), similar behaviors are found as a function of this variable.
Fast-rotating galaxies with higher M* and in-situ fractions reach the largest values of T in the stellar halo. In the SRs the dependence of T(r) on these parameters is much more striking, such that at similar stellar mass and total in-situ mass fraction, triaxiality is overall systematically higher than in FRs.
From the median q(r) profiles, we see that FRs tend to become slightly rounder at increasing M* and decreasing total in-situ fraction. FRs with higher M*/lower in-situ fraction have rather constant median q(r) profiles while those with lower M*/higher in-situ fractions show more pronounced dips in q at radii corresponding to the positions of the peaks in the median V*/σ*(R) profiles of Fig. 8. The q(r) profiles in SRs are almost independent of these parameters, although SRs with M* > 1011.2 M⊙ or with in-situ fractions < 0.35 have significantly flatter intrinsic shapes at large radii (see also Sect. 6.3), similarly to the few SRs with in-situ fractions > 0.8.
Overall galaxy intrinsic shapes depend on both stellar mass and in-situ fraction but we find (although we do not show here) that at fixed stellar mass the galaxies with highest triaxiality and lowest flattening are those with low in-situ mass fraction (see the scatter in in-situ fraction values in Fig. 2). The results of Fig. 11 indicate that the stellar component that is born in-situ tends to preserve the near-oblate flattened disk-like structure of the star forming gas, at least in the central regions. Therefore, FRs with higher in-situ fractions and lower stellar masses show larger variations of the median q(r) profiles with radius, with the outskirts being rounder than the centers. Instead, galaxies with higher accreted fractions and stellar masses have milder variations of flattening with radius but have overall increased triaxiality at large (FRs) or all (SRs) radii. The collisionless dynamics of gas-poor mergers, which enrich the galaxies with ex-situ stars, is the primary mechanism responsible for changing the intrinsic shapes from near-oblate to spheroidal triaxial, as we demonstrate in Sect. 6.2.
6.2. Intrinsic shape profiles and mergers
In this section we analyze how mergers affect the intrinsic shapes of galaxies. The effects of major mergers on the triaxiality profiles is shown in Fig. 12A. The left panels show median profiles in bins of ΔM*, major/M* for our sample of ETGs divided in FRs and SRs. While for the SRs the effect of ΔM*, major/M* in increasing the median T(r) is rather clear, for the FRs the picture is complicated by the higher fractions of accreted gas (Fig. 2), which on the other hand tend to decrease T(r). The right panels of Fig. 12A show that, at fixed fraction of accreted mass from major mergers ΔM*, major/M*, the galaxies with lowest recent in-situ star formation Δinsitu, z ≤ 1 (i.e., those that did not recently accrete gas) whose recent mergers were then gas-poor are the FRs with increasing T(r) profiles and the SRs with the highest median T(r). Major mergers also affect the q(r) profiles (not shown here) in that galaxies with higher ΔM*, major/M* and lower Δinsitu, z ≤ 1 tend to be on average more spherical, although the effect is not as pronounced as on the T(r) profiles (see Sect. 6.3).
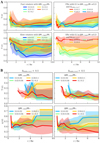 |
Fig. 12. Effect of mergers on the intrinsic shape profiles. A: major mergers in FRs (top) and SRs (bottom). The solid lines show the median triaxiality profiles in bins of accreted mass fraction from major mergers ΔM*, major/M* (left panel) and in bins of Δinsitu, z ≤ 1 for 0.1 ≤ ΔM*, major/M* ≤ 0.3 (right panel). The shaded regions show the quartiles of the distributions. Major mergers increase the triaxiality at large radii, especially when the fraction of recently accreted gas is low. B: effect of mini mergers on the intrinsic shape profiles T(r) (top) and q(r) (bottom) for ETGs with negligible accreted mass from major mergers, minor mergers, and stripped from surviving galaxies. The solid lines show median profiles in bins of accreted mass fraction from mini mergers ΔM*, mini/M*; the shaded regions show the quartiles of the distributions. left panel: galaxies with Δinsitu, z ≤ 1 < 0.5 (i.e., with lower recent star formation), the right panel those with Δinsitu, z ≤ 1 > 0.5. Mini mergers do not significantly influence the galaxy triaxiality but tend to increase the stellar halo flattening. |
Figure 12B shows the effect of mini mergers on the intrinsic shape profiles. Analogously to Sect. 5.2 we isolate the effect of mini mergers by considering galaxies with negligible accreted mass from other accretion channels (i.e., with ΔM*, major/M*, ΔM*, minor/M*, and ΔM*, stripped/M* less than 1% each). The selected galaxies, mostly FRs with M* < 1010.5 M⊙, have their accreted mass accumulated mainly at large radii (Fig. 5). We group the galaxies into bins of accreted mass fraction from mini mergers (ΔM*, mini) and use Δinsitu, z ≤ 1 = 0.5 to distinguish between galaxies with recent gas accretion and in-situ star formation (right panels in Fig. 12B) and those with more quiescent recent star formation history (left panels).
We see that mini mergers do not clearly affect the triaxiality profiles; the majority of the selected galaxies are consistent with being near-oblate (T ≤ 0.3) at all radii. On the other hand, we find that, independently of Δinsitu, z ≤ 1, galaxies with negligible ΔM*, mini/M* have low q ∼ 0.4 at r ∼ 1Re which increases to q ∼ 0.6 at r > 4Re. Increasing contributions of mini mergers tend to flatten the stellar halos along with increasing their rotational support (Fig. 9B). Finally, galaxies with higher recent star formation (i.e., recent cold gas accretion) tend to have on average more flattened shapes, both at the centers and at large radii. Figure 12B shows results consistent those in Fig. 9B. Galaxies dominated by in-situ stars at all radii with negligible accreted mass (ΔM*, mini/M* < 0.02 in Fig. 12B) display characteristic peaked and outwardly decreasing V*/σ*(R) profile shapes and growing q(r) profiles in the stellar halo. The kinematic transition is accompanied by a change in the dynamical structure of these galaxies, both completely driven by the in-situ stars. We verified, although we do not show for brevity, that these results also hold if we consider central galaxies alone.
Figure 12B indirectly shows that high-mass-ratio mergers are essential for galaxies to reach high values of triaxiality. We found (but do not show here for brevity) that minor mergers, studied in a sample of galaxies selected within a narrow range of accreted mass fractions from major mergers ΔM*, major/M* ∈ [0.1, 0.2] (see also Sect. 5.2), can have the effect of increasing the galaxy triaxiality at large radii if their contribution is large enough (> 10% of the total stellar mass). Contrary to mini mergers, higher fractions of ΔM*, minor/M* lead to less flattened shapes (q ≳ 0.5).
The results described in this section demonstrate that the galaxy accretion history models the intrinsic shapes of galaxies in different ways according to the contribution of the various accretion channels. On the other hand, the fact that the gas fraction, the recent formation of in-situ stars, and the fraction of accreted mass from major mergers are all tightly correlated with stellar mass (Fig. 6), reduces the degree of freedom of these parameters. We conducted a study on the intrinsic shape profiles similar to that for the V*/σ*(R) profiles in Sect. 5.3 to test their dependence on accretion parameters other than the total in-situ mass fraction. As for the V*/σ*(R) profiles, we find no additional dependence once the total stellar mass and the total in-situ mass fraction have been taken into account.
6.3. Intrinsic shapes and the local accreted fractions
Here we explore the relation between local galaxy intrinsic shapes and accreted stellar mass fraction. This is done by measuring the mass fraction of accreted stars within three-dimensional ellipsoidal shells that approximate the isodensity surfaces. The outskirts of galaxies between 3.5 ≤ r/Re ≤ 8 are divided into six spherical radial bins. Each of these spherical bins is deformed into a homeoid with fixed semi-major axis length following the iterative procedure described in Sect. 3.2. The ratios of the homeoid semi-axes give the local intrinsic shapes; within each homeoid we derive the total three-dimensional stellar mass density ρ*(r), and three-dimensional density of the ex-situ component ρexsitu(r). From the ratio fexsitu(r) = ρexsitu(r)/ρtot(r) we obtain the local three-dimensional ex-situ fraction.
Figure 13 shows the intrinsic shape parameters q(r) and T(r) as functions of the local ex-situ fraction fexsitu(r). Galaxies are plotted in stellar mass bins, and SRs and FRs are shown with different colors. We find that the halo intrinsic shapes and fexsitu are correlated. Their relation is more complicated than the simple linear correlation between rotational support and fexsitu(R) observed in Fig. 10. We find that stellar halos are near-oblate where fexsitu < 0.4 but at larger local ex-situ fractions they show increasingly larger triaxiality. The axis ratio q(r) strongly correlates with fexsitu(r) up to a break at fexsitu ∼ 0.7, beyond which the q(fexsitu) is an anti-correlation. The break of the q(fexsitu) relation explains the modest effects of the total in-situ fraction on the median q(r) profiles for galaxies with large total ex-situ fractions, such as the massive FRs and the intermediate- to high-mass SRs, as well as the change in trend seen in the median profiles of the SRs with M* > 1011.2 M⊙ in Fig. 11. We note that class 1 galaxies, mainly present in the lowest stellar mass bin at low fexsitu, do not follow the q(fexsitu) correlation, as changes in flattening are driven by the in-situ stars only (see Sect. 6.2). For M* ≥ 1010.6 M⊙ galaxies, the q(fexsitu) and T(fexsitu) relations are clear. The median and quartiles of the distributions of q and T as a function of the local fexsitu for ETGs with M* > 1010.6 M⊙ are reported in Table A.5.
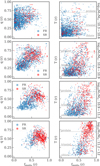 |
Fig. 13. Local correlation between stellar halo intrinsic shape and fraction of accreted stars in stellar mass bins. Each galaxy is represented by about six data points, measured in ellipsoidal shell with semi-major axis r ∈ [3.5−8Re]. The correlations are clear for galaxies more massive than M* > 1010.6 M⊙. Low fexsitu is consistent with near-oblate shapes with low axis ratio q. At higher fexsitu the stellar halo triaxiality parameter increases while the q(fexsitu) correlation reaches a maximum of q ∼ 0.6 for fexsitu ∼ 0.7, beyond which the q decreases. |
The q(fexsitu) and T(fexsitu) relations are followed by both FRs and SRs in each stellar mass bin, but with relative fractions varying with stellar mass. FRs and SRs again show a continuity of stellar halo properties across the two classes, with the SRs significantly overlapping with the FRs but crowding at the high fexsitu extreme. The systematic differences between median shape profiles of FRs and SRs with similar stellar mass and in-situ fractions observed in Fig. 11 are therefore due to the different radial distribution of in-situ versus ex-situ stars in the two families, which is probably at the root of the FR–SR bimodality. At large radii, where the local fexsitu fractions are higher, stellar halos display a more continuous sequence of properties.
Figure 14 shows the local q(fexsitu) and T(fexsitu) correlations for all the galaxies with M* ≥ 1010.6 M⊙, colored according to the total accreted mass fraction from major mergers and the fraction of in-situ stars produced since z = 1. As both ΔM*, major/M* and Δinsitu, z ≤ 1 correlate with stellar mass (Fig. 6), as well as with the total ex-situ fraction (Fig. 4), this results in gradients of these global properties with the local fexsitu fraction. These gradients indicate that galaxies reaching high fexsitu have accreted larger fractions of their mass from major mergers and have not recently produced many in-situ stars, implying that their recent merger history is gas-poor. Figure 14 shows that the most triaxial galaxies (i.e., those with T > 0.4−0.5) have a wide range of ΔM*, major/M* fractions, but they all had a recent dry merger history (Δinsitu, z ≤ 1 ≲ 0.3). On the other hand, galaxies with high fexsitu > 0.4 that have near-oblate intrinsic shapes accreted less mass from major mergers and have accreted only slightly more gas than their near-prolate counterparts. Finally, Fig. 14 reveals that the knee in the q(fexsitu) relation at fexsitu ∼ 0.7 is driven by galaxies with the highest accreted mass fractions from major mergers with the lowest Δinsitu, z ≤ 1.
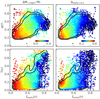 |
Fig. 14. Local relation between galaxy intrinsic shapes and the local fraction of accreted stars for galaxies with M* ≥ 1010.6 M⊙. The top panels show q(fexsitu), the bottom panels T(fexsitu). In the left panels, galaxies are color-coded according to the fraction of accreted mass from major mergers ΔM*, major/M*, in the right panels colors indicate the fraction of in-situ stars produced since z = 1, Δinsitu, z ≤ 1. The local ex-situ fraction parametrizes the different galaxy accretion histories: the break in q(fexsitu) is driven by recent dry major mergers in massive systems; the most triaxial galaxies are systems with the lowest fractions of recently accreted cold gas, while low T stellar halos are formed in more gas-rich systems. |
7. Stars and dark matter halo relation
In this part of the paper we investigate the relation between the rotation and structural properties of the stellar and the dark matter halos. Because the local rotational support and the intrinsic shape of the stellar halos are linked to the accretion history (parametrized in Figs. 10 and 13 by fexsitu) and because stars and dark matter are accreted jointly, we expect that accretion has a similar influence on the dark matter component.
7.1. Relation between dark matter and stellar halo parameters and local ex-situ fraction
The intrinsic shape of the dark matter halo is derived following the same iterative procedure used in Sect. 3.2 for the stellar particles. For both components we use shells with the same fixed semi-major axes lengths r and r + Δr, but we allow the direction of the principal axes to vary, as well as the axis ratios p and q. The rotational support of the stellar and the dark matter components is derived in spherical shells of radii r and r + Δr. In each radial bin, we use the stellar and the dark matter particles separately to calculate the V/σ(r) of the two components. In the same spherical shell we derive the local fraction of ex-situ stars fexsitu(r) from the ratio of the stellar mass densities within the shell ρexsitu(r)/ρstars(r).
Figure 15 shows the relation between rotational support V/σ and axis ratios q and p of the stellar and the dark matter components. Each galaxy is divided into 12 radial bins (ellipsoidal or spherical, as described above) in the range r ∈ [1Re, 8Re], and therefore each galaxy is represented by approximately 12 data points1 in Fig. 15.
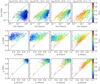 |
Fig. 15. Local stellar vs. dark matter rotational support (V/σ, top panels) and intrinsic shape (axis ratios q and p, respectively in the middle and bottom panels) for all galaxies in 12 radial shells with r ∈ [1Re − 8Re]. Local measurements are color coded according to the local ex-situ fraction fexsitu. Galaxies are divided into stellar mass bins as labeled at the top of the respective columns. The dashed diagonal lines show the relations y = x, y = x/10, and y = x/100. Rotation and shapes of stars and dark matter halo become similar with increasing fexsitu. |
We see that in general the stellar component rotates faster than the dark matter and is more flattened (i.e., q(stars) < q(DM)). In particular, while the stars have an axis ratio q(stars) that can vary from 0.2 to 0.8, the dark matter flattening is contained in a much narrower range of values (0.6 ≲ q(DM) ≲ 0.9, stretching to lower values only in very few cases). In high-mass galaxies (M* > 1010.9 M⊙), the dark matter is more elongated than the stars (p(stars) > p(DM)) but at lower masses and at low fexsitu it is as oblate as the stellar component (p(DM) ∼ p(stars) > 0.8). The stars show progressively lower rotational support with increasing stellar mass and move from the lower right corner of the diagrams, around the y = x/10 line, towards the 1:1 line. Their intrinsic shapes show a similar behavior, becoming rounder (i.e., with higher q), while both stars and dark matter become more triaxial (i.e., with lower p).
Each data point in Fig. 15 is color coded by the local ex-situ fraction fexsitu derived at the same radius r at which the rotational support and the intrinsic shapes are measured. The colors show that the stellar and the dark matter components tend to have a similar amount of rotational support and similar intrinsic shapes where the fraction of the ex-situ stars is high (fexsitu ≳ 0.5).
7.2. Principal axes and direction of rotation of dark matter and stellar components
The similarity between stellar and dark matter components at growing fexsitu also extends to their directions of rotation and directions of the principal axes. Misalignments between the major axes and between the minor axes Δϑj of the stellar and dark matter components are derived from the dot product of the eigenvectors  of their inertia tensor at each radius r:
 (13)
(13)
where j ∈ [major axis, minor axis].
The misalignment angle between the direction of rotation of the stars and of the dark matter, Δθrot(r), is measured in each spherical shell of radius r from the direction of the velocity vectors including their sign, meaning that Δθrot ∈ [0, 180] degrees. For each galaxy, we derive Δθj(r), Δθrot(r), and fexsitu(r) in radial bins of radius r. Figure 16 shows the distributions of Δθj(r) and Δθrot in bins of fexsitu: the left panels show the distributions from shells with radii 1Re ≤ r ≤ 2Re, while the right panels those from shells with radii 4Re ≤ r ≤ 8Re2.
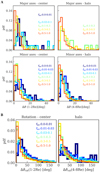 |
Fig. 16. A: distribution of misalignments of the principal axes of the stellar and dark matter components for different local ex-situ fractions fexsitu as shown in the legend. Top panels: misalignments of major axes for the nonoblate systems. Bottom panels: misalignments of minor axes for the nonprolate systems. B: distribution of misalignments in the direction of rotation of the stellar and dark matter components for different local ex-situ fractions fexsitu. In each panel, we distinguish between central regions (1–2Re) and outskirts (4–8Re) and we show only distributions containing at least 20 galaxies. Stellar and dark matter components are increasingly aligned with increasing fexsitu. |
Stellar and dark matter halo components generally have well-aligned principal axes, within ∼20 deg, both in the centers and in the outskirts. Their alignment improves with higher ex-situ stellar contribution in both regions. Together, Figs. 15 and 16 reveal that wherever the local fraction of ex-situ stars is large enough (fexsitu ≳ 50%), stellar and dark matter components tend to have similar intrinsic shapes and better aligned principal axes. The right panels in Fig. 16 show that also the directions of rotation of the stellar and dark matter components tend to better align for high fexsitu. Therefore, with growing fexsitu, the stellar and dark matter halo acquire a similar degree of rotational support (Fig. 15).
7.3. Mergers and coupling between stellar and dark matter components
We now explore the dependence of the coupling between the stellar and dark matter components on the merger history. We look first to the major mergers. Major mergers are known to efficiently mix together stellar and dark matter particles through violent relaxation (e.g., Hilz et al. 2012). Figure 17A shows again the local relation between intrinsic shapes and rotational support of the dark matter and stellar components. All galaxies, each represented by approximately 12 data points as in Fig. 15, are now color-coded according to the total fraction of stellar mass from major mergers ΔM*, major/M*. From Fig. 17A, it is clear that in galaxies with higher ΔM*, major/M* stars and dark matter have more similar structure. In particular, if we isolate the galaxies with the highest ΔM*, major/M* fractions, we see that those with the lowest fraction of new in-situ stars Δinsitu, z ≤ 1 are closest to the 1:1 line. As Δinsitu, z ≤ 1, ΔM*, major/M*, and zlast tightly depend on stellar mass (Fig. 6), the galaxies with high ΔM*, major/M* and low Δinsitu, z ≤ 1 are massive recent dry major merger remnants. The stars of low-mass galaxies with low ex-situ fractions (see the leftmost panels in Fig. 15) are not coupled with the dark matter component. Most of these systems are in-situ dominated and their accreted mass is contributed mainly by mini mergers (Fig. 5), which are not massive enough to influence the dark matter halo. However, minor mergers can play a role in producing the stars/dark matter coupling. Figure 17B isolates galaxies within a narrow range of ΔM*, major/M* ∈ [0.1, 0.2]. This selection includes higher mass systems but, at the same time, limits the contribution from major mergers. Figure 17B shows a correlation with the fraction of mass from minor mergers ΔM*, minor/M*. The most coupled galaxies are, on average, those with the largest ΔM*, minor/M* fractions and those with lowest recent in-situ star formation. On the other hand, we find that the position of this sample of galaxies relative to the 1:1 line does not correlate with the fraction of mass accreted from mini mergers ΔM*, mini/M*, or with that from major mergers within the interval 0.1 ≤ ΔM*, major/M* ≤ 0.2. A coupling between star and dark matter from minor mergers might originate from the simultaneous stripping of stellar and dark matter particles, which are added coherently to the host.
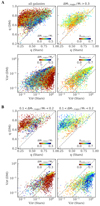 |
Fig. 17. Coupling between stellar and dark matter components from major and minor mergers. A: major mergers. The left panels show all the TNG ETGs, color coded by their fraction of stellar mass accreted by major mergers. On the right we consider only galaxies with at least 30% of their stellar mass accreted from major mergers and color code them according to the fraction of recently produced in-situ stars Δinsitu, z ≤ 1. Major mergers cause the coupling between stellar and dark matter components, especially in galaxies that have not recently accreted cold gas. B: minor mergers. Here we consider galaxies with stellar mass fraction accreted from major mergers in the narrow range 0.1 < ΔM*, major/M* < 0.2. In the left panels, galaxies are color coded by the fraction of stellar mass accreted from minor mergers ΔM*, minor/M* and on the right by the fraction of recently produced in-situ stars Δinsitu, z ≤ 1. Dry minor mergers also help to set up the similarity between stellar and dark matter halo structure. |
8. Early-type galaxies with cores made of stars from a high-redshift compact progenitor
Massive ETGs are thought to form early, at z > 2, beginning with intense bursts of star formation producing compact, massive (M∗ ≳ 1011 M⊙), disk-like galaxies, which quickly evolve into passive red galaxies (Daddi et al. 2005; Buitrago et al. 2008; van Dokkum et al. 2008; Damjanov et al. 2009, as also found in cosmological simulations, e.g., Wellons et al. 2015 using Illustris). The evolution of these objects into present-day ETGs is dominated by a strong growth in size driven by mergers and renewed star formation (e.g., Hernquist et al. 1993; Trujillo et al. 2006; Naab et al. 2009; van Dokkum et al. 2010; van der Wel et al. 2014; Furlong et al. 2017).
A fraction of these compact red early galaxies formed at high z may survive intact to present times as relic galaxies (Buitrago et al. 2018; Scognamiglio et al. 2020), but these are extremely rare objects and, to date, only a handful have been spectroscopically confirmed (Trujillo et al. 2014; Ferré-Mateu et al. 2017; Spiniello et al. 2021). However, the compact red progenitor galaxies are also expected to be found in the cores of present-day massive ETGs (e.g., Hopkins et al. 2009; Bezanson et al. 2009). The study of such systems at z = 0 is crucial for understanding the properties of the primordial in-situ component of ETGs, giving insights into the conditions for the formation of these objects and the mechanisms that regulated star formation at high z.
Simulations such as IllustrisTNG can provide information about which present-day ETGs are likely to contain cores dominated by stars from a compact progenitor (CP) galaxy and how these could be disentangled from the accreted component. In Sect. 4.1, we show that ex-situ stars can be distributed very differently in ETGs according to their merger history and that the most massive galaxies in our sample are dominated by ex-situ stars up to their very central regions (Fig. 3). In this section, we identify simulated ETGs that still contain a core made of CP stars and characterize their structural and accretion properties.
We first identified the galaxies whose progenitors are compact galaxies by studying the compactness of each galaxy as a function of time. The compactness can be quantified through the observationally motivated parameter (e.g., Barro et al. 2013),
 (14)
(14)
where re is the spherical stellar half-mass radius. For each galaxy, we tracked Σ1.5 back in redshift along the main progenitor branch of its merger tree. Following Wellons et al. (2016), we consider any galaxy exceeding the threshold
 (15)
(15)
as compact.
As shown by the mass functions in the central panel of Fig. 18, not all ETGs in our TNG sample descend from a CP; that is, only a fraction of the galaxies overcome the threshold in Eq. (15) at some point in their history. The fraction of ETGs with a CP is a strong function of stellar mass: in the range 1010.5 M⊙ ≤ M* ≤ 1011 M⊙ only 18% of the ETGs were compact in the past, while at M* > 1011.5 M⊙ this fraction rises to 80%. We find that the compact phase of a galaxy can occur at different epochs, in the range 1 ≲ z ≲ 4. Wellons et al. (2016) found very similar results using the original Illustris simulation. In particular, they observed a trend between compactness of the progenitor, present-day stellar mass, and galaxy formation time. This correlation is still present for the TNG100 ETGs and can to some extent explain the strong mass dependence of the fraction of ETGs with CPs: low-mass galaxies tend to form later, when the universe is less dense and less gas-rich, and the conditions are less favorable to the formation of compact objects.
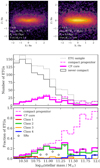 |
Fig. 18. Top: two examples of high-redshift CPs. in TNG100, progenitors of a FR (left) and of a SR (right). Both CPs are shown edge-on and have rather disky shapes. Physical parameters are reported in the figure. Center: mass functions of the entire sample of TNG ETGs (gray dashed), of the ETGs descending from a compact progenitor (magenta dashed), and of the ETGs with “surviving compact progenitor cores” (CP-cores, magenta solid line). The distribution of galaxies whose main progenitors were never compact is also shown (gray solid line). Bottom: fraction of galaxies, in mass bins, with compact progenitors, with surviving CP-cores, and with surviving CP-cores for SRs only and split by accretion class. The fraction of galaxies with CPs is a strong function of stellar mass but the fraction of objects with surviving CP-cores is nearly constant at ∼20% at M* ≳ 1010.7 M⊙, and decreases at lower masses. |
Once the sample of ETGs with a CP is identified, we use the unique indices for each stellar particle to determine the mass fraction of compact progenitor stars in present-day ETGs, within a radius of 2 kpc from the center. We refer to galaxies with central CP mass fraction higher than 50% as ETGs with “surviving compact progenitor core” or CP-core ETGs. Figure 18 shows the stellar mass distribution of these objects. We find that the fraction of CP-core ETGs grows with stellar mass in the range 10.3 ≤ log10M*/M⊙ ≲ 10.7, together with the fraction of ETGs with CPs. At higher masses, while the latter continues to grow, the fraction of surviving CP-cores remains constant at ∼20% almost independent of stellar mass. This indicates that at low masses, whenever a galaxy descends from a CP, the primordial in-situ population typically survives in its central regions. At stellar masses above 1010.7 M⊙, even though the fraction of CPs increases with mass, the chances of CP-core survival decrease, as the CP-cores are more likely destroyed by major merger events (see Fig. 6). This is also shown by the distribution of CP-cores divided by accretion class in Fig. 18: CP-core ETGs belong almost exclusively to class 2 and include both FRs and SRs3.
Figure 19 compares the properties of the CP-core ETGs to those of the whole sample of TNG100 ETGs. While the total in-situ mass fractions and the mean accreted gas fractions (not shown here for brevity) are similar among galaxies of similar mass, the fraction of recently formed in-situ stars is systematically lower in CP-core ETGs, especially at M* < 1011 M⊙. In other words, the recent accretion of gas and subsequent formation of new in-situ stars contributes to reducing the central mass fraction of primordial CP stars. Similarly mild differences are also found in the recent accretion history of CP-cores: even though their accreted stellar mass fractions from major mergers are comparable to ETGs with similar mass (not shown here), these accretion events happened at earlier times (Fig. 19). Therefore, CP-core ETGs formed their in-situ population earlier than normal ETGs and their subsequent evolution is relatively quieter in terms of recent gas accretion, star formation, and accretion from late mergers. The lower rate of recent gas accretion in CP-core galaxies is related to lower rotational support in their central regions as well as somewhat more spherical shapes (bottom panels of Fig. 19).
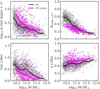 |
Fig. 19. Sample of galaxies with surviving CP cores (magenta) compared to the whole sample of ETGs (gray). Panels show redshift of the last major merger, fraction of recently formed in-situ stars Δinsitu, z ≤ 1, rotational support V/σ, and minor-to-major axis ratio q at 1Re as functions of stellar mass. Solid lines show the median profiles and shaded regions enclose the quartiles of the distributions. Galaxies with CP-cores had fewer recent major mergers, formed fewer in-situ stars after redshift z = 1, and are characterized by lower rotational support and rounder shapes than all ETGs of similar mass. |
We note that many of the early progenitors of the CP-core ETGs have rather disky shapes and are dominated by rotational support; the two examples shown in the top panels of Fig. 18 have V/σ(1Re) > 1. On the other hand, in Fig. 19 almost none of the CP-core ETGs overcomes V/σ(1Re) > 1. This is in agreement with kinematic results from relic galaxies (e.g., Ferré-Mateu et al. 2017), which are all characterized by high rotation velocity (∼200−300 km s−1), while the CP-core galaxy NGC3311 has negligible rotation (Barbosa et al. 2018, 2020). The investigation of the merger histories of these systems and of how mergers modify the dynamical properties of the CP-cores will be the subject of a future study.
Based on the results from the TNG100 simulation, selecting slowly rotating, rounder galaxies in observational studies can increase the probability of finding a CP-core. For example, a limit on V/σ(1Re) < 0.1 or, alternatively, a limit on q(1Re) > 0.6, doubles the fraction of CP-cores in a sample with M* > 1010.7 M⊙.
9. Discussion
9.1. Rotational support and intrinsic shape versus accretion history
Sections 5 and 6 show how the rotational support and intrinsic shape profiles of the ETGs in TNG100 depend on their accretion history. In the selected sample of ETGs, we find that low-mass in-situ-dominated galaxies with negligible accreted fractions are characterized by peaked and outwardly decreasing V*/σ*(R) profiles (Fig. 8), near-oblate stellar shapes, and increasing axis ratio q(r) profiles at large radii that follow the decrease in rotation (e.g., Fig. 12B). In galaxies with larger masses, the in-situ components have similarly shaped rotation profiles, but the galaxy structure is altered by the accreted stars and gas from merger events in a way that is strongly dependent on stellar mass. In this work we mostly focus on the effect of different mass-ratio mergers and the influence of the recently accreted cold gas (parametrized by Δinsitu, z ≤ 1). We find that the merger history of TNG100 ETGs is dominated by major and mini mergers (see Sect. 4.2). Major mergers, especially the gas-poor ones, are effective in erasing the peak of rotation and flattening the V*/σ*(R) profiles (Fig. 9A), while at the same time they lead to more spherical shapes and increased triaxiality (Fig. 12A). Minor mergers are less effective than major mergers but they can also contribute to more spherical-triaxial stellar halo shapes and suppressed rotation. In low-mass galaxies without major and minor mergers, mini mergers have the somewhat unexpected effect of increasing the median galaxy rotational support at large radii (Fig. 9B) and at the same time decreasing their median axis ratio q while keeping the shapes near-oblate (Fig. 12B), as if they contributed to a size increase of the host disk. This effect would only be possible if the accretion of these low-mass satellites occurred in the plane of the in-situ rotating disk-like component on rather circular orbits (Amorisco 2017). Karademir et al. (2019) found that mini mergers can indeed increase the size of the galaxy disk provided that the impact occurs in the disk plane. Whether or not mini mergers are generally accreted from preferential directions is an interesting subject for a future study.
The dependence of galaxy structure and rotational support on the merger history of galaxies generates a correlation between the V*/σ*(R), q(r), and T(r) profile shapes and the total stellar mass, and therefore fraction of in-situ (or accreted) stars (Figs. 8 and 11), and between the local rotational support and intrinsic shapes and the local ex-situ mass fraction fexsitu (Figs. 10 and 13). With increasing contribution of ex-situ stars, the stellar halo V*/σ* decreases and shapes become rounder and more triaxial. Low-mass, in-situ-dominated galaxies show poor correlations between rotational support and shapes and the local fexsitu, as they are completely determined by the in-situ star.
9.2. Kinematic transition radius
Previous studies proposed kinematic transitions as signatures of the two-phase formation scenario, with the drop in rotational support marking the transition from in-situ- to ex-situ-dominated regions (e.g., Foster et al. 2016; Pulsoni et al. 2018). In Sect. 5.1 we demonstrate that, for the TNG ETGs, the decrease in rotation is mainly driven by the in-situ stars. In particular, we observe that kinematic transitions typically occur in the in-situ-dominated parts of galaxies, where the fraction of accreted stars is irrelevant everywhere (fexsitu(R) < 0.1). This why a kinematic transition radius RT, kin defined by either the drop in rotation (Pulsoni et al. 2018) or the location of the peak in λ parameter (Schulze et al. 2020) does not generally trace a particular value of fexsitu in the TNG galaxies. This means that the kinematic transition radius in TNG galaxies does not generally correspond to the transition radius RT, exsitu between the in-situ- and the ex-situ-dominated regions where fexsitu = 0.5.
This is shown in Fig. 20. We considered FRs in accretion class 2 for which we can define a transition radius RT, exsitu from in-situ-dominated centers to ex-situ-dominated outskirts. This is similar, although not identical, to the definition of RT, exsitu in Rodriguez-Gomez et al. (2016) for the original Illustris simulation. The median RT, exsitu as a function of stellar mass is shown in Fig. 20 with a black curve (see also Table A.6). The other curves represent the median kinematic transition radii RT, kin for the same group of galaxies derived using different definitions:
-
by taking the position of the maximum of V*(R) as defined in Eq. (9) (red curve);
-
by considering the mean radius between the position of the peak in the rotational velocity profile Vrot(R) and the radius at which Vrot(R) decreases by 50 km s−1 (as in Pulsoni et al. 2018, Vrot(R) derived as in Paper I, green curve); and
-
by taking the peak in the differential λ(R) profile (as in Schulze et al. 2020, λ(R) derived as in Paper I, blue curve).
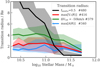 |
Fig. 20. Median TNG100 kinematic transition radii (red, green, and blue solid curves) as a function of galaxy stellar mass, compared with the median transition radius RT, exsitu between in-situ- and ex-situ-dominated regions (black line). All the curves are obtained from FR galaxies of class 2 (see Fig. 3) with well-defined Rexsitu between in-situ-dominated centers and ex-situ-dominated outskirts. The number of galaxies used to produce each curve is reported in the legend. |
Figure 20 shows that the kinematic transition radius in TNG is not related to the transition radius between in-situ- and ex-situ-dominated regions. While the median RT, exsitu(M*) decreases quickly with increasing stellar mass, the median RT, kin shows a weaker dependence on M*. Lower mass systems have kinematic transition radii that are systematically smaller than RT, exsitu. For these galaxies the kinematic transition occurs in in-situ-dominated regions (at fexsitu < 0.2 for M* < 1010.7 M⊙), while the ex-situ transition radius occurs at much larger radii. As fexsitu(R) depends on stellar mass (Fig. 5), in more massive systems the contribution of ex-situ stars to the rotational support is larger and sufficient to determine the anti-correlation V*/σ*(fexsitu). In these cases the kinematic transition accidentally occurs at radii closer to RT, exsitu, because also for these galaxies the peaked and outwardly decreasing rotation profile shape is mainly determined by the rotation profile of in-situ stars (Fig. 8). This is demonstrated by the galaxies at the high-mass end of Fig. 20 whose kinematic transition radius is much larger than RT, exsitu, showing again that the kinematic transition radius does not trace RT, exsitu in the IllustrisTNG ETGs.
Schulze et al. (2020) recently showed similar kinematic results using the Magneticum Pathfinder simulations but drew different conclusions. In their work, they selected 492 galaxies with stellar masses larger than 1010.3 M⊙, although their cuts on the number of particles at R > 3Re excluded the majority of the galaxies with M* < 1010.6 M⊙. A subset of this sample (19%) have peaked and outwardly decreasing differential λ(R) profiles: this is made of galaxies that, on average, had the smallest fraction of accreted stars and did not undergo major mergers. Schulze et al. (2020) argue that for these galaxies the accretion histories, dominated by mini and minor mergers, lead to the characteristic profile shape. This is motivated by the fact that the disruption of low-mass satellites merging from random directions would enhance the dispersion in the halo without affecting the central embedded disk and create the decreasing λ(R) profiles. On the other hand, their Fig. 11 reveals that the fraction of galaxies with this characteristic λ(R) profile shape was much higher at z = 2, when the galaxies are mostly made of in-situ stars. At lower redshifts, when galaxies progressively increase their stellar mass through both in-situ star formation and accretion, the fraction of peaked and outwardly decreasing λ(R) profiles drops in favor of other profile shapes. This suggests that the peaked and outwardly decreasing λ(R) profile is already set at high z by the in-situ stars and is not determined by the subsequent minor and mini mergers. The example galaxy shown in their Figs. 12 and 13 seems to confirm this conclusion.
Figure 15 in Schulze et al. (2020) shows the relation between RT, kin and RT, exsitu for a fraction of their sample of galaxies with such peaked and outwardly decreasing λ(R) profiles. For these galaxies, the figure shows a trend for galaxies with higher ΔM*, major/M* to have kinematic transition radii larger than RT, exsitu, and for galaxies with lower ΔM*, major/M* to have RT, kin ∼ RT, exsitu. Even though it is not straightforward without further data to estimate the stellar masses of the systems shown, if we assume that the Magneticum galaxies have a similar merger history to that of the TNG100 ETGs, the galaxies with higher ΔM*, major/M* are also the more massive systems. Therefore, the apparent dependence on merger mass ratio in their Fig. 15 together with the selection against low-mass systems may actually be consistent with a stellar mass dependence similar to that observed for the TNG ETGs in Fig. 20, in which the kinematic transition radius traces RT, exsitu only for a special mass range, but not generally.
9.3. Stars and dark matter halo relation
In Sect. 7 we investigate the relation between the stellar and the dark matter components and show that the two are coupled where the fraction of accreted stars is highest; at fexsitu ≳ 0.5 the stars have similar intrinsic shape and rotational support to the underlying dark matter component. Such high local ex-situ fractions occur in the most massive systems (M* > 1011.2 M⊙) but also at sufficiently large radii in intermediate-mass systems (Fig. 5) such as the class 2 galaxies which dominate at M* > 1010.6 M⊙ (Fig. 4).
The relation between the intrinsic shapes of the galaxies and their dark matter halos, as well as the alignment of their spins and of their principal axes, has been widely investigated in the literature with different sets of simulations. The co-evolution of galaxies and inner dark matter halos (r ∼ 0.1r200) correlates their shapes and angular momenta in the central regions (e.g., Kazantzidis et al. 2004; Bryan et al. 2013; Chua et al. 2019), while centers and outer dark matter halos are found to be more misaligned (e.g., Bailin et al. 2005; Deason et al. 2011; Tenneti et al. 2015).
In this work we show that if we follow the variations of galaxy properties with radius and analyze the relation between stellar and dark matter components locally, we find that the two components are also correlated at large radii (see also Wu et al. 2014). We find that gas-poor accretion, quantified by fexsitu, efficiently couples the stars to the dark matter component. This might be due to either the efficient mixing of stars and dark matter in major mergers or to the coherent accretion of baryonic and dark matter at large radii in the case of minor mergers. The accreted stellar and dark matter components therefore gather on roughly similar orbits, meaning that the rotational support and shapes of both components would be similar. Thus, where the accreted component dominates the mass, they would follow each other in the overall dynamics. In-situ-dominated regions instead rotate faster than the dark matter halo, have more flattened shapes, and show larger misalignments with the dark matter component at the same radius.
Our results are in line with those of previous studies. For example, Tenneti et al. (2015), using the MassiveBlack-II cosmological hydrodynamic simulation, observed a tendency for galaxies with high triaxiality parameter (those with highest fexsitu in TNG; see Fig. 13) to be more aligned with the dark matter halo, while oblate galaxies have higher misalignments. Zjupa & Springel (2017), using the original Illustris simulation, found that the stellar and dark matter total angular momenta are progressively better aligned at higher masses, where the mostly old stellar populations interact gravitationally with the dark matter and not hydrodynamically with the gas. In lower mass halos, galaxies are typically younger and their stellar angular momentum aligns well with the gas, which, as opposed to the dark matter, is strongly influenced by feedback processes. Ganeshaiah Veena et al. (2019) found that the galaxies in the EAGLE simulation with spin oriented perpendicularly relative to their filament, which are galaxies that are more massive and of earlier type, are the best aligned with their host halo, while galaxies with parallel spin show poor alignment. Lastly, for the most massive galaxies, which are those with the highest global ex-situ fractions, the slope of the spherically averaged radial mass profiles of the stellar halos has been found to tend towards that of the underlying dark matter (slope of about −3; Pillepich et al. 2014, 2018a).
The local coupling of stellar and dark matter halos at high local ex-situ fractions (fexsitu > 0.5) implies that in sufficiently massive galaxies, or at sufficiently large radii, we can approximate the intrinsic shapes and rotational support of the dark matter component with that measured from deep photometry of stellar halos and from kinematic tracers such as planetary nebulae or globular clusters.
10. Summary
This paper is a follow-up study of Pulsoni et al. (2020), where we characterized the stellar halo kinematic properties in a sample of early-type galaxies (ETGs) selected from the IllustrisTNG cosmological simulations and connected them to variations in their intrinsic shapes. In the present paper we present a study of the dependence of the kinematics and structure of the simulated galaxies on their accretion history, using the same sample of ETGs from TNG100. We also extended the investigation to the dark matter halos and studied how their rotation and shape properties are related with those of the stellar halos.
In Sect. 4 we characterize the accretion history of the selected sample of ETGs by considering the total fraction of the accreted mass, the mass fraction contributed by different mass ratio mergers, the fraction of accreted cold gas, and the recent in-situ star formation. The tight correlation between stellar mass and these accretion parameters implies that the stellar mass of a galaxy is a good indicator of its accretion history. The different merger histories of the TNG ETGs lead to different radial distribution of accreted stars within the galaxies so that galaxies can be divided into four accretion classes, each dominating in different intervals of stellar mass and total in-situ mass fraction (Fig. 4): low-mass ETGs (up to M* ∼ 1010.6 M⊙) are in-situ dominated at all radii; intermediate ETGs have in-situ-dominated central regions and ex-situ-dominated outskirts, with a smaller group in which in-situ and ex-situ components interchangeably dominate at small and intermediate radii; and high-mass galaxies (M* > 1011.2 M⊙) are mostly ex-situ dominated from the center to the halo. Fast and slow rotators follow similar trends with stellar mass but, at fixed mass, SRs on average contain more accreted stars, they have accreted less gas, and they have undergone more recent major mergers (Figs. 2 and 7).
In Sect. 5 we characterize the shape of the V*/σ*(R) profiles as a function of stellar mass and total in-situ fraction (Fig. 8). For both FRs and SRs, the total median V*/σ*(R) profiles in stellar mass bins can be approximated by the weighted sum of the rotational profiles of the in-situ and ex-situ components. We show that the Vinsitu/σ*(R) profiles of the in-situ stars typically have a peaked and outwardly decreasing" form, with peaks in rotation decreasing at higher stellar mass and accreted fraction because of the effects of mergers; the ex-situ stars have median Vexsitu/σ*(R) profiles that are largely constant with radius and independent of stellar mass (Fig. 8); and the median shapes of the overall V*/σ*(R) profiles are essentially determined by the stellar mass and total in-situ fraction (or equivalently, total accreted mass fraction), whereas we found no residual correlations with other accretion parameters.
Galaxy intrinsic shapes are also found to vary as a function of the in-situ fraction and stellar mass (Sect. 6), such that low-mass galaxies with negligible fractions of accreted stars are consistent with near-oblate shapes and increasing axial ratio q(r) in the halo, while galaxies with higher stellar mass and accreted fractions are less flattened and more triaxial (Fig. 11).
In Sects. 5.2 and 6.2 we show that mergers and recent gas accretion, whose importance strongly depends on stellar mass, change the galaxy structure by modifying both rotational support and intrinsic shape: major mergers tend to erase the peak in rotation and flatten the V*/σ*(R) profiles (Fig. 9A) while at the same time they increase the triaxiality and make the halo rounder; and the recent accretion of cold gas acts in the opposite direction by preserving or building up the central rotation and making shapes closer to oblate (Fig. 12A). Minor mergers are less effective than major mergers but they can also contribute to more spherical-triaxial stellar halo shapes and suppressed rotation. We find that in low-mass galaxies with no major and minor mergers, mini mergers tend to increase the size of the host disks by building up an extended, flattened, rotating component (Figs. 9B and 12B).
Mergers and recent gas accretion also play an important role in the evolution of the stellar population mixture within galaxies. In Sect. 8 we show that in about 20% of high-mass ETGs the central regions are dominated by stars from a compact high-redshift progenitor galaxy. These systems had a quieter recent evolution with respect to galaxies of similar mass in terms of late mergers and recent star formation. In particular, the lower rate of recent cold gas accretion in these galaxies is related to a higher probability of observing them among ETGs with slow rotation and rounder shapes.
As the peaked and outwardly decreasing V*/σ*(R) profiles in the IllustrisTNG galaxies are characteristic of the low-mass (M* < 1010.6 M⊙) class 1 galaxies with little ex-situ stars and, more generally, of the in-situ component, a kinematic transition radius defined either by the rotation peak or the drop in rotation does not trace a particular fexsitu value (Fig. 20). Only in sufficiently massive systems does the kinematic transition radius become (accidentally) similar to the transition radius between in-situ-dominated and ex-situ-dominated regions (Rexsitu). Therefore, our results cast some doubt on the use of the kinematic transition radius as a tracer of Rexsitu.
However, if we exclude the low-mass galaxies with M* < 1010.6 M⊙) in which radial variations of rotation and flattening are driven by the in-situ stars alone, we find clear relations between the stellar halo structural parameters and the local fraction of ex-situ stars fexsitu. The median stellar halo rotational support decreases strongly with fexsitu, with an average scatter of 0.16 in fexsitu at constant V*/σ*(R) (Fig. 10). Low fexsitu is consistent with near-oblate shapes with low q. At higher fexsitu the stellar halo triaxiality increases, while the q(fexsitu) reaches a maximum of q ∼ 0.6 at fexsitu ∼ 0.7, beyond which it decreases again (Fig. 13). SRs populate the same correlations in the stellar halo parameter distribution as the FRs, but at the high fexsitu end. At large radii, where the local ex-situ fractions are high the two classes show a continuous sequence of stellar halo properties with a significant overlap.
If these correlations between the stellar halo rotational support, intrinsic shapes, and local fexsitu found here also hold for real massive galaxies (with M* > 1010.6), the measurement of these observationally accessible quantities could provide an estimate of the local ex-situ contribution. The sensitivity of these correlations to the adopted galaxy formation model in the simulations, which could for example influence the distribution of fexsitu with radius (e.g., see Sect. 4.1), should be tested with different sets of cosmological simulations.
In Sect. 7 we show that stellar and dark matter components are dynamically coupled in regions of high ex-situ fraction: For local ex-situ fractions fexsitu ≳ 0.5, stellar and dark matter halos have similar intrinsic shapes and well-aligned principal axes, a similar amount of rotational support, and a similar direction of rotation (Figs. 15 and 16). Galaxies with higher accreted fractions from (dry) major mergers are the systems with the closest coupling between stellar and dark matter components (Fig. 17A), but we find that minor mergers can also contribute (Fig. 17B). The coupling of stars and dark matter may be due to the simultaneous mixing of stars and dark matter in major mergers (Fig. 17A), or also to the coherent accretion of stars and dark matter on similar orbits in mergers with smaller mass ratios (Fig. 17B).
11. Conclusions
Finally, we summarize our main conclusions from these results:
(1) The stellar mass of an ETG in the TNG100 cosmological simulations is tightly correlated with its accretion history and with the distribution of the accreted stars. Low-mass galaxies are dominated by the in-situ component, intermediate-mass systems typically have in-situ-dominated cores and ex-situ-dominated halos, and the highest mass systems are everywhere dominated by accreted, ex-situ stars.
(2) The in-situ stars dominating in low-mass ETGs typically have characteristic peaked and outwardly decreasing rotation profiles and near-oblate shapes with axial ratio q(r) increasing in the halo. At higher stellar masses and accreted mass fractions, the rotation peak decreases but is still dominated by the in-situ stars, and the galaxy halos become more triaxial. A kinematic transition radius defined by the position of either the peak or the drop in rotation therefore does not trace the transition between in-situ-dominated and ex-situ-dominated regions in a galaxy.
(3) Major mergers (with mass ratio μ > 1:4) dominate the accreted mass fraction in TNG100 ETGs over mini mergers (μ < 1:10) and finally minor mergers (1:4 > μ > 1:10). Dry major mergers tend to decrease the peak in rotation and flatten the V*/σ*(R) profiles, while at the same time they increase the triaxiality T and make the halo rounder. Therefore, an approximate estimate of the local ex-situ mass fraction fexsitu(R) in massive ETGs can be obtained from the local rotational support V*/σ*(R) and intrinsic shape parameters q(r) and T(r).
(4) Fast rotators and slow rotators populate the same overall correlations between stellar halo rotational support, intrinsic shape, and local ex-situ fraction fexsitu, but SRs are concentrated at the high-fexsitu end. Low-mass ETGs are mostly FRs with near-oblate shapes while only a few are SRs. At higher masses, FRs acquire accretion-dominated halos with slow rotation and triaxial shapes, while at the highest stellar masses most ETGs are SRs.
(5) Early-type galaxies with a high-redshift compact progenitor galaxy surviving in their cores are systems which had a quieter recent evolution compared to other galaxies of similar mass in terms of mergers and recent star formation. This prevented the central regions from being diluted both by accreted and newly formed in-situ stars, leading to lower average rotation.
(6) In regions where accreted stars dominate (i.e., where the local fexsitu > 0.5), stellar and dark matter halos have similar intrinsic shapes and rotational support, and similar principal and rotation axes. Therefore, in sufficiently massive ETGs or at sufficiently large radii the local intrinsic shape and rotational support of the dark matter halos can be approximated with those obtained from photometry and extended kinematics of their stellar halos.
These results show that the properties of ETG stellar halos are largely determined by the balance between the in-situ component and the stars accreted through mergers. This is driven strongly by stellar mass: in low-mass systems(M* < 1010.6 M⊙), the in-situ stars dominate out to very large radii. In massive ETGs, mergers and accretion shape the structure of stellar halos and dynamically couples them to the dark matter component.
As already discussed in Sect. 3.2, we can reliably measure intrinsic shapes out to 8Re for 96% of the selected ETGs.
In the distributions of the principal axes misalignments, we excluded Δθmajor(r) and Δθminor(r) measurements from ellipsoids with intrinsic shapes respectively close to oblate (p(stars) > 0.9 or p(dm) > 0.9, 77% of the ellipsoids) and to prolate (q/p(stars) > 0.9 or q/p(dm) > 0.9, 19% of the ellipsoids), for which the direction of the principal axes is more uncertain (see Sect. 3.2). Thus the distribution of Δθmajor(r) applies for the remaining triaxial to prolate shapes, while the Δθminor(r) for the triaxial to oblate shapes. The consequence is that, for example, the distribution of Δθmajor(r) for galaxies with low fexsitu is not well sampled, as most galaxies are near-oblate (see Fig. 13). Therefore we should assess misalignments by considering together the Δθmajor(r) and Δθminor(r) distributions.
We note the presence of a few class 4 galaxies among CP-core ETGs. For these galaxies, the central CP mass fraction is not larger than 65%, and already their CPs contain a large population of ex-situ stars, up to 73%.
Acknowledgments
We thank the anonymous referee for the helpful comments and valuable suggestions on this manuscript. C. P. is grateful to F. Hofmann for his support.
References
- Amorisco, N. C. 2017, MNRAS, 464, 2882 [NASA ADS] [CrossRef] [Google Scholar]
- Arnaboldi, M., Pulsoni, C., & Gerhard, O., PN. S Consortium 2017, in Planetary Nebulae: Multi-Wavelength Probes of Stellar and Galactic Evolution, eds. X. Liu, L. Stanghellini, & A. Karakas, IAU Symp., 323, 279 [Google Scholar]
- Arnold, J. A., Romanowsky, A. J., Brodie, J. P., et al. 2014, ApJ, 791, 80 [NASA ADS] [CrossRef] [Google Scholar]
- Bailin, J., Kawata, D., Gibson, B. K., et al. 2005, ApJ, 627, L17 [NASA ADS] [CrossRef] [Google Scholar]
- Barbosa, C. E., Arnaboldi, M., Coccato, L., et al. 2018, A&A, 609, A78 [NASA ADS] [CrossRef] [EDP Sciences] [Google Scholar]
- Barbosa, C. E., Spiniello, C., Arnaboldi, M., et al. 2020, A&A submitted [arXiv:2012.11609] [Google Scholar]
- Barro, G., Faber, S. M., Pérez-González, P. G., et al. 2013, ApJ, 765, 104 [NASA ADS] [CrossRef] [Google Scholar]
- Bender, R. 1987, Mitt. Astron. Ges. Hamburg, 70, 226 [Google Scholar]
- Bezanson, R., van Dokkum, P. G., Tal, T., et al. 2009, ApJ, 697, 1290 [NASA ADS] [CrossRef] [Google Scholar]
- Bryan, S. E., Kay, S. T., Duffy, A. R., et al. 2013, MNRAS, 429, 3316 [NASA ADS] [CrossRef] [Google Scholar]
- Buitrago, F., Trujillo, I., Conselice, C. J., et al. 2008, ApJ, 687, L61 [NASA ADS] [CrossRef] [Google Scholar]
- Buitrago, F., Trujillo, I., Curtis-Lake, E., et al. 2017, MNRAS, 466, 4888 [NASA ADS] [Google Scholar]
- Buitrago, F., Ferreras, I., Kelvin, L. S., et al. 2018, A&A, 619, A137 [CrossRef] [EDP Sciences] [Google Scholar]
- Bullock, J. S., & Johnston, K. V. 2005, ApJ, 635, 931 [Google Scholar]
- Cappellari, M. 2016, ARA&A, 54, 597 [NASA ADS] [CrossRef] [Google Scholar]
- Cappellari, M., & Copin, Y. 2003, MNRAS, 342, 345 [NASA ADS] [CrossRef] [Google Scholar]
- Cappellari, M., Emsellem, E., Krajnović, D., et al. 2011, MNRAS, 413, 813 [NASA ADS] [CrossRef] [Google Scholar]
- Catelan, P., Kamionkowski, M., & Blandford, R. D. 2001, MNRAS, 320, L7 [NASA ADS] [CrossRef] [Google Scholar]
- Chua, K. T. E., Pillepich, A., Vogelsberger, M., & Hernquist, L. 2019, MNRAS, 484, 476 [CrossRef] [Google Scholar]
- Coccato, L., Gerhard, O., Arnaboldi, M., et al. 2009, MNRAS, 394, 1249 [NASA ADS] [CrossRef] [Google Scholar]
- Coccato, L., Gerhard, O., & Arnaboldi, M. 2010, MNRAS, 407, L26 [NASA ADS] [Google Scholar]
- Conroy, C., Graves, G. J., & van Dokkum, P. G. 2014, ApJ, 780, 33 [NASA ADS] [CrossRef] [Google Scholar]
- Cooper, A. P., Cole, S., Frenk, C. S., et al. 2010, MNRAS, 406, 744 [Google Scholar]
- Cooper, A. P., D’Souza, R., Kauffmann, G., et al. 2013, MNRAS, 434, 3348 [Google Scholar]
- Daddi, E., Renzini, A., Pirzkal, N., et al. 2005, ApJ, 626, 680 [Google Scholar]
- Damjanov, I., McCarthy, P. J., Abraham, R. G., et al. 2009, ApJ, 695, 101 [NASA ADS] [CrossRef] [Google Scholar]
- Davison, T. A., Norris, M. A., Pfeffer, J. L., Davies, J. J., & Crain, R. A. 2020, MNRAS, 497, 81 [Google Scholar]
- Deason, A. J., McCarthy, I. G., Font, A. S., et al. 2011, MNRAS, 415, 2607 [NASA ADS] [CrossRef] [Google Scholar]
- D’Souza, R., Kauffman, G., Wang, J., & Vegetti, S. 2014, MNRAS, 443, 1433 [NASA ADS] [CrossRef] [Google Scholar]
- Emsellem, E., Cappellari, M., Krajnović, D., et al. 2011, MNRAS, 414, 888 [Google Scholar]
- Ferré-Mateu, A., Trujillo, I., Martín-Navarro, I., et al. 2017, MNRAS, 467, 1929 [NASA ADS] [Google Scholar]
- Foster, C., Pastorello, N., Roediger, J., et al. 2016, MNRAS, 457, 147 [NASA ADS] [CrossRef] [Google Scholar]
- Furlong, M., Bower, R. G., Crain, R. A., et al. 2017, MNRAS, 465, 722 [NASA ADS] [CrossRef] [Google Scholar]
- Ganeshaiah Veena, P., Cautun, M., Tempel, E., van de Weygaert, R., & Frenk, C. S. 2019, MNRAS, 487, 1607 [NASA ADS] [CrossRef] [Google Scholar]
- Genel, S., Vogelsberger, M., Springel, V., et al. 2014, MNRAS, 445, 175 [Google Scholar]
- Genel, S., Nelson, D., Pillepich, A., et al. 2018, MNRAS, 474, 3976 [NASA ADS] [CrossRef] [Google Scholar]
- Graham, M. T., Cappellari, M., Li, H., et al. 2018, MNRAS, 477, 4711 [Google Scholar]
- Hernquist, L., Spergel, D. N., & Heyl, J. S. 1993, ApJ, 416, 415 [NASA ADS] [CrossRef] [Google Scholar]
- Hilz, M., Naab, T., Ostriker, J. P., et al. 2012, MNRAS, 425, 3119 [NASA ADS] [CrossRef] [Google Scholar]
- Hopkins, P. F., Bundy, K., Murray, N., et al. 2009, MNRAS, 398, 898 [NASA ADS] [CrossRef] [Google Scholar]
- Huang, S., Ho, L. C., Peng, C. Y., Li, Z.-Y., & Barth, A. J. 2013, ApJ, 768, L28 [NASA ADS] [CrossRef] [Google Scholar]
- Karademir, G. S., Remus, R.-S., Burkert, A., et al. 2019, MNRAS, 487, 318 [NASA ADS] [CrossRef] [Google Scholar]
- Kazantzidis, S., Kravtsov, A. V., Zentner, A. R., et al. 2004, ApJ, 611, L73 [Google Scholar]
- Kormendy, J., Fisher, D. B., Cornell, M. E., & Bender, R. 2009, ApJS, 182, 216 [NASA ADS] [CrossRef] [Google Scholar]
- Lagos, C. d. P., Theuns, T., Stevens, A. R. H., et al. 2017, MNRAS, 464, 3850 [NASA ADS] [CrossRef] [Google Scholar]
- Lagos, C. d. P., Stevens, A. R. H., Bower, R. G., et al. 2018, MNRAS, 473, 4956 [NASA ADS] [CrossRef] [Google Scholar]
- Marinacci, F., Vogelsberger, M., Pakmor, R., et al. 2018, MNRAS, 480, 5113 [NASA ADS] [Google Scholar]
- Naab, T., & Ostriker, J. P. 2017, ARA&A, 55, 59 [Google Scholar]
- Naab, T., Johansson, P. H., & Ostriker, J. P. 2009, ApJ, 699, L178 [NASA ADS] [CrossRef] [Google Scholar]
- Naab, T., Oser, L., Emsellem, E., et al. 2014, MNRAS, 444, 3357 [NASA ADS] [CrossRef] [Google Scholar]
- Naiman, J. P., Pillepich, A., Springel, V., et al. 2018, MNRAS, 477, 1206 [CrossRef] [Google Scholar]
- Nelson, D., Pillepich, A., Springel, V., et al. 2018, MNRAS, 475, 624 [NASA ADS] [CrossRef] [Google Scholar]
- Nelson, D., Springel, V., Pillepich, A., et al. 2019, Comput. Astrophys. Cosmol., 6, 2 [Google Scholar]
- Oser, L., Ostriker, J. P., Naab, T., Johansson, P. H., & Burkert, A. 2010, ApJ, 725, 2312 [NASA ADS] [CrossRef] [Google Scholar]
- Pastorello, N., Forbes, D. A., Foster, C., et al. 2014, MNRAS, 442, 1003 [NASA ADS] [CrossRef] [Google Scholar]
- Peebles, P. 1980, in The Large-scale Structure of the Universe, (Princeton University Press), Princeton Ser. Phys. [Google Scholar]
- Peng, Y.-J., Lilly, S. J., Kovač, K., et al. 2010, ApJ, 721, 193 [NASA ADS] [CrossRef] [Google Scholar]
- Penoyre, Z., Moster, B. P., Sijacki, D., & Genel, S. 2017, MNRAS, 468, 3883 [NASA ADS] [CrossRef] [Google Scholar]
- Pillepich, A., Vogelsberger, M., Deason, A., et al. 2014, MNRAS, 444, 237 [NASA ADS] [CrossRef] [Google Scholar]
- Pillepich, A., Nelson, D., Hernquist, L., et al. 2018a, MNRAS, 475, 648 [NASA ADS] [CrossRef] [Google Scholar]
- Pillepich, A., Springel, V., Nelson, D., et al. 2018b, MNRAS, 473, 4077 [Google Scholar]
- Pulsoni, C., Gerhard, O., Arnaboldi, M., et al. 2018, A&A, 618, A94 [NASA ADS] [CrossRef] [EDP Sciences] [Google Scholar]
- Pulsoni, C., Gerhard, O., Arnaboldi, M., et al. 2020, A&A, 641, A60 [EDP Sciences] [Google Scholar]
- Rodriguez-Gomez, V., Pillepich, A., Sales, L. V., et al. 2016, MNRAS, 458, 2371 [NASA ADS] [CrossRef] [Google Scholar]
- Rodriguez-Gomez, V., Sales, L. V., Genel, S., et al. 2017, MNRAS, 467, 3083 [NASA ADS] [CrossRef] [Google Scholar]
- Rodriguez-Gomez, V., Snyder, G. F., Lotz, J. M., et al. 2019, MNRAS, 483, 4140 [NASA ADS] [CrossRef] [Google Scholar]
- Romanowsky, A. J., & Fall, S. M. 2012, ApJS, 203, 17 [Google Scholar]
- Schäfer, B. M. 2009, Int. J. Mod. Phys. D, 18, 173 [NASA ADS] [CrossRef] [Google Scholar]
- Schulze, F., Remus, R.-S., Dolag, K., et al. 2018, MNRAS, 480, 4636 [NASA ADS] [CrossRef] [Google Scholar]
- Schulze, F., Remus, R.-S., Dolag, K., et al. 2020, MNRAS, 493, 3778 [CrossRef] [Google Scholar]
- Scognamiglio, D., Tortora, C., Spavone, M., et al. 2020, ApJ, 893, 4 [CrossRef] [Google Scholar]
- Spavone, M., Capaccioli, M., Napolitano, N. R., et al. 2017, A&A, 603, A38 [NASA ADS] [CrossRef] [EDP Sciences] [Google Scholar]
- Spiniello, C., Tortora, C., D’Ago, G., et al. 2021, A&A, 646, A28 [EDP Sciences] [Google Scholar]
- Springel, V., Pakmor, R., Pillepich, A., et al. 2018, MNRAS, 475, 676 [NASA ADS] [CrossRef] [Google Scholar]
- Tacchella, S., Diemer, B., Hernquist, L., et al. 2019, MNRAS, 487, 5416 [CrossRef] [Google Scholar]
- Tenneti, A., Mandelbaum, R., Di Matteo, T., Kiessling, A., & Khandai, N. 2015, MNRAS, 453, 469 [NASA ADS] [CrossRef] [Google Scholar]
- Thomas, D., Maraston, C., Bender, R., & Mendes de Oliveira, C. 2005, ApJ, 621, 673 [NASA ADS] [CrossRef] [Google Scholar]
- Trujillo, I., Förster Schreiber, N. M., Rudnick, G., et al. 2006, ApJ, 650, 18 [NASA ADS] [CrossRef] [Google Scholar]
- Trujillo, I., Ferré-Mateu, A., Balcells, M., Vazdekis, A., & Sánchez-Blázquez, P. 2014, ApJ, 780, L20 [NASA ADS] [CrossRef] [Google Scholar]
- van der Wel, A., Franx, M., van Dokkum, P. G., et al. 2014, ApJ, 788, 28 [NASA ADS] [CrossRef] [Google Scholar]
- van de Sande, J., Bland-Hawthorn, J., Fogarty, L. M. R., et al. 2017, ApJ, 835, 104 [NASA ADS] [CrossRef] [Google Scholar]
- van Dokkum, P. G., Franx, M., Kriek, M., et al. 2008, ApJ, 677, L5 [NASA ADS] [CrossRef] [Google Scholar]
- van Dokkum, P. G., Whitaker, K. E., Brammer, G., et al. 2010, ApJ, 709, 1018 [NASA ADS] [CrossRef] [Google Scholar]
- Veale, M., Ma, C.-P., Greene, J. E., et al. 2017, MNRAS, 471, 1428 [Google Scholar]
- Vogelsberger, M., Genel, S., Springel, V., et al. 2014, MNRAS, 444, 1518 [NASA ADS] [CrossRef] [Google Scholar]
- Weinberger, R., Springel, V., Hernquist, L., et al. 2017, MNRAS, 465, 3291 [NASA ADS] [CrossRef] [Google Scholar]
- Wellons, S., Torrey, P., Ma, C.-P., et al. 2015, MNRAS, 449, 361 [NASA ADS] [CrossRef] [Google Scholar]
- Wellons, S., Torrey, P., Ma, C.-P., et al. 2016, MNRAS, 456, 1030 [NASA ADS] [CrossRef] [Google Scholar]
- White, S. D. M., & Rees, M. J. 1978, MNRAS, 183, 341 [NASA ADS] [CrossRef] [Google Scholar]
- Wu, X., Gerhard, O., Naab, T., et al. 2014, MNRAS, 438, 2701 [NASA ADS] [CrossRef] [Google Scholar]
- Zemp, M., Gnedin, O. Y., Gnedin, N. Y., & Kravtsov, A. V. 2011, ApJS, 197, 30 [NASA ADS] [CrossRef] [Google Scholar]
- Zibetti, S., Gallazzi, A. R., Hirschmann, M., et al. 2020, MNRAS, 491, 3562 [CrossRef] [Google Scholar]
- Zjupa, J., & Springel, V. 2017, MNRAS, 466, 1625 [NASA ADS] [CrossRef] [Google Scholar]
Appendix A: Tables
Here, we provide tables reporting relevant physical relations derived throughout this paper. Tables A.1–A.4 contain the median stellar mass density and cumulative stellar mass fraction profiles for the in-situ and the ex-situ components in each of the four accretion classes, as shown in Fig. 3. Table A.5 reports the median local relations between ex-situ mass fraction fexsitu, rotational support V*/σ*, and intrinsic shapes (quantified by the triaxiality parameter T and the minor-to-major axis ratio q), as in Figs. 10 and 13. These relations are derived using all the ETGs more massive than 1010.6 M⊙, without dividing into stellar mass bins. Table A.6 contains the median transition radius RT, exsitu between the in-situ- and ex-situ-dominated regions in class 2 ETGs (as in Fig. 20, black curve).
Stellar-mass-density and cumulative stellar-mass-fraction profiles for the in-situ and ex-situ components of ETGs in accretion class 1.
As in Table A.1, but for ETGs in accretion class 2.
As in Table A.1, but for ETGs in accretion class 3.
As in Table A.1, but for ETGs in accretion class 4.
Local relations between the stellar halo structural parameters (rotational support Vtot/σtot, minor-to-major axis ratio q, and triaxiality parameter T) and the fraction of ex-situ stars fexsitu.
Median transition radius RT, exsitu between in-situ and ex-situ-dominated regions in class 2 ETGs as a function of stellar mass (Fig. 20).
All Tables
Stellar-mass-density and cumulative stellar-mass-fraction profiles for the in-situ and ex-situ components of ETGs in accretion class 1.
Local relations between the stellar halo structural parameters (rotational support Vtot/σtot, minor-to-major axis ratio q, and triaxiality parameter T) and the fraction of ex-situ stars fexsitu.
Median transition radius RT, exsitu between in-situ and ex-situ-dominated regions in class 2 ETGs as a function of stellar mass (Fig. 20).
All Figures
|
Fig. 1. V/σ profiles for an example FR galaxy with M* = 1011.4 M⊙ and counter-rotating ex-situ component in the halo. The V*/σ*(R) profile for the stars (Eqs. (9) and (10), green dashed line) is compared with the V/σ(R) profile derivable from the smoothed velocity fields as in Eq. (11) (open circles), with the |U*, Z(R)|/[σ*(R)] profile (dashed black line), and with the weighted sum of the in-situ and ex-situ contributions (as in Eq. (12), dashed gray curve). The individual un-weighted profiles of the in-situ and ex-situ stars are shown with red and blue curves: the solid lines show the contribution to the mean velocity from the major axis rotation Ui, Z(R)/[σ*(R)], the dotted lines show the contribution from minor axis rotation Ui, X(R)/[σ*(R)]. |
| In the text | |
|
Fig. 2. Accretion parameters as a function of stellar mass for ETGs in TNG100, and separately for FRs and SRs: total in-situ mass fraction (top left), fraction of new in-situ stars since z = 1 (top right), mean accreted gas fraction (bottom left), and redshift of the last major merger (bottom right). The solid lines show the median profiles for the whole sample (black) and for FRs (blue) and SRs (red). The shaded regions show the quartiles of the distributions. FRs and SRs follow similar trends with M*, but at fixed M*, SRs have on average more accreted stars, they accreted less gas, and they had more recent major mergers. |
| In the text | |
|
Fig. 3. Accretion classes for the simulated sample of ETGs. Top: median stellar-mass-density profiles for each of the four classes defined in Sect. 4.1. The black lines show the median total density profiles, and the red and blue lines show the median density profiles of the in-situ and the ex-situ stars respectively. The shaded regions show the quartiles of the distributions. Bottom: median cumulative stellar-mass-fraction profiles for the in-situ and ex-situ components in the four accretion classes. The shaded regions show the quartiles of the distributions. |
| In the text | |
|
Fig. 4. Total in-situ mass fraction as a function of the stellar mass for the four accretion classes. Solid lines show the median profiles for each class and the shaded regions the 25th to 75th percentiles. Dashed vertical lines show the stellar mass bins considered in the text. The dotted horizontal lines show the bins in in-situ mass fraction. Each accretion class dominates at a different stellar mass and is characterized by a different total in-situ mass fraction. |
| In the text | |
|
Fig. 5. Local median mass fraction f(R) of the in-situ and ex-situ stars (dashed lines). The ex-situ component is then split according to its origin from major, minor, mini mergers, or from stripped galaxies (solid lines, see legend). Galaxies are shown divided into accretion classes (left column) and into stellar mass bins (right column). The spatial distributions of the in-situ and ex-situ components, as well as of the accreted stars contributed by different kinds of mergers, vary for different accretion classes and stellar mass bins. |
| In the text | |
|
Fig. 6. Merger history in different accretion classes. Left: median accretion history parameters as a function of the stellar mass. Right: median mass fractions from different mass ratio mergers and from stripped galaxies as a function of the stellar mass. Shaded regions or error bars show the 25th to 75th percentiles of the distributions. In the bottom left panel (number of major mergers since z = 1) we show mean profiles and standard deviations around the mean. Galaxies are divided into the accretion classes as shown in the legend. The accretion classes defined in Sect. 4.1 are the results of different merger histories. |
| In the text | |
|
Fig. 7. Fraction of FRs (left) and SRs (right) that populate each accretion class as a function of stellar mass, represented with a cumulative bar plot. The open circles show the fraction of fast or slow rotators in each mass bin. The vertical dashed lines represent the stellar mass bins adopted in the paper. FRs and SRs populate the four accretion classes differently, highlighting the different accretion histories of the two classes, but also that several formation pathways can lead to the formation of a FR or a SR. |
| In the text | |
|
Fig. 8. V/σ(R) profiles for the TNG FRs (top panels) and SRs (bottom panels) divided into mass bins. In the two sets of panels, the first rows show the median V*/σ* profiles of all the stars in black. The red and blue curves are the median fi(R)Ui, Z(R)/σ*(R) profiles for the in-situ and ex-situ stars, respectively. The sum of these median profiles approximates the median V*/σ*(R) profiles up to a median absolute difference of 0.02. The middle and bottom rows show the median |
| In the text | |
|
Fig. 9. Effect of mergers on the V*/σ*(R) profiles. A: major mergers. Median profiles for the FRs (top left) and the SRs (bottom left) in bins of accreted mass fraction from major mergers ΔM*, major/M*. The right panels show the median V*/σ*(R) for different Δinsitu, z ≤ 1 fractions and within a narrow range of ΔM*, major/M* fractions. Major mergers erase the peak in rotation and flatten the profiles. The presence of cold gas preserves or builds up the centrally rotating component. B: mini mergers. Median profiles for ETGs with negligible fraction of accreted mass from major, minor mergers, or stripped from surviving galaxies in bins of accreted mass fraction from mini mergers ΔM*, mini/M*. The left panel shows galaxies with Δinsitu, z ≤ 1 lower than the median Δinsitu, z = 0 = 0.61 for class 1 galaxies (i.e., with lower recent star formation), while the right panel shows those with Δinsitu, z ≤ 1 higher than the median. Mini mergers are not massive enough to modify the peak in rotation, but on average, and for low-mass systems, tend to increase the rotational support at large radii. |
| In the text | |
|
Fig. 10. Local correlation between rotational support and accreted fraction in the stellar halos. Each data point corresponds to a local measurement at a radius R ∈ [3−8Re] within each galaxy. Blue circles show measurements within FRs, red circles within SRs. The solid lines show the median, the error-bars the quartiles, and the shaded regions the 10–90 percentiles of the V*/σ*(fexsitu) distributions. Galaxies are divided into stellar mass bins as labeled. At high local ex-situ mass fractions the stellar halo rotational support V*/σ* decreases. |
| In the text | |
|
Fig. 11. Median stellar intrinsic shape profiles for FRs and SRs as labeled on the right margins. Top panels: triaxiality T(r), bottom panels: axis ratio q(r). Galaxies on the left are divided into stellar mass bins, and galaxies on the right are divided in bins of total in-situ mass fraction. The solid lines show the median profiles, and the shaded regions trace the quartiles of the distributions. Higher stellar masses and accreted fractions correspond to higher triaxiality and less flattened shapes. |
| In the text | |
|
Fig. 12. Effect of mergers on the intrinsic shape profiles. A: major mergers in FRs (top) and SRs (bottom). The solid lines show the median triaxiality profiles in bins of accreted mass fraction from major mergers ΔM*, major/M* (left panel) and in bins of Δinsitu, z ≤ 1 for 0.1 ≤ ΔM*, major/M* ≤ 0.3 (right panel). The shaded regions show the quartiles of the distributions. Major mergers increase the triaxiality at large radii, especially when the fraction of recently accreted gas is low. B: effect of mini mergers on the intrinsic shape profiles T(r) (top) and q(r) (bottom) for ETGs with negligible accreted mass from major mergers, minor mergers, and stripped from surviving galaxies. The solid lines show median profiles in bins of accreted mass fraction from mini mergers ΔM*, mini/M*; the shaded regions show the quartiles of the distributions. left panel: galaxies with Δinsitu, z ≤ 1 < 0.5 (i.e., with lower recent star formation), the right panel those with Δinsitu, z ≤ 1 > 0.5. Mini mergers do not significantly influence the galaxy triaxiality but tend to increase the stellar halo flattening. |
| In the text | |
|
Fig. 13. Local correlation between stellar halo intrinsic shape and fraction of accreted stars in stellar mass bins. Each galaxy is represented by about six data points, measured in ellipsoidal shell with semi-major axis r ∈ [3.5−8Re]. The correlations are clear for galaxies more massive than M* > 1010.6 M⊙. Low fexsitu is consistent with near-oblate shapes with low axis ratio q. At higher fexsitu the stellar halo triaxiality parameter increases while the q(fexsitu) correlation reaches a maximum of q ∼ 0.6 for fexsitu ∼ 0.7, beyond which the q decreases. |
| In the text | |
|
Fig. 14. Local relation between galaxy intrinsic shapes and the local fraction of accreted stars for galaxies with M* ≥ 1010.6 M⊙. The top panels show q(fexsitu), the bottom panels T(fexsitu). In the left panels, galaxies are color-coded according to the fraction of accreted mass from major mergers ΔM*, major/M*, in the right panels colors indicate the fraction of in-situ stars produced since z = 1, Δinsitu, z ≤ 1. The local ex-situ fraction parametrizes the different galaxy accretion histories: the break in q(fexsitu) is driven by recent dry major mergers in massive systems; the most triaxial galaxies are systems with the lowest fractions of recently accreted cold gas, while low T stellar halos are formed in more gas-rich systems. |
| In the text | |
|
Fig. 15. Local stellar vs. dark matter rotational support (V/σ, top panels) and intrinsic shape (axis ratios q and p, respectively in the middle and bottom panels) for all galaxies in 12 radial shells with r ∈ [1Re − 8Re]. Local measurements are color coded according to the local ex-situ fraction fexsitu. Galaxies are divided into stellar mass bins as labeled at the top of the respective columns. The dashed diagonal lines show the relations y = x, y = x/10, and y = x/100. Rotation and shapes of stars and dark matter halo become similar with increasing fexsitu. |
| In the text | |
|
Fig. 16. A: distribution of misalignments of the principal axes of the stellar and dark matter components for different local ex-situ fractions fexsitu as shown in the legend. Top panels: misalignments of major axes for the nonoblate systems. Bottom panels: misalignments of minor axes for the nonprolate systems. B: distribution of misalignments in the direction of rotation of the stellar and dark matter components for different local ex-situ fractions fexsitu. In each panel, we distinguish between central regions (1–2Re) and outskirts (4–8Re) and we show only distributions containing at least 20 galaxies. Stellar and dark matter components are increasingly aligned with increasing fexsitu. |
| In the text | |
|
Fig. 17. Coupling between stellar and dark matter components from major and minor mergers. A: major mergers. The left panels show all the TNG ETGs, color coded by their fraction of stellar mass accreted by major mergers. On the right we consider only galaxies with at least 30% of their stellar mass accreted from major mergers and color code them according to the fraction of recently produced in-situ stars Δinsitu, z ≤ 1. Major mergers cause the coupling between stellar and dark matter components, especially in galaxies that have not recently accreted cold gas. B: minor mergers. Here we consider galaxies with stellar mass fraction accreted from major mergers in the narrow range 0.1 < ΔM*, major/M* < 0.2. In the left panels, galaxies are color coded by the fraction of stellar mass accreted from minor mergers ΔM*, minor/M* and on the right by the fraction of recently produced in-situ stars Δinsitu, z ≤ 1. Dry minor mergers also help to set up the similarity between stellar and dark matter halo structure. |
| In the text | |
|
Fig. 18. Top: two examples of high-redshift CPs. in TNG100, progenitors of a FR (left) and of a SR (right). Both CPs are shown edge-on and have rather disky shapes. Physical parameters are reported in the figure. Center: mass functions of the entire sample of TNG ETGs (gray dashed), of the ETGs descending from a compact progenitor (magenta dashed), and of the ETGs with “surviving compact progenitor cores” (CP-cores, magenta solid line). The distribution of galaxies whose main progenitors were never compact is also shown (gray solid line). Bottom: fraction of galaxies, in mass bins, with compact progenitors, with surviving CP-cores, and with surviving CP-cores for SRs only and split by accretion class. The fraction of galaxies with CPs is a strong function of stellar mass but the fraction of objects with surviving CP-cores is nearly constant at ∼20% at M* ≳ 1010.7 M⊙, and decreases at lower masses. |
| In the text | |
|
Fig. 19. Sample of galaxies with surviving CP cores (magenta) compared to the whole sample of ETGs (gray). Panels show redshift of the last major merger, fraction of recently formed in-situ stars Δinsitu, z ≤ 1, rotational support V/σ, and minor-to-major axis ratio q at 1Re as functions of stellar mass. Solid lines show the median profiles and shaded regions enclose the quartiles of the distributions. Galaxies with CP-cores had fewer recent major mergers, formed fewer in-situ stars after redshift z = 1, and are characterized by lower rotational support and rounder shapes than all ETGs of similar mass. |
| In the text | |
|
Fig. 20. Median TNG100 kinematic transition radii (red, green, and blue solid curves) as a function of galaxy stellar mass, compared with the median transition radius RT, exsitu between in-situ- and ex-situ-dominated regions (black line). All the curves are obtained from FR galaxies of class 2 (see Fig. 3) with well-defined Rexsitu between in-situ-dominated centers and ex-situ-dominated outskirts. The number of galaxies used to produce each curve is reported in the legend. |
| In the text | |
Current usage metrics show cumulative count of Article Views (full-text article views including HTML views, PDF and ePub downloads, according to the available data) and Abstracts Views on Vision4Press platform.
Data correspond to usage on the plateform after 2015. The current usage metrics is available 48-96 hours after online publication and is updated daily on week days.
Initial download of the metrics may take a while.